


Abstract
There is limited evidence of an association between the burden of atrial fibrillation (AF)-related symptoms and depressed mood (DM). We used follow-up data from two randomized trials to relate AF symptoms, perceived AF burden, and DM.
Baseline data on 319 persistent AF patients from the Flec-SL trial and 244 paroxysmal AF patients from the ANTIPAF trial were available. Data on 400 patients were available at 6-month follow-up. Depressed mood was measured using the major depression inventory, AF symptoms using the AF Symptom Checklist. Generalized estimating equation models were used to assess the association between symptom burden and DM. At baseline, 194 patients (35.2%) reported DM, 294 (52.2%) reported severe AF symptom burden. Burden from all symptoms except fainting was significantly elevated in patients with DM. An improvement in DM from baseline to follow-up was associated with reduced symptom burden [odds ratio (OR) = 2.06; 95% confidence interval (CI): 1.22–3.51]. Patients with DM had three-fold increased odds of severe symptom burden after adjustment for perceived AF-frequency and -duration, sex, and chronic obstructive pulmonary disorder (COPD) (OR = 3.19; 95% CI: 2.65–8.45). Women reported significantly more severe symptom burden than men (OR = 1.44; 95% CI: 1.36–1.95). Uneasiness, nausea, and shortness of breath were most strongly associated with DM. The effect of DM on nausea was more pronounced for men (Pinteraction = 0.041). Perceived AF-frequency and -duration were not associated with DM (P = 0.717 and 0.236, respectively).
Depressed mood is associated with AF symptom burden over 6 months after adjustment for perceived frequency and duration of AF episodes, COPD, and sex.
Depressed mood is associated with AF-related symptoms, controlling for clinical factors and the perceived duration and frequency of AF episodes.
Improvements in depressed mood are correlated with improvements in AF symptom burden.
Depressed mood is more strongly associated with nausea in men than in women.
Introduction
Atrial fibrillation is the most common cardiac arrhythmia in adult populations and contributes strongly to the risk of developing severe diseases including stroke1 and cognitive impairment.2 In addition, atrial fibrillation (AF) impairs health-related quality of life (HRQoL),3 and is associated with depression.4,5
Whilst a large body of evidence shows that depression and anxiety exacerbate pain perceptions and the reporting of somatic symptoms in patients with a variety of disease conditions,6 only a limited number of studies have shown that depression is associated with an increased severity of symptoms attributed to AF.5,7–9 This relationship is likely bi-directional. On the one hand, severe AF symptoms and declining HRQoL may remind patients of their disease and affect mood, but depression may also amplify the perception of AF symptoms, for example due to rumination10 and a heightened interoceptive perception.11 Previous studies have also shown depression and anxiety to be associated with patient perceptions of the frequency and duration of AF episodes.7,9
Therefore, the main aim of this investigation was to study the association between depressed mood (DM) and AF symptoms using a prospective study design. Secondly, we aimed to elucidate which symptoms were most strongly associated with DM, and to assess sex differences in this regard. Finally, we assessed whether DM was associated with perceived AF-frequency and AF-duration.
Patients and methods
Setting
We analysed data from two multicentre clinical trials: (i) the Targeted Pharmacological Reversal of Electrical Remodelling after Cardioversion Trial (Flec-SL–AFNET 3)12 and (ii) the Angiotensin II-Antagonist in Paroxysmal Atrial Fibrillation Trial (ANTIPAF–AFNET 1).13 Baseline data in the present study were collected from 2005 to 2009 for Flec-SL and from 2005 to 2008 for ANTIPAF. Health-related quality of life data for persistent AF patients were available at baseline (time (t) 1) and 6-month follow-up (t2) in Flec-SL–AFNET 3 and for paroxysmal AF patients at baseline (t1), 6-month follow-up (t2), and 12-month follow-up (t3) in ANTIPAF–AFNET 1. Enrolment into both trials occurred exclusively in AFNET study centres, and several study sites enrolled into both trials simultaneously. Both trials excluded patients with severe structural heart disease, defined as unsuitability for flecainide therapy in Flec-SL–AFNET 3, and as an indication for ACE inhibitor or sartan therapy in ANTIPAF–AFNET 1. The inclusion and exclusion criteria are summarized in (Supplementary material online, Table A1).
The web-based electronic data capture system MARVIN was managed by the Institute of Clinical Cardiovascular Research (IKKF, Munich). The primary route of data entry was via Internet. All information was kept confidential and data transmission was encrypted. The study was approved by the institutional Ethics Committee, and informed consent was obtained from all patients.
Study population
Data from both trials, which used identical databases, were pooled together, yielding a total sample of 770 patients at baseline and 531 at 6-month follow-up (for whom full HRQoL data were available). After deleting missing variables in the outcome and exposure, the final study population amounted to 563 patients at baseline and 400 patients at 6-month follow-up. Sample sizes at all time-points and after a multilevel deletion process are shown in Figure 1. The stages of deletion and imputation are described below:
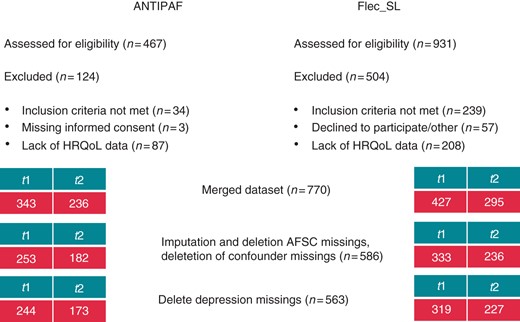
Flow chart of the study sample and the deletion steps at all time-points for both ANTIPAF and Flec-SL; t1 = baseline, t2 = 6-month follow-up.
Missing data of patients that answered at least 60% of the AF Symptom Checklist (AFSC) items were set to a score of 1 (not affected), since it is likely to have been their intention to answer this way. After exclusion of patients with missing values after imputation in the AFSC scale, 586 patients were left at baseline. After exclusion of missing values in the major depression inventory (MDI), 563 patients remained at baseline, and 400 patients at 6-month follow-up. Female patients were more likely to be excluded in this process (P < 0.001), and excluded patients were significantly older (P < 0.001).
Furthermore, for the multivariate regression models, missing values in covariates which satisfied the inclusion criteria were deleted. At baseline, 521 patients remained whilst at 6-month follow-up, 350 patients remained. Participants who were excluded at this stage did not differ from those not excluded in terms of sex and age.
Measurement of atrial fibrillation-related symptoms
Atrial fibrillation-related symptom burden was measured by the AFSC,14 which includes 10 symptoms of AF: chest pain, dizziness, shortness of breath, nausea, palpitations, skipped heartbeat, fainting, extrasystole, racing heartbeat, and uneasiness. The scale consists of 10, 6-point Likert scaled questions. By adding these 10 ratings, a sum score is derived, which ranges from 10 to 60. The continuous AF symptom burden variable can only take integer values and was not normally distributed, so the score was dichotomized at the median value, and a four-category variable was built in accordance with quartiles of the distribution. Patients with a score ≥22 were categorized as having severe perceived AF-related symptom burden.
The perceived (subjective) frequency of AF episodes was measured as follows: patients were classified as having severe perceived AF-frequency reported having AF episodes daily or more often. Patients, who reported that their episodes of AF lasted a whole day or longer, were classed as having severe perceived AF-duration.
Measurement of depressed mood
The MDI15 was used to measure DM. The scale consists of 10 items, rated on a 6-point Likert scale, which may be applied as a rating scale to diagnose DM states according to ICD-10, and major depressive disorder (MDD) according to DSM-IV.15 A sum score ranging from 0 to 50 is derived via the rating scale algorithm. Respondents are considered to have no DM with a score from 0 to 19, mild DM with a score from 20 to 24, moderate DM from 25 to 29, and high DM with a score of 30 or more. For this study, due to violation of the assumption of linearity in the association with AF symptom burden the DM variable was transformed into a four-category variable and dichotomized into the following categories: none/mild and moderate/severe DM.
Covariates
Age, sex, and unemployment were the sociodemographic variables analysed in this study. Atrial fibrillation risk factors included alcohol consumption (high alcohol consumption = regular to excessive drinkers), diabetes, family history of coronary heart disease (CHD), hyperlipidaemia, hypertension, physical inactivity (index = patients who exercise less than three times a week), smoking (index = current smokers), and body mass index (BMI).
Cancer, CHD, chronic obstructive pulmonary disorder (COPD), thrombo-embolic complications (including: stroke, transitory ischaemic attack, peripheral/pulmonary emboli), and valve disease were included as comorbidities.
Left ventricular ejection fraction, dilated left atrium, AF-type (index = persistent AF), perceived AF-frequency, and AF-duration were also considered as AF-specific conditions.
Finally, time (in months) was used to account for differences in associations between baseline and follow-up examination.
Statistical analyses
The generalized estimating equation model
The association between DM and AF symptom burden was assessed using generalized estimating equation (GEE)models.16 These models can account for dependencies between repeated observations of patients, therefore, allowing the data of patients to be analysed at all time-points. The GEE model also takes the within-subject variability into account. More data may be included in the models, since the information of a patient with only one visit may be included.
Univariate analyses
For univariate analyses at baseline, associations between categorical variables were assessed by the χ2 test; for continuous variables, the t-test was applied for assessing group differences in normally distributed variables, the Wilcoxon test was used for variables which were not normally distributed. Spearman correlation was used for inter-correlation checks at baseline. The McNemar's test was used to assess the association of categorical variables from baseline to 6-month follow-up in a dataset of patients for whom data is available at baseline and 6-month follow-up (n = 243). Associations of improvers, impairers, and stable patients with regard to AF symptom burden and depression were assessed using the odds ratios (ORs) and the χ2 test in this dataset as well.
Multivariate analyses
In multivariate analyses, GEE models were constructed with a backward variable selection to assess the association between DM and AF symptom burden, controlling for potential confounders. For the variable selection procedure of our model, variables with an entry criterion of P < 0.25 in baseline univariate analyses were chosen as covariates. The stay criterion for inclusion in the final model was a significant association (P < 0.05).
Perceived AF-frequency and AF-duration were strongly inter-correlated, thus, separate models were calculated: one with AF-frequency and one with AF-duration.
All statistical analyses were run in SAS (Version 9.2, SAS Institute, Inc., Cary, NC, USA). The GEE models were estimated with the GENMOD procedure. The significance level was set at 0.05. The analysis and the description in this paper follow the STROBE guidelines for cohort studies.
Results
Association of patient characteristics with depressed mood and severe atrial fibrillation symptom burden at baseline—univariate analyses
The study population at baseline included 386 male patients (68.6%) and 177 (31.4%) female patients, with a mean age of 62 (SD = 10.8) years. One hundred and ninety-eight patients (35.2%) were identified with DM, and 294 (52.2%) with severe AF symptom burden.
Table 1 describes the association of patient characteristics with DM at baseline. Patients who were female, had hypertension, persistent AF, cancer and those who were physically inactive were more likely to report DM. The perceived frequency and duration of AF were not, however, associated with DM.
Description and univariate analysis of associations with DM at baseline (n = 563)
| Variables | No/mild DM (n = 365) | Medium/high DM (n = 198) | OR (LCL; UCL) | P-value |
|---|---|---|---|---|
| Sociodemographic | ||||
| Age | 61.7 (10.5) | 61.7 (11.2) | 0.957 | |
| Sex (male) | 262 (71.8) | 124 (62.6) | 1.5 (1.1–2.2) | 0.026 |
| Unemployed | 14 (3.9) | 6 (3.1) | 0.611 | |
| AF risk factors | ||||
| High alcohol consumption | 281 (77) | 145 (73.2) | 0.322 | |
| Diabetes | 33 (9) | 20 (10.1) | 0.681 | |
| Family CHD history | 68 (18.6) | 49 (24.8) | 0.089 | |
| Hyperlipidaemia | 99 (28.5) | 66 (35.1) | 0.116 | |
| Hypertension | 200 (54.8) | 131 (66.6) | 0.62 (0.4–0.9) | 0.009 |
| Physical inactivity | 260 (71.2) | 159 (80.3) | 0.61 (0.4–0.9) | 0.019 |
| Smoking | 29 (8.3) | 22 (11.6) | 0.220 | |
| BMI | 27.4 (5.2) | 27.5 (6.6) | 0.354 | |
| Comorbidities | ||||
| Cancer | 6 (1.7) | 11 (5.6) | 3.5 (1.3–9.61) | 0.010 |
| CHD | 19 (5.4) | 14 (7.3) | 0.385 | |
| COPD | 8 (2.2) | 6 (3.1) | 0.536 | |
| Thrombo-embolic complications | 17 (4.7) | 13 (6.6) | 0.336 | |
| Valvular heart disease | 35 (9.6) | 23 (11.6) | 0.450 | |
| AF-specific conditions | ||||
| Left ventricular ejection fraction | 60 | 62 | 0.602 | |
| Dilated left atrium | 222 (61.7) | 131 (66.2) | 0.292 | |
| AF-type (persistent) | 184 (50.4) | 135 (68.2) | 2.1 (1.5–3) | <0.001 |
| Severe perceived AF-frequency | 204 (56.4) | 113 (58) | 0.717 | |
| Severe perceived AF-duration | 207 (57.5) | 121 (62.7) | 0.236 | |
Values are either mean (SD) or n (%) at baseline. Body mass index values show the median (interquartile range). P values are derived from the t-test and the χ2 test; for BMI, the Wilcoxon test was used. Significant P values are indicated by bold font.
OR, odds ratio; LCL, lower confidence limit; UCL, upper confidence limit.
Table 2 describes associations of covariates with mild and severe (AFSC score ≥22) AF symptom burden. Female sex, hyperlipidaemia, hypertension, COPD, thrombo-embolic complications, and perceived severe frequency and duration of AF were significantly associated with AF symptom burden.
Description and univariate analysis of associations with AF symptom burden at baseline (n = 563)
| Variables | Mild symptom burden (n = 269) | Severe symptom burden (n = 294) | OR (LCL; UCL) | P-value |
|---|---|---|---|---|
| Sociodemographic | ||||
| Age | 62.2 (10.7) | 61.2 (10.9) | 0.314 | |
| Sex (male) | 197 (73.2) | 189 (64.3) | 0.7 (0.5–0.9) | 0.023* |
| Unemployed | 8 (3.1) | 12 (4.2) | 0.502 | |
| AF risk factors | ||||
| High alcohol consumption | 207 (77) | 219 (74.5) | 0.497 | |
| Diabetes | 23 (8.6) | 30 (10.2) | 0.502 | |
| Family CHD history | 50 (18.6) | 67 (22.8) | 0.220* | |
| Hyperlipidaemia | 67 (26.5) | 98 (34.8) | 1.5 (1–2.1) | 0.039* |
| Hypertension | 148 (55) | 183 (62.2) | 0.082* | |
| Physical inactivity | 201 (74.7) | 218 (74.2) | 0.877 | |
| Smoking | 21 (8.2) | 30 (10.6) | 0.350 | |
| BMI | 27.4 (5.5) | 27.4 (5.8) | 0.577 | |
| Comorbidities | ||||
| Cancer | 7 (2.6) | 10 (3.5) | 0.566 | |
| CHD | 15 (5.8) | 18 (6.3) | 0.790 | |
| COPD | 4 (1.5) | 10 (3.4) | 0.146* | |
| Thrombo-embolic complications | 11 (4.1) | 19 (6.5) | 0.211* | |
| Valvular heart disease | 22 (8.2) | 36 (12.2) | 0.113* | |
| AF-specific conditions | ||||
| Left ventricular ejection fraction | 61.8 (8.5) | 61.6 (8.5) | 0.738 | |
| Dilated left atrium | 162 (60.9) | 191 (65.4) | 0.270 | |
| AF-type (persistent) | 155 (57.6) | 164 (55.8) | 0.660 | |
| Severe perceived AF-frequency | 160 (59.9) | 157 (54.1) | 0.191* | |
| Severe perceived AF-duration | 175 (53.1) | 153 (53.1) | 0.003* | |
| Mental health conditions | ||||
| DM | 59 (21.9) | 139 (47.3) | 3.2 (2.2–4.6) | <0.001 |
| MDD | 42 (14.3) | 10 (3.7) | 4.3 (2.1–8.8) | <0.001 |
Values are either mean (SD) or n (%) at baseline. Body mass index values show the median (interquartile range). P values are derived from the t-test and the χ2 test; for BMI, the Wilcoxon test was used. Significant P values are indicated by bold font. Severe AF symptom burden = AFSC score ≥22.
OR, odds ratio; LCL, lower confidence limit; UCL, upper confidence limit.
*Considered for model building since P-value <0.25.
Depressed mood and AF symptom burden were strongly associated with a high significance. Patients with DM were three times more likely to report severe AF symptom burden. With the exception of fainting, all AF-related symptoms were significantly elevated in patients identified with DM at baseline, as graphically presented in Figure 2.
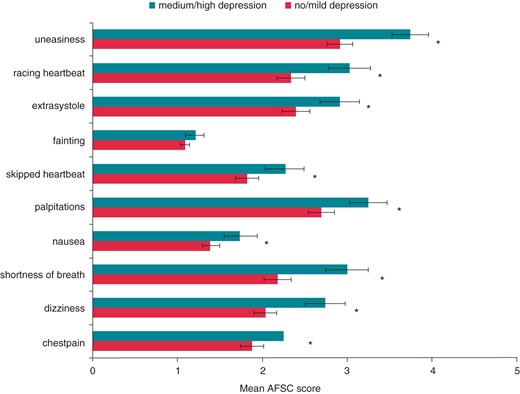
Bar diagram of individual AF symptom means by DM at baseline.
Longitudinal associations of patient characteristics with depressed mood and severe atrial fibrillation symptom burden—univariate analyses
Over 6 months, DM, AF symptom burden, and perceived AF-frequency improved (all P values <0.001) whilst AF-duration did not (P = 0.317). At 6-month follow-up, 102 (25.5%) patients reported DM and 119 (29.8%) patients reported severe AF symptom burden. The frequency of patients with MDD also did not change significantly from baseline to 6-month follow-up (P = 0.201).
Patients who improved in terms of DM from baseline to 6-month follow-up were twice as likely to have improved in terms of AF-related symptom burden status [OR = 2.06; 95% confidence interval (CI): 1.22–3.51] (see Figure 3). Similarly, patients who worsened in terms of DM status had increased odds of worsened AF symptom burden (OR = 3.14; 95% CI: 1.45–6.83, P = 0.003).
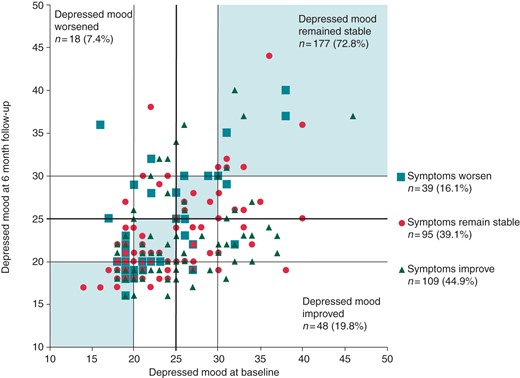
Scatterplot comparing MDI-depression score at baseline and 6-month follow-up (t2), stratified by whether patients improved, worsened, or remained stable in terms of their AF-related symptom burden.
Longitudinal associations of patient characteristics with depressed mood and severe atrial fibrillation symptom burden—multivariate analyses
Multivariate GEE models confirmed that DM is strongly associated with severe AF symptom severity (see Table 3) after adjustment. Patients with DM had an approximately three-fold increased odds for severe AF symptom burden over a 6-month time period after adjustment for sex, COPD, perceived AF-frequency, and (separately) for AF-duration. Family history of CHD, hypertension, thrombo-embolic complications, and valvular heart disease were assessed as confounders but were not significant in the end model.
Longitudinal multivariate GEE models of associations with severe AF-related symptom burden (n = 521 at baseline and 350 at 6-month follow-up)
| Parameter | Estimate | OR (LCL; UCL) | P-value |
|---|---|---|---|
| Perceived AF-frequency model (QIC = 1081.2) | |||
| Sex (female) | 0.365 | 1.44 (1.36–1.95) | 0.028 |
| COPD | 1.22 | 3.40 (1.88–6.38) | 0.012 |
| AF-frequency | 0.365 | 1.44 (1.36–1.96) | 0.016 |
| DM | 1.16 | 3.19 (2.65–8.45) | <0.001 |
| Time (months) | 0.948 | 2.58 (2.26–5.83) | <0.001 |
| Perceived AF-duration model (QIC = 1066.8) | |||
| Sex (female) | 0.325 | 1.38 (1.31–1.81) | 0.052 |
| COPD | 1.252 | 3.50 (1.92–6.73) | 0.009 |
| AF-duration | 0.644 | 1.90 (1.72–3.27) | <0.001 |
| DM | 1.194 | 3.30 (2.72–8.98) | <0.001 |
| Time (months) | 0.96 | 2.61 (2.27–5.94) | <0.001 |
The following covariates did not satisfy the stay criterion of the selection procedures: family history of CHD, hyperlipidaemia, hypertension, thrombo-embolic complications, and valvular heart disease. Significant P values are indicated by bold font.
OR, odds ratio; LCL, lower confidence limit; UCL, upper confidence limit; QIC, quasi-likelihood information criterion.
Separate models were calculated for perceived AF-frequency and AF-duration, due to a strong inter-correlation. The perceived duration of AF episodes was more strongly associated with AF symptom burden than the perceived AF-frequency. Interaction terms of all covariates with time and DM were calculated, and none were significant, thus, the effects of covariates were stable over time, and the effect of DM on AF symptom burden was independent of other factors.
Assessing the relevance of individual atrial fibrillation symptoms
The individual AF symptoms models showed which symptoms were most strongly associated with DM (see Table 4). Uneasiness, nausea, and shortness of breath were the symptoms most strongly associated with DM. Nausea was significantly more strongly associated with DM in men than in women. Furthermore, uneasiness, extrasystole, and shortness of breath reached borderline significance with regard to a sex interaction, whereby the association was stronger in men than in women.
Assessment of individual AF symptoms' associations with DM
| Parameter | Estimate | OR (LCL; UCL) | P-value | Sex interaction estimate | P-value sex interaction |
|---|---|---|---|---|---|
| Individual symptoms models | |||||
| Uneasiness | 1.130 | 3.10 (2.57–7.95) | <0.001 | 0.644 | 0.057 |
| Nausea | 1.090 | 2.97 (2.20–6.55) | <0.001 | 1.113 | 0.041 |
| Shortness of breath | 0.978 | 2.66 (2.26–6.01) | <0.001 | 0.603 | 0.071 |
| Dizziness | 0.978 | 2.65 (2.23–5.91) | <0.001 | 0.389 | |
| Skipped heartbeat | 0.903 | 2.47 (2.05–5.05) | 0.001 | 0.275 | |
| Palpitations | 0.878 | 2.41 (2.08–5.00) | <0.001 | 0.133 | |
| Chest pain | 0.834 | 2.30 (1.92–4.42) | <0.001 | 0.352 | |
| Racing heartbeat | 0.720 | 2.05 (1.82–3.73) | <0.001 | 0.239 | |
| Extrasystole | 0.578 | 1.78 (1.61–2.88) | <0.001 | 0.643 | 0.069 |
| Fainting | N.S. | ||||
Significant P values are indicated by bold font. In each individual symptoms model, the AFSC was substituted by a single symptom. The individual symptom models were also adjusted for sex, COPD, and perceived AF-frequency.
OR, odds ratio; LCL, lower confidence limit; UCL, upper confidence limit.
Assessing the association of depressed mood with perceived atrial fibrillation-frequency and duration
At baseline, perceived AF-frequency and AF-duration, as reported by the patients, were not associated with DM (see Table 1). Multivariate GEE models were calculated with perceived AF-frequency and AF-duration as independent variables. In the multivariate models adjusting for sex, age, and AF-type, DM did not predict perceived AF-duration (P = 0.349) nor AF-frequency (Padjusted = 0.843). Tables for these multivariate models may be found in (Supplementary material online, Table A2).
Discussion
In the present study, we have shown that, over a 6-month period, DM is significantly associated with AF-related symptom burden with a strong effect. Improvements and impairments in depression over the 6-month period were associated with improvements or impairments in symptom burden, respectively. In adjusted models, DM was associated with three-fold increased odds of reporting severe AF symptom burden, after adjustment for the perceived duration and frequency of AF episodes, as reported by the patients. Depression was more strongly associated with nausea in men than in women. No significant association was found between patient-reported perceptions of AF episode duration or frequency.
The main results of the present investigation show that DM, which is not severe enough to be considered a clinical mental health condition, has a profound impact on AF patients' perceptions of the severity of their symptoms. A dose–response effect is evident since patients with MDD had approximately four-fold increased odds of severe AF symptom burden. In the present investigation, the prevalence of DM improved slightly over the study period, but there was no significant difference in the frequency of patients with MDD. It was beyond the scope of the present study to quantitatively assess causation, however, it was apparent that, whilst DM may change over 6 months, perhaps due to improvements in the underlying disease, improved mood due to illness beliefs after receiving treatment, or other exogenous factors, MDD is a severe condition which is unlikely to be affected considerably by the patient's disease severity.
Several studies have suggested that psychological distress is linked with AF-related symptom severity.7–9 These studies have shown this association with the disease-specific University of Toronto AF Severity Scale,7,9 the Atrial Tachyarrhythmia Symptom Severity Scale,8 and, in 300 patients with persistent and paroxysmal AF, the Canadian Cardiovascular Society Severity of AF Scale.7 Many of these studies were limited by small sample sizes or by the cross-sectional design. Whilst one longitudinal investigation with a large sample size (n = 378) has shown that AF symptoms may improve with treatment, whilst depression and anxiety do not,9 another longitudinal investigation of 52 patients with persistent AF showed that improvements in AF-related symptoms do indeed correlate with changes in DM.8 Previous investigations found that depression is associated with patient perceptions of episodes ofAF.7,9 In the present investigation, we replaced AF symptom burden with perceived AF frequency and duration, as was done in previous studies.9 Whilst entering the same variables into the GEE model, we did not find an association between perceived AF-frequency and -duration with DM (see Table A2).
Whilst to the lay-person it may be instinctive that symptom improvements may affect mood, the results of the present investigation add to a growing body of literature indicating that depression influences the subjective burden of AF symptoms, and thus imply that treatment of psychological comorbidities may be beneficial for the management of symptoms and thus also HRQoL, as has been shown to be the case with regard to other disease conditions.6 More research is warranted, however, to replicate existing results and further our understanding of the causal mechanisms in AF patients.
Mechanisms for the association between depressed mood and atrial fibrillation-related symptom burden
A large body of research shows that depression can exacerbate the severity of somatic symptoms. Depression, anxiety, and pain are intrinsically linked due to shared neurobiological mechanisms for mood and the processing of pain signals.17 Rumination and heightened attentional focus also play a role here.10 Depression may be considered to cause an altered interoceptive state, which may strengthen perceptions of pain.11 With regard to a wide range of disease conditions, depression and anxiety are associated with somatic symptoms as much as physiological measures, and treatment of psychological comorbidities can ameliorate somatic symptoms.6 The most symptomatic AF patients may also be at risk of depression, which has severe consequences for disease progression. Studies have shown the predictive power of depression for worsened outcomes after cardiac surgery18 and that depression affects HRQoL and physicians' interpretations of their patients HRQoL.19 The measuring and evaluation of changes in HRQoL are critical in the evaluation of treatment strategies for AF patients,3 and thus, it is important to understand the role of depression, and its relationship with QoL and perceptions of AF symptom burden.
Comparisons of secondary results to previous research
In the present investigation, women reported severe AF symptom burden significantly more frequently than men in unadjusted and adjusted analyses. A large body of evidence has shown that women generally report more severe symptoms than their male counterparts in population-based and clinical investigations.20 It has been suggested that women may have a heightened interoceptive perception of body-related signals, and also the reporting of sickness may be more socially acceptable for them. It has also been suggested that the effect may be explained by the higher prevalence of psychological comorbidity in women. However, in the present study, although women more reported DM significantly more frequently, there was no significant sex interaction in the models of AF symptom severity.
Although it has been shown that patients with persistent AF tend to report fewer symptoms than patients with paroxysmal AF, in the present study, AF symptom burden was not significantly associated with AF-type. Palpitations, racing heartbeat, and shortness of breath, however, were more frequently reported in persistent patients (data not shown).
Study strengths and limitations
The large sample size (n = 563) and the longitudinal design are the major strengths of this study, as is the homogeneous setting of inclusion within the AFNET study network. Even though this study uses clinical data, the patients recruited by the AFNET have been recruited from a range of clinical populations around Germany, which, in comparison to a host of other clinical studies, increases the generalizability. Potential centre effects are minimalized by overlapping enrolling centres and procedures for both trials.
Although mechanisms for the effect of depression driving subjective symptom burden have been described in the previous literature, this study does not suffice to show causation.
Conclusion
Depressed mood and MDD are strongly related to AF-related symptom burden after adjustment for relevant clinical factors including the perceived frequency and duration of episodes of AF. There is strong evidence that depression impacts AF symptom severity. Identifying depression in AF patients and appropriate therapy may be beneficial for symptom management. Future studies should investigate whether screening for and treating depression improves AF-related symptoms, quality of care, and decision-making. Adjunctive care interventions to help AF patients cope with their disease should be evaluated.
Supplementary material
Supplementary material is available at Europace online.
Conflict of interest: none declared.
Funding
This work was supported by the AFNET and the budget of the ‘Mental Health’ working group of the Helmholtz Zentrum München (to K.-H.L.). In particular, the authors would like to acknowledge the previous and current board of directors of the AFNET: Günter Breithardt (chairman), Peter Hanrath, Paulus Kirchhof, Thomas Meinertz, Michael Näbauer, Ursula Ravens, and Gerhard Steinbeck (for affiliations, see Supplementary material online, Appendix 3). Andreas Götte was PI of ANTIPAF and Thomas Meinertz Co-PI. Paulus Kirchhof was PI of Flec-SL and Günter Breithardt Co-PI.
Acknowledgements
ANTIPAF and Flec-SL were conducted by the Competence Network on Atrial Fibrillation (AFNET), funded by the ‘Bundesministerium für Bildung und Forschung’, Berlin, Germany under the grant number 01 GI 0204. Industrial project partners partly contributed to these projects. The AFNET (www.kompetenznetzvorhofflimmern.de) performs various clinical and experimental scientific research projects. About 450 hospitals and office-based physicians as well as scientific institutes all over Germany contribute to the AFNET-activities. The results presented here are not results of the AFNET but only represent data from these institutions. The authors are responsible for the content of this publication.
References
Author notes
Joint first authors.
