


Abstract
A discordant left ventricular (LV) lead position can be responsible for cardiac resynchronization therapy (CRT) non-response. In this study, tailored optimization of the individual LV wall motion was evaluated for the outcome in these patients.
Two hundred and forty-six CRT outpatients were screened for non-response due to a discordant LV lead. In 17 patients, three-dimensional data of fluoroscopic rotation scan and echocardiography were integrated to analyse the individual LV wall motion with respect to the LV lead position. Optimization was guided by the systolic dyssynchrony index (SDI) and LV ejection fraction (LVEF) during different interventricular (VV)-delay programming. If re-programming failed, implantation of a second LV lead was performed. A discordant or partly concordant LV lead position was found in nearly all patients (16/17, 94%), which contributed to an unchanged baseline amount of LV dyssynchrony with either CRT on or off (SDI 11.3 vs. 11.0%; P = 0.744). In the majority of patients, VV-delay re-programming achieved better resynchronization, 4/17 patients needed implantation of a second LV lead. After 3 months, significant improvement of NYHA functional class (1 class; P = 0.004), peak oxygen consumption (10 vs. 13 mL/min/kg; P = 0.008), LVEF (27 vs. 39%; P = 0.003), and SDI (11.0 vs. 5.8; P = 0.02) was observed. Clinical and echocardiographic responses were found in 77 and 59%, respectively, with even good results on long-term follow-up.
Tailored optimization of the individual LV wall motion can lead to significant clinical and echocardiographic improvements in previous CRT non-responders with a discordant LV lead position.
Three-dimensional integration of fluoroscopic rotation scan and real-time three-dimensional echocardiography is feasible and precisely identifies a discordant LV lead position in patients with a previously implanted CRT device.
In CRT non-responders, individually different LV wall motion pattern with mostly widespread or multiple sites of latest mechanical activation (SLMAs) can be found.
Optimization of the individual LV wall motion can mostly be performed non-invasively by VV-delay re-programming.
Implantation of a second LV lead concordant to the SLMA is a safe alternative to achieve favourable resynchronization.
An individually tailored concept for the management of CRT non-responders with a discordant LV lead is able to achieve significant clinical and echocardiographic improvements.
Introduction
Cardiac resynchronization therapy (CRT) revolutionized the treatment of heart failure (HF) and is recommended as a class I therapy option with an A-level of evidence for selected patients.1 Unfortunately, the CRT non-responder rate remains high with 11–46% of patients showing no clinical and/or echocardiographic improvements after implantation.2 The presence of a discordant left ventricular (LV) lead in relation to the site of latest mechanical activation (SLMA) has been shown to be a potential reason for non-response due to insufficient resynchronization of the altered LV wall motion, remaining or even worsening LV dyssynchrony. Moreover, poorer clinical and echocardiographic responses with potential effect on the long-term outcome had been observed.3,4 However, treatment options for these patients are challenging and clinical data are lacking.5 Little is known about the potential of tailored optimization of the individual LV wall motion in these patients. This study therefore investigated the feasibility of LV wall motion analysis to guide the optimization of CRT non-responders with a discordant LV lead position in a three-dimensional (3D) approach.
Methods
Study aims
The present study aimed:
to analyse the individual LV wall motion and SLMA with respect to the previously implanted LV lead position,
to optimize the individual LV wall motion by either re-programming of the interventricular (VV) delay or implantation of a second LV lead to the SLMA,
to evaluate the clinical and echocardiographic outcomes after a short-term follow-up, and
to collect data of morbidity and mortality for long-term follow-up.
In- and exclusion criteria of study patients
Between October 2009 and May 2010, consecutive CRT outpatients were screened for CRT non-response, despite classical indication, sufficient therapy delivery, and the absence of other causes for non-response, which therefore might be due to a discordant LV lead position. Prior to the study procedures all patients provided written and verbal informed consent. Patients were included, if they had received a CRT device according to current guidelines1 for at least 6 months without clinical and echocardiographic improvements or even worsening of heart failure symptoms despite optimal medical therapy and sinus rhythm with effective biventricular stimulation. Patients were excluded, if clinical factors confounded CRT efficiency and potentially contributed to an impaired clinical and echocardiographic response after CRT implantation. A detailed list is given in the Supplementary material online, Table S1.
Investigations at baseline and follow-up
Patients were assessed by clinical, functional, and echocardiographic status, including patients' medical history, basic physical examination, 12-lead electrocardiogram (ECG), peak oxygen consumption (pVO2) on bicycle spiroergometry, CRT device interrogation, two-dimensional (2D) transthoracic echocardiography (TTE), and real-time three-dimensional echocardiography (RT3DE) at baseline and 3 months after optimization. Clinical, echocardiographic, and composite responses were defined as suggested by large CRT trials. A detailed definition is given in the Supplementary material online, Methods 1. Data of morbidities and mortality were analysed annually from periodic visits in the outpatient department. An overview of the study procedures is given in Figure 1.
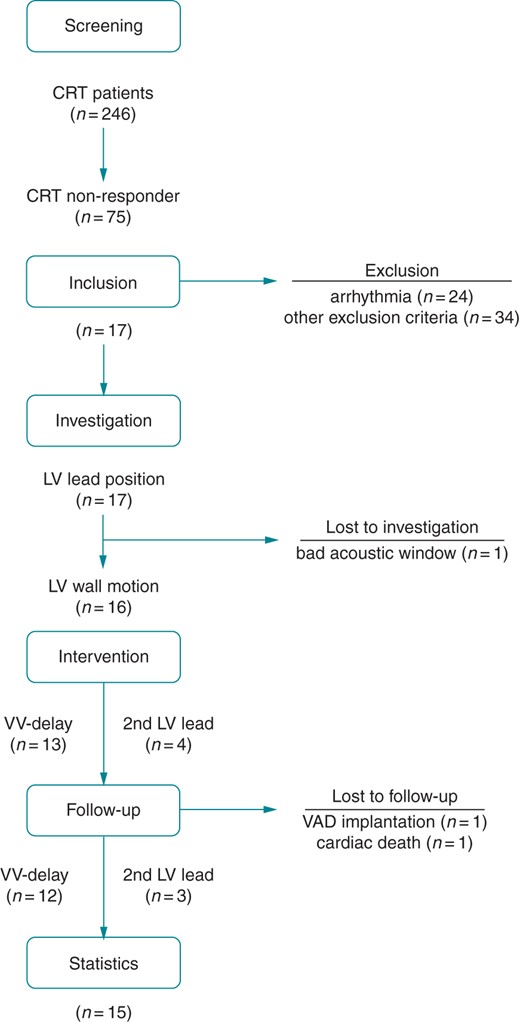
CONSORT statement. Flow chart of the study procedures. CRT, cardiac resynchronization therapy; LV, left ventricular; VV, interventricular; VAD, ventricular assist device.
Assessment of left ventricular lead position and left ventricular wall motion
Both ventricular lead positions were revealed by a fluoroscopic rotation scan in a conventional fluoroscopy scanner (Allura Xper FD10, Philips Healthcare, Best, the Netherlands). A non-gated 110° rotation scan from a right anterior oblique (RAO) 55° to left anterior oblique (LAO) 55° projection was acquired at 30 frames/s over a scanning time of 4 s. The course was tracked and reconstructed in a 3D model (Figure 2A) using dedicated segmentation software (EP-Navigator, Philips Healthcare). For quantitative analysis, the LV lead position was assessed in LAO 55°/RAO 20° and classified in accordance to the 17-segment model of LV segmentation as recommended by the American Heart Association (AHA).6
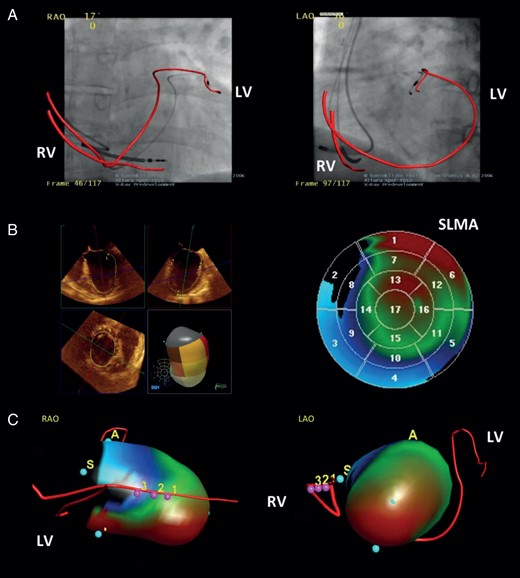
Methods. Three-dimensional (3D) evaluation and integration of the relationship between the LV lead position and the LV wall motion in CRT non-responders. (A) Fluoroscopic rotation scan showing the ventricular lead courses. (B) Real-time three-dimensional echocardiography with analysis of LV wall motion. (C) Integration of both investigations into one single 3D model. LAO, left anterior oblique projection; LV, left ventricular lead; RAO, right anterior oblique projection; RV, right ventricular lead; SLMA, site of latest mechanical activation; pink dots with numbers = integration landmarks of (A) and (B).
The LV wall motion was analysed using RT3DE (iE 33, Philips Healthcare) with a X7-2 transoesophageal matrix array transducer. Electrocardiogram-gated full-volume datasets were acquired over four consecutive cardiac cycles at 18 frames/s. Data were recorded and digitally stored for intrinsic atrioventricular (AV)-nodal conduction (intrinsic), baseline VV-delay programming (baseline), and five additional VV delays (LV/RV only, LV/RV +30 ms, VV ±0 ms). Quantitative analysis of global [LV ejection fraction (LVEF)] and 17-segment regional (LV wall motion, SLMA) LV function was carried out offline using semi-automated endocardial boarder-tracking software (QLab 7.0, 3DQ Advanced, Philips Healthcare), as previously described.7 The systolic dyssynchrony index (SDI), representing the standard deviation of the time to minimal systolic volume (Tmsv) of all segments, was calculated and parametric motion imaging was performed. The results were displayed on a static 2D polar map (Figure 2B) with green, blue, and red colour indicating synchronized, early, and late activation, respectively. The position of the SLMA (red area) was classified using the AHA model of LV segmentation again.6 To support precise data acquisition, both procedures were performed immediately one after another, in a supine position and in an end-expiratory breath-hold.
Integration of left ventricular lead position and left ventricular wall motion
For datasets with intrinsic AV nodal conduction, the ventricular lead course (Figure 2A) was integrated with the LV wall motion (Figure 2B) into one spatial 3D model (Figure 2C) (EP-Navigator, Philips Healthcare). For registration purposes, the course of the RV lead was landmarked in the RT3DE and manually superimposed with its course on the fluoroscopic rotation scan. Out of the integrated 3D model (Figure 2C), the LV lead position was categorized depending on its relationship to the SLMA. It was concordant if precisely matching with the SLMA, partly concordant if matching with parts of the SLMA or one of multiple SLMAs, and discordant if not matching with the SLMA.
Optimization of the left ventricular wall motion
For optimization, the LV wall motion was analysed during baseline (baseline) and five additional VV-delay programming. The VV delay, which provided the most synchronous LV wall motion and best LV function, indicated by the lowest SDI and highest LVEF, was programmed to the CRT device. If reduction of absolute SDI < 10% or relative SDI < 30% to baseline were not achievable, implantation of a second LV lead, concordant to the SLMA, was performed as described previously.8
Statistical analysis
Continuous variables are presented by the median and interquartile range [IQR]. Categorial variables are expressed as frequencies in numbers (n) and percentages (%) of patients. Values at baseline and follow-up were compared using the Wilcoxon test or sign test for paired samples. Exact two-sided statistical significance was considered for a P < 0.05 and was calculated for n = 15 patients between data at baseline and follow-up. The statistical analyses were performed by the SPSS Statistics 17.0 for Windows software, SPSS Inc., Chicago, IL, USA.
Results
Baseline characteristics
Out of 246 screened CRT patients, 75 (30%) presented as non-responders. Of those, 58 (77%) met exclusion criteria with 24 (32%) suffering from arrhythmias. Seventeen (23%) patients were non-responding despite sinus rhythm, highest tolerated doses of optimal medical therapy, sufficient biventricular LV stimulation, and lack of further co-morbidities and therefore were eligible to this study. Detailed baseline characteristics are given in Tables 1 and 2.
Baseline characteristics (n = 17)
| Clinical data | ||
| Age (years) | 68 | [60–71] |
| Gender (male) | 11 | (65) |
| Diagnosis DCM (others ICM) | 15 | (88) |
| Co-morbidities | ||
| BMI (kg/m2) | 31 | [28–35] |
| Arterial hypertension | 14 | (82) |
| Diabetes mellitus type 2 | 7 | (41) |
| Previous ICD therapy | 5 | (29) |
| Medication | ||
| Beta blocker | 16 | (94) |
| ACE inhibitor | 8 | (47) |
| AT receptor blocker | 8 | (47) |
| Diuretics | 17 | (100) |
| Aldosterone antagonist | 14 | (82) |
| Cardiac data | ||
| Sinus rhythm | 17 | (100) |
| Heart rate (b.p.m.) | 74 | [64–81] |
| Intrinsic QRS width (ms) | 140 | [120–150] |
| LBBB | 16 | (94) |
| CRT device data | ||
| Type of device (ICD) | 17 | (100) |
| Stimulation rate (%) | 99 | [98–100] |
| VV-delay programming (LV > RV) | 20 | [0–40] |
Continuous data are given as median [interquartile range]. Categorial data are given as number (percentage) of patients.
ACE, angiotensin converting enzyme; AT, angiotensinogen; BMI, body mass index; CRT, cardiac resynchronization therapy; LV, left ventricular; DCM, dilative cardiomyopathy; ICD, intra-cardiac defibrillator; ICM, ischaemic cardiomyopathy; LBBB, left bundle branch block; RV, right ventricular; VV, interventricular.
Clinical and echocardiographic outcomes
| Baseline (n = 17) | Short-term follow-up (n = 15) | P-value | |||
|---|---|---|---|---|---|
| Clinical data | |||||
| NYHA class II | 3 | (17) | 10 | (67) | 0.004 |
| NYHA class III | 11 | (66) | 5 | (33) | |
| NYHA class IV | 3 | (17) | 0 | (0) | |
| Stimulated QRS width (ms) | 130 | [120–140] | 140 | [120–150] | 0.152 |
| pVO2 (mL/min/kg) | 10 | [8–12] | 13 | [10–15] | 0.008 |
| 2D echocardiographic data | |||||
| LVEF (%) | 31 | [23–38] | 37 | [25–41] | 0.416 |
| LVEDD (mm) | 69 | [60–76] | 64 | [57–69] | 0.221 |
| LVESD (mm) | 57 | [47–68] | 54 | [46–56] | 0.274 |
| LVEDV (mL) | 194 | [114–251] | 164 | [132–212] | 0.202 |
| LVESV (mL) | 124 | [77–178] | 106 | [91–164] | 0.132 |
| 3D echocardiographic data | |||||
| LVEF (%) | 27 | [21–32] | 39 | [32–46] | 0.003 |
| SDI with CRT on (%) | 11.3 | [7.8–14.2] | 5.8 | [3.7–7.9] | 0.01 |
| Segments affected by the SLMA (n) | 4 | [3–7] | 2 | [1–3] | 0.06 |
| LV surface affected by the SLMA (%) | 24 | [18–38] | 12 | [6–18] | 0.09 |
Continuous data are given as median [interquartile range]. Categorial data are given as number (percentage) of patients.
CRT, cardiac resynchronization therapy; LV, left ventricular; LVEDD, left ventricular end-diastolic diameter; LVEDV, left ventricular end-diastolic volume; LVEF, left ventricular ejection fraction; LVESD, left ventricular end-systolic diameter; LVESV, left ventricular end-systolic volume; NYHA, New York Heart Association; pVO2, peak oxygen consumption; QRS, complex of ventricular activation on surface ECG; SDI, systolic dyssynchrony index; SLMA, site of latest mechanical activation.
Analysis of left ventricular lead position and left ventricular wall motion
Assessment of the LV lead position was available in all patients. The total median fluoroscopy time measured 45 s [IQR 38–63] with a fluoroscopy dosage of 975 µGy m2 [IQR 723–1148]. Assessment of the LV wall motion was available in 16/17 (94%) patients. In one patient, a poor acoustic window during RT3DE precluded the analysis of reliable LV wall motion data. In this patient, the VV delay was optimized using 2D-TTE. The median procedure time for RT3DE analysis and integration measured 180 min [IQR 135–210]. The integration of both investigations was successfully performed in all patients with available LV wall motion data. There were no complications.
Left ventricular lead position
The majority of patients presented with a classical lateral or inferolateral LV lead position (14/17, 82%). A basal, mid-ventricular, and apical LV lead position were found in 6/17 (35%), 10/17 (57%), and 1/17 (6%) patients, respectively. In 2/17 (12%) patients, the LV lead was implanted epimyocardial.
Left ventricular wall motion
Individually different LV wall motion patterns were found (Supplementary material online, Figure S1). The majority of patients presented with one single SLMA (14/16, 88%). Two patients had multiple SLMAs. The most affected segments were variably distributed from the mid-ventricular septum, over the anterior wall to inferolateral parts of the LV. In general, the SLMA was widespread, affecting a median of four segments [IQR 3–7] and 24% [IQR 18–42] of the LV surface. The SLMA was septal or inferior in 6/16 (38%) patients each, anterior or lateral in 10/16 (63%) each and basal, mid-ventricular or apical in 7/16 (44%), 14/16 (88%), and 6/16 (38%) patients. Interestingly, the SDI for stimulation under baseline VV-delay programming did not differ significantly from the SDI under intrinsic AV-nodal conduction (11.3% [IQR 7.8–14.2] vs. 11.0% [IQR 6.9–14.8]; P = 0.744). Detailed information on the distribution of the LV lead position and the SLMA are given in Figure 3.
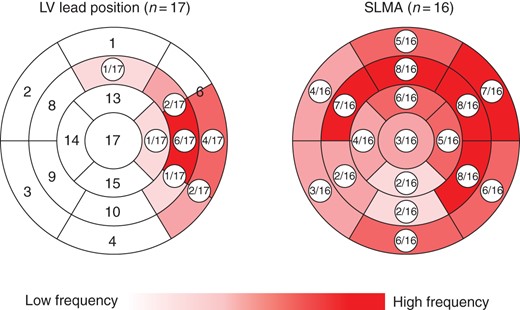
Distribution of the LV lead position and SLMA over all patients. Re-production of the 17-segment model of the LV, showing a classically implanted LV lead position and a widespread SLMA, mostly affecting anteroseptal to anterolateral and inferolateral parts of the LV. LV, left ventricular; SLMA, site of latest mechanical activation.
Relation of left ventricular lead position and site of latest mechanical activation
Almost all patients showed a discordant (7/16, 44%) or only partly concordant (8/16, 56%) LV lead position. If partly concordant, the LV lead was either lying at the edge of the SLMA (n = 6) or concordant with only one of multiple SLMAs (n = 2) being insufficient to resynchronize the entire SLMA area. A concordant LV lead position was found in only one patient, who experienced further improvement of LV dyssynchrony by VV-delay re-programming.
Optimization of the individual left ventricular wall motion
In 13/17 (76%) patients, the LV wall motion could be optimized by VV-delay re-programming (Figure 4A). Changes in the VV-delay programming to either more RV or LV pre-activation were highly variable, individually different, and unpredictable (see Supplementary material online, Figure S3). Re-programming to biventricular simultaneous stimulation showed the best results in only two patients. In 4/17 (24%) patients, VV-delay re-programming failed (Figure 4B) and implantation of a second LV lead (3× SJM Quickflex µ, 1× Biotronik Corox OTW-L BP), concordant to the SLMA, was performed (Figure 5). The total median implantation time measured 168 min [IQR 135–205] with a fluoroscopic time of 28 min [IQR 16–45] and a dosage of 9050 µGy m2 [IQR 3876–16 799]. In 2/4 patients, occlusion of the subclavian vein was found and LV lead delivery had to be performed from a contralateral subclavian access with subcutaneous lead tunnelling. In all four patients, the second LV lead could be successfully implanted concordant to the SLMA. There was one post-interventional CRT pocket haematoma, which was regressive under conservative therapy. No phrenic nerve stimulation was observed. Due to the usage of a Y-connector (Medtronic) the threshold levels of the LV leads increased to a median of 1.5 V/1.5 ms [IQR 0.5–1.5/1.2–2.0].
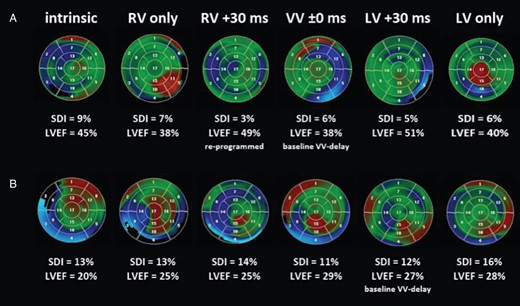
Re-programming of the VV delay. Analysis of LV wall motion, LV dyssynchrony (SDI), and LVEF for different VV-delay re-programming displayed on the 17-segment model of the LV in a colour-coded fashion with blue, red, and green indicating early, late, and synchronized activation, respectively. (A) Patient (No. 5) showing improved LV wall motion, SDI, and LVEF under a VV-delay re-programming to RV +30 ms. (B) Patient (No. 13) showing no improvement with remaining high SDI and poor LVEF. Intrinsic = intrinsic AV-nodal conduction; LV/RV only = univentricular left/right stimulation; VV ±0 ms = biventricular simultaneous stimulation; LV/RV +30 ms = biventricular stimulation with left/right ventricular pre-activation of 30 ms. LV, left ventricular; LVEF, left ventricular ejection fraction; SDI, systolic dyssynchrony index; VV, interventricular.
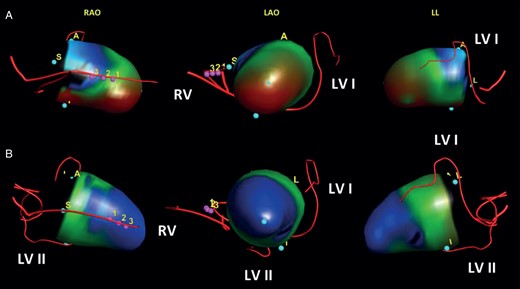
Implantation of a second LV lead. Integrated 3D models of the left ventricle, showing LV wall motion before and after implantation of a second LV lead. (A) Patient (No. 13) presenting with a discordant LV lead at a mid-ventricular lateral position and SLMA on the entire inferior LV wall during intrinsic atrioventricular-nodal conduction (SDI, 13%). (B) Same patient (No. 13) after implantation of a second LV lead to the inferior SLMA showing resynchronized LV wall motion and improved LV dyssynchrony (SDI, 5%). LAO, left anterior oblique projection; LL, left lateral projection; LV, left ventricular; LV I, previously implanted first LV lead; LV II, newly implanted second LV lead; RAO, right anterior oblique projection; RV, right ventricular lead; SDI, systolic dyssynchrony index; SLMA, site of latest mechanical activation; pink dots with numbers = integration landmarks.
In an attempt to simplify CRT optimization, concordance between narrowest QRS width and lowest SDI was evaluated (see Supplementary material online, Table S2). In 7/17 (41%) patients, no concordance was found. Another six patients, showed partly concordance. However, the narrowest QRS width would also have been achieved during other VV-delay programming but with unfavourable higher values of the SDI. These data therefore do not support CRT optimization solely by QRS width as a marker of LV dyssynchrony.
Follow-up, outcome, and response
Short-term follow-up was available in 15/17 (88%) patients (Table 2). One patient was lost to follow-up due to the implantation of a left ventricular assist device (LVAD). One patient died of a cardiac reason. Patients lost to short-term follow-up (n = 2) were considered as ‘non-responder’ to the outcome analysis. In comparison to baseline, optimization of the individual LV wall motion revealed significant acute improvement of LVEF (27% [IQR 21–32] vs. 37% [IQR 29–45]; P < 0.001), SDI (11.3% [IQR 7.8–14.2] vs. 5.5% [IQR 2.4–9.2]; P = 0.008), and segments affected by the SLMA (4 [IQR 3–7] vs. 2 [IQR 1–3]; P = 0.02) (see Supplementary material online, Figure S2, baseline vs. optimized). After 3 months, significant clinical improvement of NYHA functional class (1 class; P = 0.004) and pVO2 (10 mL/min/kg [IQR 8–12] vs. 13 mL/min/kg [IQR 10–15]; P = 0.008) was observed (Table 2). On RT3DE, the acutely observed changes in LVEF, SDI, and number of segments affected by the SLMA remained significantly improved (Table 2 and Supplementary material online, Figure S2, optimized vs. follow-up). Clinical, echocardiographic, and composite responses after optimization were achieved in 13/17 (77%), 10/17 (59%), and 9/17 (53%) patients.
Long-term follow-up was available in 15/17 patients with a median follow-up period of 45 months (range 5–51 months). By January 2014, 13/15 (86%) patients were alive, another two patients died due to cardiac reasons (incessant VT, AMI), 5 and 32 months after VV-delay re-programming. One patient received a heart transplant and was no longer suffering from HF symptoms. Median LVEF remained stable at 38% [IQR 28–41; P = 0.721]. In four patients, the VV delay was re-programmed by LV wall motion analysis again. Seven patients developed heart rhythm disorders, of which five were of ventricular origin and could be ablated in one patient due to an epimyocardial origin. Of note, there was no correlation between the development of heart rhythm disorders and the LV lead position, especially not in patients who received a second LV lead. Overall, 36 hospitalizations could be evaluated, with 2 hospitalizations per person at median and one quarter of patients experiencing 4 or 5 hospitalizations. The time to first hospitalization for any reason and for decompensation of HF measured 14.5 months [IQR 5.5–22.5] and 17.5 months [IQR 11–30], respectively. More information on long-term follow-up are given in Table 3.
Long-term follow-up data (n = 15)
| Clinical and echocardiographic data | ||
| Alive | 13 | (87) |
| NYHA class II | 6 | (40) |
| NYHA class III | 6 | (40) |
| HTX (no NYHA class) | 1 | (7) |
| LVEF (%) | 38 | [28–41] |
| Cardiac data | ||
| Sinus rhythm | 4 | (30) |
| Heart rhythm disorders | 7 | (54) |
| Atrial (AF, AFl) | 6 | (46) |
| Ventricular (VES, VT) | 5 | (38) |
| Atrial & ventricular | 4 | (31) |
| Cause of hospitalization | ||
| HF decompensation | 11 | (31) |
| CRT battery exchange | 10 | (28) |
| Other cardiaca | 10 | (28) |
| Non-cardiacb | 5 | (14) |
Continuous data are given as median [interquartile range]. Categorial data are given as number (percentage) of patients.
AF, atrial fibrillation, AFl, atrial flutter; VES, ventricular extrasystole; AMI, acute myocardial infarction; ASD, atrial septum disclosure; CRT, cardiac resynchronization therapy; HF, heart failure; HTX, heart transplantation; LVAD, left ventricular assist device; LVEF, left ventricular ejection fraction; NYHA, New York Heart Association; VES, ventricular extrasystole; VT, ventricular tachycardia.
aLVAD, AMI, HTX, ASD, AF/VT/VES ablation, and amiodarone upload.
bAcute renal failure, pneumonia, partly renal resection, and hyperkalaemia.
Discussion
Study population
Screening a large cohort of classical CRT patients (246), a non-responder rate (30%) comparable with existing data could be found.2 Arrhythmia and other clinical factors confounding CRT response (Figure 1), occurred as frequent as reported by a large CRT outpatient clinic.10 To extract non-responders with a potential discordant LV lead, restrictive in- and exclusion criteria were defined. A smaller but clearly defined and scientific conclusive patient population with optimal indications, empirically good LV lead positions and sufficient therapy execution according to current CRT standards was accepted and actually found, with only one patient showing a concordant LV lead position.
Surprisingly, classically implanted LV leads were in striking contrast to mostly widespread SLMAs over the entire LV wall (Figure 3). Thus, a discordant LV lead position was responsible for the lack of response in nearly every fifth non-responder (15/75 patients) impairing LV systolic function and LV dyssynchrony (see Supplementary material online, Figure S2, intrinsic vs. baseline).
Study methods
Fluoroscopic rotation scan and RT3DE are established methods to precisely quantify the LV lead position and LV wall motion in a 3D fashion, respectively.11,12 To ensure high quality image acquisition, the more invasive transoesophageal echocardiography (TEE) was used. For appropriate 3D integration, it was necessary that the patient was lying in a supine position. In this position, a satisfying echocardiographic examination using a transthoracic approach would not have been possible. Using RT3D-TEE, precise detection of the SLMA and integration with the LV lead position was possible in all patients, except one patient. This good reliability supported the decision-making process, choosing between an invasive or non-invasive approach for optimization. On follow-up, the use of TTE was sufficient and has been used as the less invasive and more comfortable alternative to re-evaluate treatment success. The absence of complications during data acquisition underlines its safety.
Re-programming of the interventricular delay
Optimization of the VV delay guided by echocardiography is a widely accepted and mostly preferred concept for the management of CRT non-responders. However, contradictory clinical outcome data have been reported, which are related to the plethora of methods and the variable attempts to compare them against each other.9 Because reduction of LV dyssynchrony is the major rational of CRT, the SDI and the LVEF were chosen to guide treatment decisions in this study. This choice is supported by excellent intraclass correlation coefficients (ICCs) of inter- and intra-observer variability for SDI (ICC = 0.92 and 0.95) and LVEF (ICC = 0.88 and 0.97), showing the SDI to be a reliable parameter for the accurate assessment of LV dyssynchrony even predicting clinical CRT response.12,13
Overall, individual VV-delay re-programming was able to diminish the deleterious effects of a discordant LV lead in the majority of patients, showing significant clinical and echocardiographic improvements with good response rates in a substantial proportion of previous non-responders. This is in concordance with findings from literature, although mostly guided by different echocardiographic parameters of LV dyssynchrony.14
These findings, together with the unpredictable set-up of VV-delay re-programming (see Supplementary material online, Figure S3), support an individualized concept for the management of CRT non-responders.
Implantation of a second left ventricular lead
Implantation of a second LV lead and its benefits on outcome have been previously reported by several investigators but were mainly studied in de novo CRT implantation, exclusively.15–17 In 4/17 patients, a large mismatch between the LV lead position and SLMA restricted the optimization potential by VV-delay reprogramming. Considering implantation of a second LV lead for optimization in these cases, favourable resynchronization was found (Figure 5). Due to the small sample size, overall statements cannot be made but an ongoing prospective randomized multicentre trial (V3-Trial) will report about its efficiency in CRT non-responders although targeting the most anatomically achievable spatial separation of both LV leads rather than the SLMA.18
Study limitations
This is a prospective single-centre feasibility study. It is limited by its sample size, uncontrolled design, and the investigation of a specific cohort of non-responders, which may cause selection bias. The investigation contained an unpleasant acquisition procedure, the exposition to radiation and a time-consuming LV wall motion analysis. The temporal resolution and the acoustic window of RT3DE might exclude potential candidates as it has been seen in one patient with a highly enlarged LV (Figure 1). Like experienced by previous investigators,19 implantation of a second LV lead was time-consuming, associated with a higher radiation exposure, unfavourable electrical lead characteristics, and the need of additional techniques for lead delivery. Hence, implantation of a second LV lead should only be considered in highly symptomatic non-responders resistive to conventional optimization and performed in specialized catheter laboratories. Nevertheless, the usage of advanced imaging and image integration technology contributed to a better understanding of dyssynchrony pattern in CRT non-responders and their optimization potential by an individualized concept.
Study implications
This study could show that de novo CRT response can be achieved in a substantial proportion of previous non-responders despite a discordant LV lead position. Because of its mainly non-invasive character, LV wall motion analysis by RT3DE can be easily implemented in clinical practice. Especially in patients with a previously implanted cardiac device, this method is interesting because of exclusion from evaluation by myocardial resonance imaging. Significant reduction of LV dyssynchrony together with clinical and echocardiographic responses showed good results even on long-term follow-up, as previously mentioned by Khan et al.4 and Capasso et al.20
Future prospects
Analysis of the SLMA prior to CRT with concordant LV lead implantation could prevent of non-response. First data could show an encouraging responder rate of 80–90% after 6 months21 with lowered morbidity and mortality.4 For widespread or multiple SLMAs, primary quadripolar or multiple LV lead implantation could be considered to resynchronize the individual LV wall motion pattern but was under clinical evaluation during this study.8 All aspects are addressed to further research in a larger cohort of CRT non-responders.
Conclusion
If other reasons can be excluded, a discordant LV lead position is a frequent finding in CRT non-responders. A tailored optimization of the individual LV wall motion by either VV-delay re-programming or implantation of a second LV lead is feasible, safe, and can diminish the effects of a discordant LV lead position. Significant clinical and echocardiographic improvements with de novo response can be achieved with even good results on long term.
Supplementary material
Supplementary material is available at Europace online.
Funding
The study was not supported by any research grant or industry sponsor.
Conflict of interest: G.H. has received modest lecture honoraria and congress sponsoring from St Jude Medical, Biotronik, Medtronic, and Biosense Webster, and is a member of the St Jude Medical and Biosense advisory board. C.P. has received modest lecture honoraria and congress sponsoring from St Jude Medical and Biotronik, and is a member of the St Jude Medical advisory board. M.D. has received modest lecture honoraria from St Jude Medical and Biotronik. S.R. and T.G. have received modest lecture honoraria and congress sponsoring from St Jude Medical, Biotronik, and Biosense Webster.
Acknowledgements
We thank Roland Bullens and the staff of the electrophysiological department for providing expert technical support and patient care.
References
Author notes
Present address. Department of Electrophysiology, University of Leipzig – Heart Center, Strümpellstraße 39, 04289 Leipzig, Germany.
Present address. Kardiologische Gemeinschaftspraxis Saalekreis Schillerplatz 12, 06198 Salzatal, Germany.
Present address. Department of Electrophysiology, University of Dresden – Heart Center, Fetscherstraße 76, 01307 Dresden, Germany.
