


To present a comparison of electrocardiogram-based non-invasive measures of atrial fibrillation (AF) substrate complexity computed on invasive animal recordings to discriminate between short-term and long-term AF. The final objective is the selection of an optimal sub-set of measures for AF complexity assessment.
High-density epicardial direct contact mapping recordings (234 leads) were acquired from the right and the left atria of 17 goats in which AF was induced for 3 weeks (short-term AF group, N = 10) and 6 months (long-term AF group, N = 7). Several non-invasive measures of AF organization proposed in the literature in the last decade were investigated to assess their power in discriminating between the short-term and long-term group. The best performing measures were identified, which when combined attained a correct classification rate of 100%. Their ability to predict standard invasive AF complexity measures was also tested, showing an average R2 of 0.73 ± 0.04.
An optimal set of measures of the AF substrate complexity was identified out of the set of non-invasive measures analysed in this study. These measures may contribute to improve patient-tailored diagnosis and therapy of sustained AF.
Systematic comparison of several electrocardiogram (ECG)-based non-invasive measures of atrial fibrillation (AF) organization proposed in the literature in the last decade.
Comparison performed on invasive epicardial recordings from two groups of goats, a short-term AF and a long-term AF group, to attest the ability of the analysed measures in discriminating between different AF substrate complexities.
Selection of an optimal sub-set of measures of the AF substrate complexity out of the set of non-invasive measures analysed in this study.
The results of this study represent a step forward towards standardization of AF electrogram analysis, needed to adequately address the clinical relevance of ECG-based AF substrate classification.
Introduction
Atrial fibrillation (AF) is known to be associated with an increased risk of mortality.1 Despite some progress, the current therapy of AF is still far from being satisfactory.2,3 This is in part related to the progressive nature of the disease and imprecise classification. Standard classification of AF (as paroxysmal, persistent, and permanent) is mainly based on AF (episode) duration,1 which may not fully include the variability of the electrostructural changes that the AF substrate undergoes over time.3 This remodelling leads to increased stability of the AF substrate4 (in terms of incidence of conduction block and the number of co-existing fibrillation waves), which reduces the success rate of any rhythm control therapy in AF.1,5 Finding suitable measures that are able to estimate the complexity of the AF substrate non-invasively from conventional recording techniques [e.g. the standard 12-lead electrocardiogram (ECG)], and that cover the continuous spectrum of changes in AF complexity, could provide an improved and more integrated diagnosis of AF and help individualize therapy before intervention.3
Several measures have been proposed in the literature over the last decade for assessment of the degree of AF complexity or to predict therapeutic outcome through the quantification of AF organization.5–9 The studies differ in type of acquisition system, type of data pre-processing, domain of analysis (time-based vs. frequency-based), and use of temporal and/or spatial information.2 However, no studies have rigorously compared their performance and determined which measures are most appropriate to assess the complexity of the AF substrate. There is a need for validation and standardization of AF substrate assessment to be able to adequately address the clinical relevance of ECG-based AF substrate classification.2 For an objective comparison, we used a set of recordings directly acquired at the atrial surface without being filtered by the different tissues during their electrotonic projection towards the body surface. In this study, we compared the performance of different non-invasive measures of AF substrate complexity on invasive epicardial goat data from two different groups, a short-term (ST) AF group (comparable with acute AF), and a long-term (LT) AF group (comparable with chronic AF).10 From this analysis, a sub-set of optimal non-invasive measures was identified and compared with standard invasive measures of AF organization [such as wave size (WS), number of waves (NW), etc.] to investigate their predictive power against invasive measures.
Methods
Model and epicardial electrogram measurements
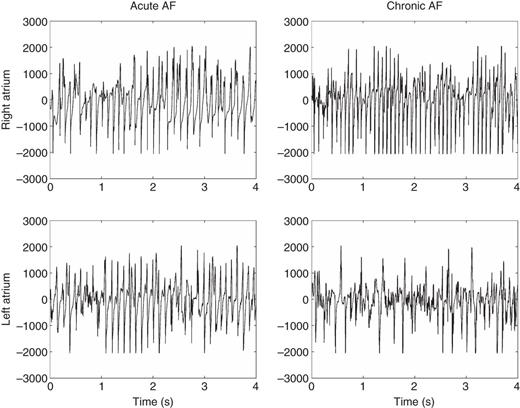
Left column: 4 s excerpts of raw epicardial electrogram signals from the right (top) and the left (bottom) atrium of an acute AF goat (from the ST group). Right column: 4 s excerpts of epicardial electrogram signals from the right (top) and the left (bottom) atrium of a chronic AF goat (from the LT group).
Non-invasive measures of atrial fibrillation substrate complexity
Complexity measures evaluated were identified from a literature review.2,12 Among these 15 studies, those that were considered well representative of the whole spectrum were included for evaluation. Measures were computed with the same algorithm used in the original study if supplied by the authors. Below, a brief description of each measure used in this study is provided. Interested readers are referred to the original articles for more details about each technique.
Spatial complexity k0.95:8 spatial complexity is quantified as the average number of significant principal components needed to represent 95% of the variance of the signal over non-overlapping sliding time windows (1 s long in this study). A more organized conduction pattern is reflected in a lower number of principal components needed to describe its variance.
Spatiotemporal stationarity NMSE3:8,9 the temporal persistence of an atrial propagation pattern is quantified as the stationarity and repeatability of its first three principal components over non-overlapping sliding time windows (1 s long). A more organized AF is supposed to be associated with more stable atrial propagation patterns. Lower values of NMSE3 are associated with more stable AF.
Spatial complexity C and variability of spatial complexity CV:7 differently from k0.95, Di Marco et al. characterized spatial complexity C as the percentage of residual variance after the contribution of the first three principal components is removed. CV represents the standard deviation of the spatial complexity index C over time. Lower values of C and CV are associated with more organized AF.
Spectral concentration SC and spectral variability SV:7 SC is a measure of the focus of the spectral power within a narrow band around the dominant AF frequency.13 SV represents the temporal variability of the spectral distribution of the principal component with the highest SC. Considering the case of AF with highly stable re-entrant circuit, SC will be high and SV low. Conversely, in case of AF with meandering or multiple changing re-entrant circuits, SC would be comparatively low, while SV would be high.
Multivariate organization index MOI:5 computed as follows. The areas under the five largest peaks of the spectral envelope are calculated using a 1 Hz frequency interval centred on each peak. MOI is then calculated as the ratio of these areas to the total spectrum. The global organization of AF is assessed in the presence of multiple competing oscillations. A grid search was performed to find the optimal sub-set of leads (out of the original 234) to maximize MOI. The more organized AF is, the higher the value of MOI will be.
Multivariate spectral entropy MSE:5 estimated from the Shannon's entropy of the spectral envelope. It can be considered a measure of sparseness of a spectrum. The more organized AF is, the lower the value of MSE will be.
Sample entropy SAE:6 Sample entropy examines a signal for similar epochs and assigns a non-negative value to the signal, such that larger values correspond to more irregularity. The more organized AF is, the lower the value of SAE will be.
Power of AF waves fWP:6 calculated as the power of the atrial activity signal. The more organized AF is, the higher the value of fWP will be.
Dominant atrial frequency DAF:6,14 dominant AF frequency estimated in the range 3–12 Hz. Based on the literature,14 the more organized AF is, the lower the value of DAF is expected to be.
Alcaraz and Rieta15 proposed to characterize AF also by means of the main atrial wave (MAW), obtained by filtering the signal with a very narrow-band filter centred around the dominant AF frequency. Indices SAE and fWP have also been calculated from the MAW (indicated as SAEM and fWPM).
Relative harmonic energy RHE:6 calculated as the relative sub-band energy of the first and second harmonics of the dominant AF frequency.
Classification procedure and statistical analysis
The analysis was divided in three parts: first, a classification based on a univariate logistic regression model was performed on each feature independently, to investigate its predictive power in discriminating between ST and LT. Secondly, given the 14 available non-invasive features and all their possible combinations (214−1 = 16 383, leaving out the empty set), a multivariable logistic regression model was estimated on all possible model configurations. For each model, classification score was estimated in terms of percentage of concordance. Two subjects, belonging to Groups 1 and 2, respectively, are said to be concordant if the first subject has a higher probability of belonging to Group 1 than the second subject (and vice versa). Percentage of concordance measures this concordance for all pairs of subjects given as input to a linear regression model. The classification score of each parameter was assessed by the average of the percentage of concordance values from all linear regression models in which that parameter has been included. Thirdly, the predictive value of the optimal sub-set of features selected was investigated while accounting for the following standard invasive measures of AF organization: NW, AF cycle length (AFCL), number of breakthrough (NBT), WS, and wave velocity (WV).4,10 Selection of the optimal invasive features was performed in the same way as described above for the non-invasive features, by analysing all their possible configurations (25−1 = 31). Residual predictive powers and correlations were computed to assess whether non-invasive measures can be considered good approximations for invasive measures. Parameters are presented as mean ± SD. Differences are analysed by means of Student's t-test. The results are considered significant if P < 0.05.
Results
Comparison of non-invasive measures of atrial fibrillation substrate complexity and selection of the optimal sub-set
Classification results for all individual AF complexity measures from a logistic regression model, evaluated at the LA
| AF complexity measure | Correct classification rate (%) | Percentage of concordance (%) | Acute AF (ST) predictive value (%) | Chronic AF (LT) predictive value (%) | P-value |
|---|---|---|---|---|---|
| k0.95* | 88.2 | 95.7 | 90.0 | 85.7 | 0.0372 |
| NMSE3* | 88.2 | 95.7 | 90.0 | 85.7 | 0.0223 |
| C* | 94.1 | 95.7 | 100.0 | 85.7 | 0.0431 |
| CV | 64.7 | 57.1 | 90.0 | 28.6 | 0.433 |
| SC | 52.9 | 58.6 | 80.0 | 14.3 | 0.5703 |
| SV | 58.8 | 51.4 | 100.0 | 0.0 | 0.8826 |
| MOI* | 76.5 | 80.0 | 80.0 | 71.4 | 0.0408 |
| MSE* | 82.4 | 90.0 | 80.0 | 85.7 | 0.0335 |
| DAF | 64.7 | 77.1 | 80.0 | 42.9 | 0.0971 |
| SAE* | 76.5 | 88.6 | 80.0 | 71.4 | 0.0312 |
| fWP | 76.5 | 72.9 | 90.0 | 57.1 | 0.1101 |
| SAEM | 64.7 | 78.6 | 80.0 | 42.9 | 0.0755 |
| fWPM | 88.2 | 94.3 | 90.0 | 85.7 | 0.0505 |
| RHE* | 76.5 | 85.7 | 80 | 71.4 | 0.0464 |
Significant discriminants of the ST AF and LT AF groups are indicated with *(P < 0.05).
AF, atrial fibrillation.
Ranking of best performing feature obtained by iterating all possible model configurations obtained from the 14 non-invasive parameters
| Ranking (1 = highest, 14 = lowest) | AF complexity measure | Average percentage of concordance (%) |
|---|---|---|
| 1 | fWPM | 99.97 |
| 2 | C | 99.95 |
| 3 | k0.95 | 99.95 |
| 4 | NMSE3 | 99.89 |
| 5 | MSE | 99.84 |
| 6 | fWP | 99.84 |
| 7 | SAE | 99.82 |
| 8 | MOI | 99.76 |
| 9 | SV | 99.74 |
| 10 | CV | 99.71 |
| 11 | SC | 99.70 |
| 12 | SAEM | 99.70 |
| 13 | RHE | 99.70 |
| 14 | DAF | 99.70 |
The average percentage of concordance was obtained by averaging the percentage of concordance values from all individual models that contained each feature.

Receiver operating characteristic curves for the different non-invasive measures of AF substrate complexity used in this study. (A) ROC curves of the selected parameters; (B) ROC curves of the neglected parameters. Dotted line indicates the line of identity.
Comparison with standard invasive measures of atrial fibrillation organization
Table 3 shows classification performances for all individual standard invasive measures. Three measures appear to be significant discriminator of AF substrate complexity, namely: WS, NW, and NBT. This result was confirmed by analysing all possible model configurations for the invasive parameters only. This analysis ranked WS, NW, and NBT as the best performing parameters.
Classification results for all standard features considered individually as input to a linear regression model
| Invasive measures of AF organization | Correct classification rate (%) | Percentage of concordance (%) | Acute AF (ST) predictive value (%) | Chronic AF (LT) predictive value (%) | P-value |
|---|---|---|---|---|---|
| NW* | 88.2 | 85.7 | 90 | 85.7 | 0.0261 |
| AFCL | 70.6 | 71.4 | 80 | 57.1 | 0.1223 |
| NBT* | 82.4 | 84.3 | 90 | 71.43 | 0.0350 |
| WS* | 88.2 | 98.6 | 90 | 85.71 | 0.0046 |
| WV | 76.5 | 77.1 | 70 | 85.71 | 0.1492 |
Significant discriminants of the ST and LT groups are indicated with *(P < 0.05).
Residual predictive power of non-invasive measures
The optimal non-invasive and invasive sub-sets were considered together as input to a multivariable regression model that was estimated for all possible model configurations (29–1 = 511). The results are reported in Table 4.
Ranking obtained by iterating all possible model configurations obtained from the joint optimal non-invasive and invasive sub-sets
| Ranking (1 = highest, 9 = lowest) | Parameter | Average percentage of concordance (%) |
|---|---|---|
| 1 | WS | 99.84 |
| 2 | fWPM | 99.79 |
| 3 | MSE | 99.59 |
| 4 | C | 99.55 |
| 5 | k0.95 | 99.45 |
| 6 | NMSE3 | 99.42 |
| 7 | SAE | 99.40 |
| 8 | NBT | 99.36 |
| 9 | NW | 99.33 |
| Ranking (1 = highest, 9 = lowest) | Parameter | Average percentage of concordance (%) |
|---|---|---|
| 1 | WS | 99.84 |
| 2 | fWPM | 99.79 |
| 3 | MSE | 99.59 |
| 4 | C | 99.55 |
| 5 | k0.95 | 99.45 |
| 6 | NMSE3 | 99.42 |
| 7 | SAE | 99.40 |
| 8 | NBT | 99.36 |
| 9 | NW | 99.33 |
The corresponding performance (as percentage of concordance) is shown.
Correlation between non-invasive and invasive measures
The results are reported in Table 5 in terms of coefficients of determination R2 (R-squared, together with P-values of corresponding correlations). All selected non-invasive measures but fWPM, showed high coefficients of determination R2 with the three selected invasive measures (0.73 ± 0.04), suggesting good prediction of the invasive measures from the non-invasive ones. When the optimal non-invasive and invasive sub-sets are used together as input to a multivariable regression model, a perfect classification is attained.
Coefficients of determination R2 (and significance of the corresponding correlation) between the optimal non-invasive and the optimal invasive measures
| Features | WS | NW | NBT |
|---|---|---|---|
| k0.95 | 0.90 (P < 0.001) | 0.70 (P < 10−4) | 0.65 (P < 10−4) |
| NMSE3 | 0.62 (P < 10−4) | 0.85 (P < 10−4) | 0.74 (P < 10−4) |
| C | 0.66 (P < 0.001) | 0.88 (P < 10−4) | 0.82 (P < 10−4) |
| MSE | 0.60 (P < 0.001) | 0.73 (P < 10−4) | 0.81 (P < 10−4) |
| SAE | 0.66 (P < 10−4) | 0.72 (P < 10−4) | 0.63 (P < 10−4) |
| fWPM | 0.86 (P < 10−4) | 0.36 (P < 0.05) | 0.33 (P < 0.05) |
Left and right atrium differences
For the LT group, AFCL in the LA was not significantly different from RA (116.32 ± 18.02 vs. 106.62 ± 22.03 ms, P = 0.1508). Similar results were observed for the ST group (139.37 ± 30.28 vs. 140.09 ± 36.48 ms, P = 0.9192). No difference was found in the LA AFCL between the LT and ST groups (P = 0.0930). There was a significant difference in the RA AFCL between the LT and ST groups (P = 0.0478). Performance at the LA was higher than both at the RA and when combining the two atria (results not shown). For this reason, we decided to focus our analysis on the LA only.
Discussion
This study was motivated by the need for testing the ability of several non-invasive ECG-based measures of AF organization in properly quantifying the degree of complexity of the AF substrate at different stages of AF development, independently of standard clinical classifications (e.g. paroxysmal, persistent, and permanent). This was done by testing the performance of the selected measures on epicardial unipolar electrograms from two groups of goats to assess their power to discriminate between the ST acute AF and LT chronic AF when applied to invasive recordings. The final objective was to select an optimal sub-set of non-invasive measures out of the ones included in this study, such as to construct a model that predicts the degree of AF organization. In this respect, automatic variable selection methods (as stepwise or cross-validation) are not guaranteed to be consistent for small sample sizes, as in this study. Conversely, analysing all possible model configurations has the advantage of using the whole sample size available. For this reason, the discriminating power of both the individual parameters and all their possible combinations was tested in this study. To our knowledge, this is the first study to propose a systematic evaluation of the performance of non-invasive measures for the degree of AF organization on invasive recordings. The important advantage of non-invasive parameters for AF complexity is that they do not depend on annotations of activation times, which are usually based on assumptions for conduction velocity, refractory period, and thresholds for conduction block. The results suggest that an optimal sub-set of non-invasive measures can be defined for this purpose. This sub-set combines time- and frequency-domain measures which capture different features of the remodelling processes affecting the atrial myocardium during AF development. Moreover, this sub-set has proven to be a good predictor of invasive measures. Analysis of the residual predictive power of non-invasive measures, while taking into account the contribution of the invasive measures, revealed that only WS performs as well as the non-invasive measures in predicting AF organization degree, while NW and NBT were outperformed by non-invasive measures. However, none of the measures appeared to be a significant discriminator of the AF group ST and LT. This is likely due to the strong correlation among non-invasive and invasive measures previously described.
Among all selected non-invasive measures, SAE was the least discriminating one. This is in line with what was previously found by Petersson et al.,17 who showed that the discriminant power of sample entropy was not strong enough to predict the maintenance of sinus rhythm after electrical cardioversion. Moreover, regardless being considered an important predictor of paroxysmal AF termination,14 fibrillatory rate (DAF) was not selected as an important predictor of AF organization degree in this study. Similar results have been suggested by Bollmann et al.,18 who could not find a relation between fibrillatory rate and AF recurrence after pharmacological cardioversion. The very poor classification performance of SC and SV (Figure 2, Table 1) could be caused by the fact that frequency spectra are calculated on shorter time windows (1 s) compared with the original study (10s),7 which yields a lower frequency resolution, which in turn may bias the estimation of the spectral distribution (hence SV) as well as the spectral concentration (SC). Another cause may have been dominant AF frequency for goats outside (i.e. higher than) the range 4–10 Hz that was considered for human patients in the original study.7
Alcaraz et al.19 compared SAE and fWP assessed on the precordial lead V1 with the same indices calculated from two unipolar RA electrograms. This study did not suggest any comparison with other non-invasive measures of AF organization. In addition, the extremely local information provided by only two unipolar leads prevents from taking into account possible spatial inhomogeneities of the atrial myocardium caused by electrostructural remodelling, which become more sizeable the more AF becomes sustained. SAEM did not correlate with any invasive measure in this study. This may be due to the strong pre-processing applied to the signal to obtain the MAW, which can result in an important loss of information about the degree of disorganization of the actual signal. The same concerns apply to a following study from the same authors,20 in which a novel method for ST AF organization estimation from single-lead surface ECG recordings was presented.
We hypothesize that the poor discriminatory performance of the RA may be due to the pacing location. The artificial pacing applied at the RA may cause a non-physiological degradation of the atrial myocardium, in contrast the propagation to the LA followed more natural dynamics, causing a physiological electrostructural remodelling. This can also be noticed in Figure 1, where the RA epicardial electrograms from the acute and chronic AF goats (top row) share more similarities in their morphologies (likely due to the strong influence of the pacing on the RA) than the corresponding electrograms from the LA (bottom row). Similar differences were also observed by Verheule et al.,10 with the LA more severely affected than the RA for most parameters evaluated. The extensive atrial mapping performed in this study guarantees that inhomogeneities and spatial differences in the atrial myocardium are properly taken into account, guaranteeing at the same time a consistent use of all measures describing the spatiotemporal organization of the AF substrate. While it may be of more interest to discriminate between complex patterns of AF, our groups of acute and chronic AF were chosen as the controlled conditions with different degrees of AF complexity allowed assessment of the techniques.
Clinical implications
Our findings may not be completely applicable to humans; however, studies have found similarities in the anatomical and functional properties of the human and the goat atria.11,21,22 Our results suggest that the selected optimal set of parameters traditionally used to quantify AF complexity using ECG recording can also be reliably used to determine AF complexity in invasive recordings suggesting that these parameters might be useful to predict outcome when used on direct contact electrograms. This would contribute to reach the final goal of a more personalized management of AF, which requires careful case-by-case assessment of the relative degree of electrophysiological changes, based on information which can be collected through history taking, risk scores, and the ECG among the others, as stated in the recent NETwork/European Heart Rhythm Association consensus paper for the personalized management of AF.3
Limitations
The substrate for AF in this goat model of lone AF may not be representative for all patients with AF.10 In many patients, the underlying heart disease or advanced age may lead to atrial structural changes that create a pre-existing substrate for AF. Moreover, the differences between the ST and LT groups may be thought to be comparable with differences in the AF dynamics between acute AF and chronic AF. These differences are relatively easy to observe (see bottom row of Figure 1) and the ability of the selected optimal sub-set to distinguish more subtle differences, for instance, between persistent and longstanding AF, needs to be tested on surface ECGs. In particular, all the measures used in this study were specifically designed to work with surface ECG. The results show that they should perform similarly when applied to epicardial data. However, the extent of the influence of ventricular activity cancellation on some of the parameter needs to be investigated further. Finally, additional information on anatomical data such as atria diameters was intentionally disregarded, to provide accurate classification based on conventional recording systems only. Even though the choice of the parameters investigated in this study was carefully based on literature research, and the parameters selected for this study were considered well representative of the whole spectrum, we might have missed some parameters relevant for AF substrate complexity assessment.
Conclusions
In this study, we analysed the performance of different non-invasive measures of AF organization on invasive epicardial animal data and selected a sub-set of optimal measures for AF substrate complexity assessment. This was done to address the need for validation and standardization of non-invasive measures of AF substrate complexity to make the clinical relevance of ECG-based AF substrate classification stand out. Perfect discrimination between ST and LT AF was made possible by this sub-set. Moreover, the good prediction that the optimal sub-set offers with respect to invasive measures further supports their alternative use. Finally, the measures selected in this study may constitute an important contribution in the clinical setting to estimate procedure success and tailor therapy for better patient outcomes, and they represent a forward step towards validation and standardization of time- and frequency-domain measures of AF organization.
Conflict of interest: none declared.
