


T-wave alternans (TWA) represents myocardial instability. The present study was to determine the impact of cardiac resynchronization therapy (CRT) on TWA and left ventricular ejection fraction (LVEF) in heart failure patients.
T-wave alternans was analysed using a spectral method in 27 CRT-ICD patients. Ambulatory device electrograms were collected and LVEF and New York Heart Association (NYHA) classification were assessed at baseline prior to CRT and 3 months following CRT. Patients were followed for 6 months to monitor cardiac events. Spectral TWA of device electrograms was measured during AAI and CRT pacing tests. Each pacing mode had the up-titration pacing rate from 90 to 105 b.p.m. with 90 s for each pacing rate. At baseline, 20 (76.9%) patients had TWA during AAI pacing tests and 13 (50%) during CRT pacing tests (P = 0.044 between two pacing modes). Following 3-month CRT, TWA was identified in 11 patients (45.8%) during AAI pacing tests (a 31.1% reduction from the baseline value, P = 0.023) and 7 patients (28%) during CRT pacing tests (a 22% reduction, P = 0.108). Six of seven patients who had cardiac events had TWA (three patients had arrhythmic events, two died of heart failure, one received heart transplant). Overall, LVEF improved from 27.3 ± 5.8 to 35.9 ± 10.5% (P < 0.001) and NYHA classification improved from 2.8 ± 0.6 to 1.6 ± 0.6 after 3-month CRT (P < 0.001).
In heart failure patients who receive a CRT-ICD, CRT reduces TWA that is associated to cardiac events, suggesting that CRT promotes clinically significant reverse electrical and mechanical remodelling.
In patients receiving an ICD-CRT device, cardiac resynchronization therapy (CRT) reduces T-wave alternans (TWA) acutely and chronically and improves left ventricular ejection fraction and New York Heart Association classification by 3-month CRT, suggesting reverse electrical and mechanical remodelling by CRT.
There is an association between TWA and the occurrence of arrhythmic and mechanical events during the 6-month follow-up period, raising the possibility that implantable device-based TWA assessment may potentially be used not only to predict the risk of ventricular arrhythmia but also assess the progression of heart failure and guide medical therapy.
The electrogram recorded by left ventricular near-field lead configuration is more sensitive than the device far-field electrogram to detect TWA, potentially a novel technique for TWA assessment during clinical use.
Introduction
Systolic heart failure describes a state of weak myocardial contractility and low left ventricular ejection fraction (LVEF), resulting in an increased incidence of arrhythmias and decompensated heart failure necessitating hospitalization. Methods that can predict myocardial electrical instability and mechanical deterioration are needed so that patients can be better managed. Recently, T-wave alternans (TWA) has been recognized as a predictor for sudden cardiac death, arrhythmic events, and mortality (sudden and non-sudden cardiac death) in patients with heart failure.1–7
T-wave alternans is an electrocardiogram (ECG) phenomenon with beat-to-beat alternation in the morphology and/or amplitude of the T-wave during a normal rhythm.6–10 T-wave alternans is the result of alternations in repolarization of the action potential duration caused by abnormalities in intracellular Ca++ cycling (Ca++ release, reuptake, and transport to the junctional sarcoplasmic reticulum).10–12 Thus, TWA represents myocardial electrical instability, and is associated with an increased incidence of ventricular tachyarrhythmia [ventricular tachycardia (VT)/ventricular fibrillation (VF)].5,13–17 On the other hand, weak myocardial contractility during heart failure is also primarily caused by abnormal intracellular Ca++ cycling, causing mechanical alternans, a sign of acute deterioration of heart failure.9,18,19 Thus, TWA is potentially associated with not only VT/VF, but also failure of myocardial mechanics. While TWA amplitude increase before VT/VF events in humans has been reported,14–16,20,21 a few animal experiments have demonstrated that TWA exists during myocardial mechanical failure.22–24 Patients with heart failure also show a high incidence of TWA.3,25–27
Previous studies in implantable cardioverter-defibrillator (ICD) patients have demonstrated that device electrogram (EGM)-based TWA is related to the occurrence of sudden cardiac death.15,16,20,21 The present study used EGM-based TWA method to determine the impact of cardiac resynchronization therapy (CRT) on TWA and cardiac function in heart failure patients who received CRT-ICD.
Methods
The present study was a single-centre, prospective study with 6-month follow-up post-implantation of CRT-ICD in patients with heart failure. The study protocol was approved by the hospital Investigational Research Board and in compliance with the Declaration of Helsinki and with the laws and regulations in China. All patients completed written informed consent.
Selection of patients
Twenty-seven patients were enrolled between November 2011 and February 2013. The inclusion criteria included: (i) patients had systolic heart failure; (ii) patients were clinically indicated for the therapy with resynchronization ICD (Medtronic Models 7277, 7279, and 7289), e.g. LVEF ≤ 35%, a QRS duration ≥120 ms, New York Heart Association (NYHA) Classification III or IV, and under optimal heart failure therapy with medications; (iii) the baseline rhythm was sinus with 1 : 1 atrioventricular (AV) conduction; and (iv) patients were 18 years of age or older. Patients were excluded if (a) measurement of TWA was not feasible (e.g. permanent atrial fibrillation, frequent premature ventricular contractions); (b) patients had a medical condition that would limit study participation as assessed by physicians; (c) patients would be inaccessible for follow-up at the study centre; (d) patients were enrolled or intended to participate in other clinical studies during the study period that would confound the results of the present study; and (e) patients were pregnant.
Study procedures
Device data collection
The first data collection occurred shortly after device implantation, and the second data collection was conducted at 3 months after CRT. All enrolled patients received CRT-ICD implantation and stayed in the hospital for 7 days post-implant during which CRT was not turned on. Five to seven days after the implantation of CRT-ICD, the device was interrogated with Medtronic Programmer 2090 and the lead configurations of two-channel device EGMs were programmed for left ventricular (LV) near-field EGM using LVtip-to-LVring of LV lead and for far-field EGM using device Can-to-RVcoil. The LV near-field EGM was used to assess the possibility of detecting TWA in a local LV region. The device EGM range was programmed at 2 or 4 mV as described previously.16,21 The programmer was connected with a data acquisition system (DATAQ Instruments) for EGM data recording at a sampling rate 900 Hz. Then, each patient underwent TWA tests using AAI pacing and CRT pacing (DDD mode and AV delay: paced AV interval, 137.0 ± 27.3 and sensed AV interval: 108.1 ± 21.8 ms) with a rest interval of 5 min between AAI and CRT pacing tests. The procedures of EGM data collection and TWA pacing tests at 3-month follow-up were identical to those at baseline.
T-wave alternans pacing tests
After the device was interrogated and two-channel EGM recording was in place, data collection was performed in each patient for: (i) a baseline of 5 min, (ii) AAI up-titration pacing rate from 90 to 105 b.p.m. with 90 s for each pacing rate, (iii) 5 min of rest, and (iv) CRT up-titration pacing rate from 90 to 105 b.p.m. with 90 s for each pacing rate. Subsequently, EGM data at each pacing rate of each pacing mode were analysed offline for TWA in the frequency domain.
T-wave alternans measurements
Clinically, surface ECG TWA is measured in the frequency domain by applying the fast Fourier transform.1,2,8 To measure TWA in device EGMs, a custom software program using Matlab (Release 7.0 version 14, Matlab Inc.) was developed and validated using the fast Fourier transform based on the public domain8 and as described previously.28 Briefly, the ventricular sensing or pacing marker was used as a fiducial point of QRS complex. T-waves within the 90 s TWA pacing test were measured during a 150–200 ms wide interval after the fiducial point of each QRS complex. The amplitudes of corresponding points of consecutive T-waves were measured to construct a beat series. The power spectrum of this beat series was then calculated using the fast Fourier transform. T-wave alternans was indicated at the peak of the spectrum at 0.5 cycles/beat.8,28 The magnitude of TWA (μV) was then calculated as the square root of the alternans power. The K score was defined as the ratio (signal-to-noise ratio) of the alternans power divided by the standard deviation of the power in the noise band. T-wave alternans test was positive only when its K score was ≥3 and the TWA amplitude was documented. Otherwise, negative TWA test result was assigned if the K score was <3. T-wave alternans pacing test results were discarded if EGM quality was inappropriate for TWA analysis, which was mostly caused by inconsistent capture, loss of 1 : 1 AV conduction.
Clinical data
Patients' clinical data of cardiac disease history, echocardiogram (Echo), NYHA classification, ECG, and medications were collected at baseline and 3-month follow-up visit. Another follow-up at 6-month post-implant was conducted to assess cardiac events including arrhythmic events with appropriate ICD therapy and the mortality.
Data analysis
Data are presented as mean ± SD or percentage wherever applicable. The number or percent of positive TWA tests was compared using the method of Chi-square test between AAI pacing test and CRT pacing test and between baseline test and test at 3-month follow-up, respectively. Paired or unpaired t-test was used to compare numeral values at baseline and follow-up and EGM TWA amplitudes by different pacing modes, lead configurations, and test timepoints. A statistically significant difference required a probability of P < 0.05.
Results
Patient clinical data
Major clinical characteristics of the 27 enrolled patients are summarized in Table 1. All patients were indicated for CRT-ICD with low LVEF (27.3 ± 5.8) and wide QRS duration (158.9 ± 32.9 ms). The large LV end-diastolic volume (mean 265 mL, Table 1) was indicative of dilated heart failure decompensation. All patients underwent optimal medications with diuretics, beta-receptor blockers, angiotensin-converting enzyme inhibitors, and/or angiotensin II receptor blocker. Six patients (22.2%) had a history of VT/VF prior to the enrolment. During follow-up post-CRT, two patients died from complications of decompensated heart failure.
Patient baseline characteristics
| Age (years) | 58.1 ± 10.1 |
| Gender [male, N (%)] | 17 (63.0) |
| LVEF (%) | 27.3 ± 5.5 |
| LV end-systolic volume (mL) | 198.1 ± 76.4 |
| LV end-diastolic volume (mL) | 275.3 ± 91.9 |
| QRS width (ms) | 158.9 ± 32.9 |
| NYHA classification | 2.8 ± 0.6 |
| Heart diseases | |
| Coronary artery disease, N (%) | 15 (55.6) |
| Myocardial infarction, N (%) | 12 (44.4) |
| Cardiomyopathy, N (%) | 17 (63.0) |
| Medications | |
| Diuretics, N (%) | 27 (100) |
| Beta-blockers, N (%) | 26 (96.3) |
| ACEI/ARB, N (%) | 21 (77.8) |
| Inotropic drug (digoxin), N (%) | 18 (66.7) |
ACEI, angiotensin-converting enzyme inhibitor; ARB, angiotensin II receptor blocker.
Overall T-wave alternans tests
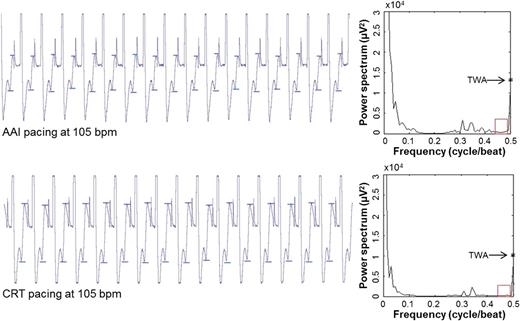
Example of device-recorded EGMs and corresponding spectral TWA measurements at baseline pacing tests. Top: EGM and 102 µV TWA during AAI pacing at 105 b.p.m. Bottom: EGM and 91 µV TWA during CRT pacing at 105 b.p.m. Visible TWA (peak-to-peak T-wave amplitude between two small bars) presents in EGM recording during pacing test.
T-wave alternans at baseline and 3-month follow-up visit
AAI pacing test vs. cardiac resynchronization therapy pacing test

Comparisons of TWA test results by AAI and CRT pacing at baseline and 3-month CRT. Left panels are for pacing tests at 90 b.p.m. while the right panels are for pacing tests at 105 b.p.m. (A, E) Comparisons between AAI pacing and CRT pacing at baseline (BL); (B, F) at 3-month (3M) CRT; (C, G) between the baseline and 3-month follow-up by AAI pacing tests; and (D, H) between the baseline and 3-month follow-up by CRT pacing tests. P values were obtained by χ2 test.
AAI pacing test at baseline and 3-month follow-up
Following 3 months of CRT, the number of positive TWA test results during AAI pacing, either 90 or 105 b.p.m., was significantly reduced compared with that at baseline (Figure 2C and G). Overall, there was a 30% reduction of positive TWA test results for AAI pacing at 90 b.p.m. and 31% reduction for AAI pacing at 105 b.p.m. after 3 months of CRT.
Cardiac resynchronization therapy pacing test at baseline and 3-month follow-up
The number of positive TWA test results by CRT pacing at 90 b.p.m. at baseline was not significantly different from that at 3-month follow-up (Figure 2D). There was a trend of reduction (22% from the baseline) in the positive TWA test results by CRT pacing at 105 b.p.m. at 3-month follow-up visit when compared with the baseline (P = 0.108, Figure 2H).
T-wave alternans detected by different lead configurations
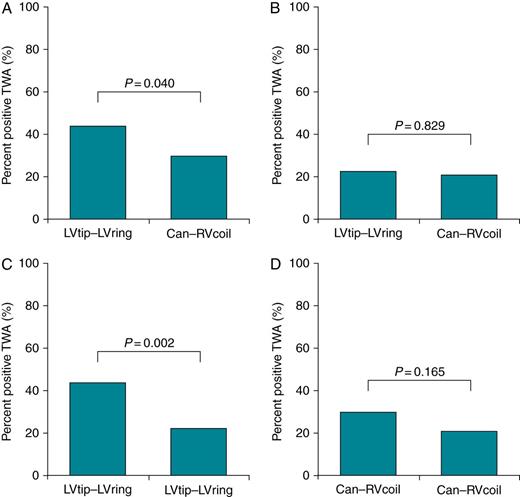
Comparisons of the percentage of patients with positive TWA detected by near-(LVtip–LVring) and far-field (Can–RVcoil) lead configurations. Test results of positive TWA are pooled together for both AAI pacing and CRT pacing. (A) Per cent of positive TWA test results between near-field vs. far-field EGMs at the baseline; (B) near-field vs. far-field at 3-month CRT; (C) comparison of TWA in near-field EGM between baseline and 3-month CRT; and (D) comparison of TWA in far-field between baseline and 3-month CRT.
T-wave alternans and the assessment of cardiac function
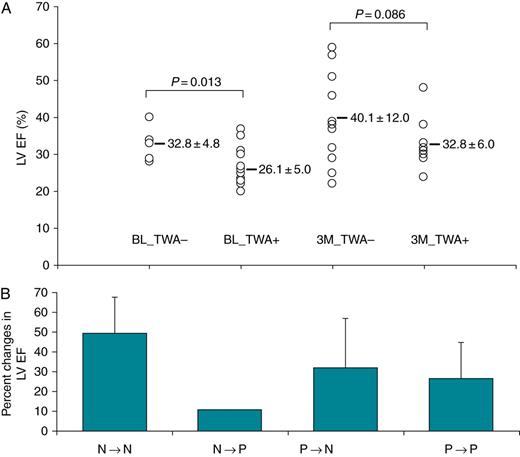
Association of TWA test results with LVEF. (A) The ordinate gives the value of LVEF (%); from the left to right are individual measurements of LVEF in patients without and with TWA at the baseline (BL) and at 3-month (3M) CRT. (B) The ordinate is the percent changes in LVEF after 3-month CRT from the baseline based on TWA test results. The abscise is the change of TWA test results from baseline to (→) 3-month CRT (N, no TWA; and P, positive TWA).
T-wave alternans and cardiac events at baseline and follow-up
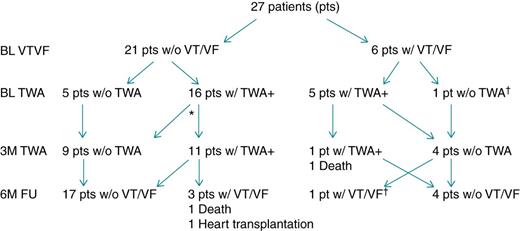
The number of patients with TWA test results, the VT/VF incidence and mortality at baseline, 3-month, and 6-month follow-up. *One patient without appropriate EGM at 3 months; †Same patient.
Discussion
Main findings
Consistent with previous reports that TWA of device EGM can be measured by spectral analysis of the fast Fourier transform and a predictive measure of the risk for VT/VF occurance,20,28,29 the present study also showed an association between TWA and the occurrence of VT/VF events. Furthermore, the present study demonstrates two phases, acute and chronic, of the reduction of TWA by CRT in patients with heart failure and an association between TWA and mechanical function in terms of LVEF. In addition, the LV near-field EGM is more sensitive in detecting TWA than the far-field EGM.
T-wave alternans has been thought to represent myocardial electrical instability and be related to the occurrence of VT/VF. Computer simulations and basic research in animals identify spatiotemporal TWA as an immediate causal antecedent of VT/VF.30–33 T-wave alternans occurrence or TWA amplitude increase occurring before VT/VF events in humans have been reported.14–16,20,21 While many clinical studies have been performed to establish ECG TWA test as an independent predictor of long-term risk of VT/VF events,1–9 the potential value of TWA assessed in implantable-device EGMs in ICD patients is as an immediate antecedent of VT/VF. Christini et al.29 observed TWA of unipolar EGMs recorded from temporary electrodes in patients who underwent an electrophysiological study. Armoundas et al.20 reported TWA immediately prior to an event of VT in the device EGM in one patient with an ICD. Recently, the multi-centre study by Swerdlow et al.16 demonstrates that high-amplitude TWA of device EGMs could yield a sensitivity of 61% of the predictive power for VT/VF event prediction in ICD population, demonstrating a temporal relationship between TWA and the occurrence of VT/VF in patients with a high risk of sudden cardiac death. The present study also demonstrates an association of positive TWA test results with a history of VT/VF incidence and with VT/VF occurrence during the follow-up period. However, the present study was not designed to record device EGMs right before each VT/VF episode. Thus, it is unknown whether TWA amplitude of the present study increased prior to VT/VF events as observed in the previous study.14–16,20,21
In the present study, the finding of lower LVEF in patients with TWA than in those without TWA suggests that TWA may be associated with the process of mechanical instability of heart failure. Three patients who died of heart failure or received heart transplant had TWA and low LVEF. Previous animal experiments have demonstrated that TWA in large amplitude exists during myocardial mechanical failure.22–24 Human clinical observations also confirmed existence of TWA related to heart failure, especially in patients with cardiomyopathy.3,25–27 The mechanism of the association of TWA and the progression of heart failure is not well established. However, it has been well recognized that the underlying mechanisms of TWA are associated with abnormal intracellular calcium cycling that leads to alternations in repolarization (electrical alternans) of the action potential.10–12 On the other hand, the abnormal intracellular Ca++ cycling is also associated with weakening myocardial contractility in heart failure, leading to alternative weakening contraction.18,19 Therefore, TWA is potentially related to not only the risk of the occurrence of ventricular tachyarrhythmia, but also with progression of worsening myocardial mechanics.
Cardiac resynchronization therapy pacing in the present study reduced the number of positive TWA test results, which is consistent with a previous report.34 Reduction of TWA by CRT in the present study occurred in two phases, e.g. the acute phase at the baseline CRT pacing and the chronic phase after 3 months of CRT. As shown in Figure 2, there is approximately a 27% reduction in positive TWA test results by CRT pacing from 77% positive TWA test results by AAI pacing at baseline. A further reduction of positive TWA test results by either AAI pacing or CRT pacing was observed after 3 months of CRT, suggesting a reverse remodelling of myocardial electricity by CRT. Furthermore, there was a 31.5% increase in LVEF after 3 months of CRT in the present study, indicating the reserve mechanical remodelling. The reverse remodelling post-long-term CRT may be caused by CRT-related improvement in ventricular function with a possible concurrent improvement in intracellular calcium cycling. The potential explanation for acute-phase reduction of TWA by CRT pacing in the present study may be related to the resynchronization effect of CRT, i.e. some of positive TWA test results in CRT-indicated patients might be related to dysschronization and/or an altered pattern of action potential propagation that could be corrected instantly by CRT pacing, leading to an acute reduction in TWA. More research is needed to confirm this theory.
Clinical TWA tests have been conducted using body surface ECG as essentially a far-field cardiac signal. Previous studies in which TWA of device EGM was assessed mostly used far-field lead configurations.16,20,28 The present study used the LV lead to collect EGM generated in the LV and observed more positive TWA test results than in far-field EGM collected by device Can-to-RVcoil lead configuration. It is unknown whether TWA in near-field EGM is truly a local TWA in the region surrounding the recording electrodes, or if the locally detected TWA represents part of a large ventricular area that has TWA not detected by far-field EGM. This finding interestingly raises the possibility of local TWA and thus regional ventricular instability that can be detected with most sensitivity by a local electrode. More research is warranted to clarify the clinical relevance of locally detected TWA.
Limitations
First, the sample size of the present study is relatively small with 27 CRT-ICD patients. Four patients developed VT/VF incidence during the 6-month follow-up period—this small number of VT/VF occurrences cannot allow for an accurate determination of the sensitivity and specificity of using TWA for prediction of VT/VF events. Furthermore, the usefulness of TWA for VT/VF event prediction has been confirmed in several studies in ICD patients. The present study lacks an ICD control group to compare the predictive value of TWA between CRT-ICD patients and ICD-only patients. Moreover, while the present study demonstrates an association of pacing-induced TWA with VT/VF events in history or during follow-up, the study does not address the temporal relationship between TWA and VT/VF events, e.g. whether TWA immediately precedes spontaneous VT/VF as observed in the previous studies.15,16,20,21 In addition, in the present study, the reduction in TWA and the improvement in LVEF after CRT are used to suggest reverse electrical and mechanical remodelling of a failing heart in CRT-ICD patients. Such a correlation between reverse remodelling and the reduced TWA and improved LVEF by CRT needs to be further confirmed in basic mechanism investigation and clinical studies with longer follow-up and more parameters relating to reverse remodelling.
Conclusions
T-wave alternans has been recognized as a predictive measure of either short-term or long-term occurrence of ventricular tachyarrhythmia. The present study demonstrates an association of TWA with cardiac electrical and mechanical events and reduction of TWA by acute and long-term CRT that leads to improvement of LVEF and NYHA classification, suggesting reverse electrical and mechanical remodelling by CRT. With advancements in the technology of implantable devices, device-based TWA assessment is possible, which can potentially be used to predict risk of ventricular arrhythmia, and to assess the progression of heart failure and guide medical therapy.
Conflict of interest: X.Z., J.C., and C.L. are employees of Medtronic that makes pacemaker products, and they receive salary from the company and hold company stocks. All other authors have no conflicts to declare.
Funding
This work was partly supported by a research grant of Medtronic (Shanghai) Inc. Shanghai, China. X.Z., J.C., and C.L. are Medtronic employees and had a role in study design, data collection, and analysis.
