


Country differences in management practices are evident, and the publication of management guidelines by the European Society of Cardiology (ESC) and other learned societies has tried to recommend a uniform evidence-based approach to management. Despite the availability of guidelines and efforts to improve implementation, differences in guideline adherence are evident, and differences between countries and regions within Europe are therefore likely.
In this analysis from the baseline dataset of the EORP-AF Pilot survey, we examined regional differences in presentation and treatment of contemporary patients with atrial fibrillation (AF) in Europe, as managed by European cardiologists. We focused on a subgroup of 902 hospital admitted patients in whom no rhythm control was performed or planned. Chronic heart failure was more common in East countries (P < 0.0001) while hypertension and peripheral artery disease were more common in South countries (both P < 0.0001). Previous bleeding and chronic kidney disease were more common in South countries (both P < 0.0001). A CHA2DS2-VASc score of ≥2 was highest in East and South countries (93.0 and 95.3%, respectively) compared with 80.8% in West countries (P < 0.0001). A HAS-BLED score of ≥3 was also highest in East and South countries (18.0 and 29.2% respectively) compared with 4.8% in West countries (P < 0.0001). Oral anticoagulation (OAC) use (either as OAC or OAC plus antiplatelet therapy) in West, East, and South countries was 72.0, 74.7, and 76.2%, respectively. Only antiplatelet therapy was used in 13.6, 15.4, and 12.4%, respectively. An initial rate control strategy only was most common in South countries (77.8%) (P < 0.0001).
From the systematic collection of contemporary data regarding the management and treatment of AF in nine participating member ESC countries, we provide hypothesis-generating insights into regional management practices in Europe with regard to patient characteristics and treatment options.
We provide systematic collection of contemporary data regarding the management and treatment of AF in nine participating member ESC countries.
There are important hypothesis-generating insights into regional management practices in Europe with regard to patient characteristics and treatment options.
Introduction
Atrial fibrillation (AF) remains the commonest sustained cardiac arrhythmia worldwide, and given the complications associated with this increasingly prevalent arrhythmia, AF confers a major public health burden. Recent projections based on the Rotterdam study suggest that from 2010 to 2060, the number of adults ≥55 years with AF in European countries will increase 2-fold, to 17.9 million (95% CI: 13.6–23.7 million) assuming that the age- and sex-specific prevalence remains stable.1 Similar observations have been noted in North America.2
The European Society of Cardiology (ESC) conducted the EuroHeart survey a decade ago, to get an insight into the epidemiology and clinical practice of European cardiologists, related to AF.3 Since that initial survey, many new studies have addressed the impact of rate vs. rhythm control, and the use of catheter ablation—which have shaped new guidelines.4,5 Furthermore, the contemporary management of AF has changed towards being more patient-centred and symptom-directed.6
Country differences in management practices are evident, and the publication of management guidelines by the ESC and other learned societies has tried to recommend a uniform evidence-based approach to management. Indeed, the guideline adherent treatment of AF is associated with much better outcomes.7,8 Despite the availability of guidelines and efforts to improve implementation, differences in guideline adherence are evident in everyday practice.9–11 Differences between countries and regions within Europe are therefore likely.
In this analysis from the baseline dataset of the EORP-AF Pilot survey, we examined regional differences in presentation and treatment of contemporary patients with AF in Europe, as managed by European cardiologists.
Methods
The full baseline features and results from the EORP-AF Pilot survey have been previously published.10 In this ancillary analysis, we focused on regional differences in clinical features and management. In brief, the EORP-AF registry population comprised consecutive in- and out-patients with AF presenting to cardiologists in participating ESC countries. For the whole registry, consecutive patients were screened for eligibility at the time of their presentation to a cardiologist (either based at hospital or non-hospital medical outpatient centre). All patients provided written informed consent. Patients with the primary or secondary recorded diagnosis of AF were included.
As previously described, patients were officially enrolled in the EORP-AF only if an electrocardiogram (ECG) diagnosis (12-lead ECG, 24 h Holter, or other electrocardiographic documentation) confirming AF was made.10 The qualifying episode of AF should have occurred within the last year, and patients did not need to be in AF at the time of enrolment. For the pilot phase, nine countries formally participated. A minimum of 20 consecutive patients per centre were to be enrolled, with a target of 3000 patients. Enrolment into the registry started in February 2012, and the end of enrolment was March 2013.
As only nine countries participated in the EORP-AF Pilot General registry, we arbitrarily divided the participating countries into three country groups: West (Belgium, Denmark, Netherlands, and Norway), East (Poland and Romania), and South (Greece, Italy, and Portugal). We recognize the artificial nature of such a division, but modest patient numbers in some individual countries preclude meaningful country-by-country comparisons.
Statistical analyses
Univariate analysis was applied to both continuous and categorical variables. Continuous variables were reported as mean ± SD or as median and interquartile range (IQR). Among-group comparisons were made using a non-parametric test (Kruskal–Wallis test). Categorical variables were reported as percentages. Among-group comparisons were made using a χ2 test or Fisher's Exact test if any expected cell count was less than five.
Results
Patient characteristics and antithrombotic drug use of hospital-admitted patients in whom no PCV and ECV and catheter ablation were performed or planned
| Wholecohort | West | East | South | P-value | |
|---|---|---|---|---|---|
| Belgium, Denmark, Netherlands, Norway | Poland, Romania | Greece, Italy, Portugal | |||
| N = 902 | N = 125 | N = 462 | N = 315 | ||
| Demographics: | |||||
| Age (years) (mean ± SD) | 71.2 ± 11.3 | 70.2 ± 12.2 | 69.1 ± 10.7 | 74.5 ± 11.0 | <0.0001 |
| Age (years) (median, IQR) | 73 (64–79) | 73 (64–78) | 69 (62–77) | 76 (69–82) | |
| Female gender (%) | 41.0 | 36.8 | 44.2 | 38.1 | 0.1414 |
| Type of AF: | |||||
| First detected (%) | 36.5 | 30.5 | 32.7 | 44.2 | <0.0001 |
| Paroxysmal (%) | 19.0 | 40.7 | 18.8 | 11.2 | |
| Persistent (%) | 12.5 | 9.3 | 12.5 | 13.8 | |
| Long standing persistent (%) | 2.4 | 2.5 | 4.0 | 0.0 | |
| Permanent (%) | 29.5 | 17.0 | 32.0 | 30.8 | |
| Reason for visit: | |||||
| AF (%) | 31.6 | 48.8 | 33.1 | 22.5 | <0.0001 |
| Acute myocardial infarction (%) | 8.2 | 7.2 | 6.7 | 10.8 | |
| Valvular heart disease (%) | 7.1 | 4.0 | 4.8 | 11.8 | |
| Hypertension (%) | 1.3 | 1.6 | 2.2 | 0.0 | |
| Heart failure (%) | 31.6 | 18.4 | 34.2 | 33.0 | |
| Other coronary artery disease (%) | 8.9 | 5.6 | 10.6 | 7.6 | |
| Other cardiac (%) | 8.5 | 11.2 | 5.8 | 11.4 | |
| Other non-cardiac reason (%) | 2.8 | 3.2 | 2.6 | 2.9 | |
| Past medical history | |||||
| Ischaemic thromboembolic complications (%) | 16.6 | 13.0 | 15.8 | 19.2 | 0.2350 |
| Previous TIA (%) | 4.8 | 3.3 | 2.6 | 8.6 | 0.0005 |
| Previous stroke (%) | 7.9 | 6.5 | 8.9 | 7.0 | 0.5224 |
| Chronic heart failure (%) | 63.4 | 34.8 | 72.7 | 60.1 | <0.0001 |
| Hypertension (%) | 74.1 | 56.8 | 75.9 | 78.2 | <0.0001 |
| Coronary artery disease (%) | 47.6 | 41.8 | 49.6 | 46.8 | 0.3629 |
| Peripheral vascular disease (%) | 15.0 | 2.9 | 10.8 | 25.2 | <0.0001 |
| Diabetes mellitus (%) | 26.7 | 22.4 | 27.6 | 27.1 | 0.5014 |
| Haemorrhagic events (%) | 9.2 | 3.3 | 6.1 | 15.9 | <0.0001 |
| Malignancy (%) | 4.6 | 5.7 | 3.5 | 5.7 | 0.3078 |
| Chronic kidney disease (%) | 21.6 | 6.4 | 22.5 | 26.4 | <0.0001 |
| CHADS2 score: | |||||
| 0 | 6.6 | 20.0 | 5.0 | 3.8 | <0.0001 |
| 1 | 18.6 | 21.6 | 18.8 | 17.1 | |
| ≥2 | 74.7 | 58.4 | 76.2 | 79.1 | |
| CHAD2DS2-VASc score: | |||||
| 0 | 2.1 | 6.4 | 2.0 | 0.6 | <0.0001 |
| 1 | 5.8 | 12.8 | 5.0 | 4.1 | |
| ≥2 | 92.1 | 80.8 | 93.0 | 95.3 | |
| HAS-BLED score | |||||
| 0–2 | 79.9 | 95.2 | 82.0 | 70.8 | <0.0001 |
| ≥3 | 20.1 | 4.8 | 18.0 | 29.2 | |
| Antithrombotic treatment at discharge: | |||||
| None and Unknown | 2.7 | 7.2 | 2.4 | 1.3 | 0.0064 |
| OAC alone | 53.4 | 56.8 | 54.6 | 50.5 | |
| AP alone | 14.1 | 13.6 | 15.4 | 12.4 | |
| OAC + AP | 21.4 | 15.2 | 20.1 | 25.7 | |
| Othera | 8.4 | 7.2 | 7.6 | 10.2 | |
| Initial management strategy: | |||||
| Rate control only (%) | 63.5 | 46.4 | 58.4 | 77.8 | <0.0001 |
| Rate and rhythm control (%) | 24.6 | 36.8 | 32.0 | 8.9 | |
| Rhythm control only (%) | 5.5 | 6.4 | 7.6 | 2.2 | |
| Observation (%) | 6.3 | 10.4 | 2.0 | 11.1 | |
aOthers include: OAC + other ATT, AP + other ATT, OAC + AP + other ATT and Other ATT (fondaparinux, LMW heparin, UF heparin, other).
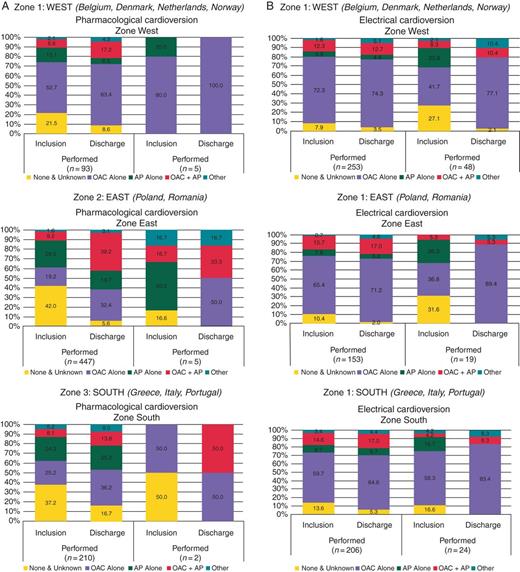
Antithrombotic drug prescription at inclusion and at discharge in patients undergoing cardioversion or ablation. (A) Pharmacological cardioversion by zone. (B) Electrical cardioversion by zone. (C) Catheter ablation by zone.
Previous stroke/thromboembolism, coronary artery disease, diabetes, or malignancy were not significantly different between regions, but previous transient ischaemic attack (TIA) was more prevalent in South countries. Chronic heart failure was more common in East countries (P < 0.0001), while hypertension and peripheral artery disease were more common in South countries (both P < 0.0001). Previous bleeding and chronic kidney disease were more common in South countries (both P < 0.0001).
The proportion with a CHADS2 score of ≥2 was highest in East and South countries (76.2 and 79.1%, respectively) compared with 58.4% in West countries. A CHA2DS2-VASc score of ≥2 was also highest in East and South countries (93.0 and 95.3%, respectively) compared with 80.8% in West countries (P < 0.0001). A HAS-BLED score of ≥3 was also highest in East and South countries (18.0 and 29.2%, respectively) compared with 4.8% in West countries (P < 0.0001).
Oral anticoagulation (OAC) use (either as OAC or OAC plus antiplatelet therapy) in West, East, and South countries was 72.0, 74.7, and 76.2%, respectively. Antiplatelet therapy use alone was used in 13.6, 15.4, and 12.4%, respectively. An initial rate control strategy only was most common in South countries (77.8%) (P < 0.0001).
Determinants of antithrombotic therapy use by region
The factors predictive of OAC monotherapy [VKAs or Non-vitamin K antagonist oral anticoagulant (NOAC)] prescription in West countries were lack of coronary artery disease (P < 0.0001) and hypertension (P = 0.0275). In East countries, predictive factors were younger age (P = 0.0026), female gender (P = 0.0112), non-valvular heart disease (P = 0.0048), no chronic heart failure (P = 0.0043), lack of coronary/peripheral artery disease (P < 0.0001), and non-rhythm control (P = 0.006). In South countries, female gender (P = 0.0284), no coronary artery disease (P < 0.0001), no diabetes (P = 0.0079), and type of AF (P = 0.0386) were predictive factors (Table 2).
Factors associated with prescription of antithrombotic therapy
| Odds ratio | 95% Confidence limits | P-value | ||
|---|---|---|---|---|
| (a) Factors associated with prescription of OAC alone (VKAs plus NOACs) | ||||
| Zone 1: West (Belgium, Denmark, Netherlands, Norway) | ||||
| Age (%) (ref. = ≤65 years) | 1.2543 | 0.9127 | 1.7236 | 0.1621 |
| Female gender (%) | 1.0431 | 0.7489 | 1.4529 | 0.8029 |
| Valvular heart disease (%) | 0.8133 | 0.5828 | 1.1351 | 0.2241 |
| Previous TIA/Stroke (%) | 1.0740 | 0.6258 | 1.8432 | 0.7955 |
| Chronic heart failure (%) | 0.7526 | 0.5098 | 1.1109 | 0.1518 |
| Hypertension (%) | 1.4227 | 1.0392 | 1.9477 | 0.0275 |
| CAD (%) | 0.2021 | 0.1374 | 0.2974 | <0.0001 |
| PAD (%) | 0.5755 | 0.2480 | 1.3352 | 0.1931 |
| Diabetes mellitus (%) | 0.9838 | 0.6376 | 1.5180 | 0.9413 |
| Type of AF (%) (ref. = first detected) | 0.7517 | 0.5238 | 1.0787 | 0.1208 |
| Heart rhythm strategy (%) (ref. = others) | 0.8059 | 0.5523 | 1.1759 | 0.2625 |
| Zone 2: East (Poland, Romania) | ||||
| Age (%) (ref. = ≤65 years) | 0.7108 | 0.5692 | 0.8877 | 0.0026 |
| Female gender (%) | 1.3266 | 1.0661 | 1.6506 | 0.0112 |
| Valvular heart disease (%) | 0.7015 | 0.5480 | 0.8980 | 0.0048 |
| Previous TIA/Stroke (%) | 1.4155 | 0.9494 | 2.1105 | 0.0869 |
| Chronic heart failure (%) | 0.7054 | 0.5549 | 0.8967 | 0.0043 |
| Hypertension (%) | 0.9859 | 0.7620 | 1.2754 | 0.9137 |
| CAD (%) | 0.2305 | 0.1791 | 0.2967 | <0.0001 |
| PAD (%) | 0.4664 | 0.3256 | 0.6683 | <0.0001 |
| Diabetes mellitus (%) | 0.8378 | 0.6489 | 1.0816 | 0.1742 |
| Type of AF (%) (ref. = first detected) | 1.1050 | 0.8703 | 1.4030 | 0.4124 |
| Heart rhythm strategy (%) (ref. = others) | 1.7157 | 1.1635 | 2.5298 | 0.0060 |
| Zone 3: South (Greece, Italy, Portugal) | ||||
| Age (%) (ref. = ≤65 years) | 1.0803 | 0.8253 | 1.4141 | 0.5739 |
| Female gender (%) | 1.3252 | 1.0300 | 1.7050 | 0.0284 |
| Valvular heart disease (%) | 0.7915 | 0.6034 | 1.0384 | 0.0912 |
| Previous TIA/Stroke (%) | 1.1948 | 0.7986 | 1.7875 | 0.3862 |
| Chronic heart failure (%) | 0.8793 | 0.6779 | 1.1406 | 0.3324 |
| Hypertension (%) | 1.0721 | 0.8136 | 1.4127 | 0.6209 |
| CAD (%) | 0.1332 | 0.0973 | 0.1825 | <0.0001 |
| PAD (%) | 0.7466 | 0.5322 | 1.0471 | 0.0897 |
| Diabetes mellitus (%) | 0.6638 | 0.4901 | 0.8990 | 0.0079 |
| Type of AF (%) (ref. = first detected) | 0.7637 | 0.5914 | 0.9862 | 0.0386 |
| Heart rhythm strategy (%) (ref. = others) | 0.8203 | 0.5677 | 1.1852 | 0.2908 |
| (b) Factors associated with prescription of NOACs only (dabigatran or rivaroxaban) | ||||
| Zone 1: West (Belgium, Denmark, Netherlands, Norway) | ||||
| Age (%) (ref. = ≤65 years) | 1.1037 | 0.7318 | 1.6645 | 0.6378 |
| Female gender (%) | 1.1667 | 0.7719 | 1.7634 | 0.4643 |
| Valvular heart disease (%) | 1.1315 | 0.7510 | 1.7048 | 0.5545 |
| Previous TIA/stroke (%) | 1.4000 | 0.7531 | 2.6026 | 0.2856 |
| Chronic heart failure (%) | 0.8531 | 0.5100 | 1.4271 | 0.5448 |
| Hypertension (%) | 1.2345 | 0.8212 | 1.8558 | 0.3106 |
| CAD (%) | 0.6152 | 0.3569 | 1.0606 | 0.0782 |
| PAD (%) | 1.3116 | 0.4358 | 3.9469 | 0.5475 |
| Diabetes mellitus (%) | 1.1209 | 0.6552 | 1.9175 | 0.6769 |
| Type of AF (%) (ref. = first detected) | 1.5918 | 1.0264 | 2.4685 | 0.0367 |
| Heart rhythm strategy (%) (ref. = others) | 0.7400 | 0.4370 | 1.2532 | 0.2612 |
| Zone 2: East (Poland, Romania) | ||||
| Age (%) (ref. = ≤65 years) | 0.9828 | 0.6464 | 1.4941 | 0.9352 |
| Female gender (%) | 1.1136 | 0.7375 | 1.6817 | 0.6087 |
| Reason for visit (%) (ref. = atrial fibrillation) | 1.3128 | 0.8640 | 1.9947 | 0.2012 |
| Valvular heart disease (%) | 0.6629 | 0.4281 | 1.0266 | 0.0639 |
| Previous TIA/stroke (%) | 2.1192 | 1.1755 | 3.8206 | 0.0108 |
| Chronic heart failure (%) | 0.7198 | 0.4681 | 1.1069 | 0.1328 |
| Hypertension (%) | 1.2601 | 0.7500 | 2.1170 | 0.3816 |
| CAD (%) | 0.5051 | 0.3119 | 0.8182 | 0.0048 |
| PAD (%) | 0.5947 | 0.2700 | 1.3096 | 0.1922 |
| Diabetes mellitus (%) | 0.9724 | 0.5983 | 1.5803 | 0.9099 |
| Type of AF (%) (ref. = first detected) | 1.7463 | 1.1453 | 2.6627 | 0.0089 |
| Heart rhythm strategy (%) (ref. = others) | 2.0713 | 1.1689 | 3.6705 | 0.0110 |
| Zone 3: South (Greece, Italy, Portugal) | ||||
| Age (%) (ref. = ≤65 years) | 0.3531 | 0.1993 | 0.6255 | 0.0002 |
| Female gender (%) | 0.9532 | 0.5310 | 1.7112 | 0.8725 |
| Valvular heart disease (%) | 0.2875 | 0.1543 | 0.5357 | <0.0001 |
| Previous TIA/Stroke (%) | 1.1578 | 0.4818 | 2.7825 | 0.7431 |
| Chronic heart failure (%) | 0.5697 | 0.2836 | 1.1444 | 0.1096 |
| Hypertension (%) | 0.6391 | 0.3527 | 1.1582 | 0.1371 |
| CAD (%) | 0.3281 | 0.1265 | 0.8507 | 0.0161 |
| PAD (%) | 0.3478 | 0.1068 | 1.1324 | 0.0668 |
| Diabetes mellitus (%) | 0.5336 | 0.2240 | 1.2710 | 0.1498 |
| Type of AF (%) (ref. = first detected) | 0.5099 | 0.2579 | 1.0081 | 0.0489 |
| Heart rhythm strategy (%) (ref. = others) | 2.3443 | 1.1914 | 4.6130 | 0.0113 |
| (c) Factors associated with prescription of antiplatelet drugs alone | ||||
| Zone 1: West (Belgium, Denmark, Netherlands, Norway) | ||||
| Age (%) (ref. = ≤65 years) | 0.5795 | 0.3279 | 1.0241 | 0.0578 |
| Female gender (%) | 1.1900 | 0.6606 | 2.1435 | 0.5620 |
| Valvular heart disease (%) | 1.3490 | 0.7174 | 2.5365 | 0.3513 |
| Previous TIA/stroke (%) | 0.5863 | 0.1779 | 1.9329 | 0.6160 |
| Chronic heart failure (%) | 1.1033 | 0.5309 | 2.2928 | 0.7922 |
| Hypertension (%) | 0.4606 | 0.2575 | 0.8239 | 0.0077 |
| CAD (%) | 2.8085 | 1.4557 | 5.4186 | 0.0014 |
| PAD (%) | 0.5502 | 0.0726 | 4.1704 | >0.9999 |
| Diabetes mellitus (%) | 0.7279 | 0.3033 | 1.7471 | 0.4755 |
| Type of AF (%) (ref. = first detected) | 1.0394 | 0.5318 | 2.0314 | 0.9100 |
| Heart rhythm strategy (%) (ref. = rhythm control only) | 1.5215 | 0.8009 | 2.8903 | 0.1971 |
| Zone 2: East (Poland, Romania) | ||||
| Age (%) (ref. = ≤65 years) | 1.8291 | 1.3151 | 2.5439 | 0.0003 |
| Female gender (%) | 1.2384 | 0.9149 | 1.6762 | 0.1658 |
| Valvular heart disease (%) | 0.8359 | 0.5994 | 1.1657 | 0.2903 |
| Previous TIA/stroke (%) | 0.6723 | 0.3615 | 1.2500 | 0.2068 |
| Chronic heart failure (%) | 0.9589 | 0.6901 | 1.3324 | 0.8026 |
| Hypertension (%) | 0.9265 | 0.6502 | 1.3203 | 0.6727 |
| CAD (%) | 1.7368 | 1.2489 | 2.4152 | 0.0009 |
| PAD (%) | 0.6608 | 0.3838 | 1.1375 | 0.1325 |
| Diabetes mellitus (%) | 0.6988 | 0.4766 | 1.0248 | 0.0655 |
| Type of AF (%) (ref. = first detected) | 1.7191 | 1.2557 | 2.3535 | 0.0007 |
| Heart rhythm strategy (%) (ref. = rhythm control only) | 1.2883 | 0.7898 | 2.1014 | 0.3092 |
| Zone 3: SOUTH (Greece, Italy, Portugal) | ||||
| Age (%) (ref. = ≤65 years) | 0.6352 | 0.4434 | 0.9097 | 0.0128 |
| Female gender (%) | 1.1078 | 0.7814 | 1.5706 | 0.5652 |
| Reason for visit (%) (ref. = AF) | 1.0985 | 0.7772 | 1.5527 | 0.5946 |
| Valvular heart disease (%) | 0.8239 | 0.5672 | 1.1967 | 0.3087 |
| Previous TIA/stroke (%) | 0.4845 | 0.2395 | 0.9802 | 0.0398 |
| Chronic heart failure (%) | 0.2989 | 0.1887 | 0.4733 | <0.0001 |
| Hypertension (%) | 1.0359 | 0.7011 | 1.5305 | 0.8594 |
| CAD (%) | 1.1160 | 0.7569 | 1.6455 | 0.5795 |
| PAD (%) | 0.9819 | 0.6077 | 1.5865 | 0.9406 |
| Diabetes mellitus (%) | 0.7009 | 0.4403 | 1.1157 | 0.1324 |
| Type of AF (%) (ref. = first detected) | 1.1999 | 0.8425 | 1.7091 | 0.3120 |
| Heart rhythm strategy (%) (ref. = rhythm control only) | 1.6394 | 1.0312 | 2.6063 | 0.0351 |
| (d) Factors associated with prescription of combination OAC + antiplatelet drugs | ||||
| Zone 1: West (Belgium, Denmark, Netherlands, Norway) | ||||
| Age (%) (ref. = ≤65 years) | 1.9356 | 1.1867 | 3.1572 | 0.0073 |
| Female gender (%) | 0.8845 | 0.5546 | 1.4106 | 0.6061 |
| Valvular heart disease (%) | 1.4107 | 0.9073 | 2.1933 | 0.1253 |
| Previous TIA/stroke (%) | 1.1769 | 0.5810 | 2.3840 | 0.6507 |
| Chronic heart failure (%) | 1.5397 | 0.9383 | 2.5264 | 0.0859 |
| Hypertension (%) | 1.9886 | 1.2393 | 3.1909 | 0.0039 |
| CAD (%) | 6.4000 | 3.9741 | 10.3067 | <0.0001 |
| PAD (%) | 4.6085 | 1.9295 | 11.0075 | 0.0014 |
| Diabetes mellitus (%) | 1.5117 | 0.8742 | 2.6141 | 0.1369 |
| Type of AF (%) (ref. = first detected) | 0.9132 | 0.5397 | 1.5454 | 0.7352 |
| Heart rhythm strategy (%) (ref. = rhythm control only) | 1.1581 | 0.6877 | 1.9503 | 0.5807 |
| Zone 2: East (Poland, Romania) | ||||
| Age (%) (ref. = ≤65 years) | 1.3314 | 1.0247 | 1.7298 | 0.0318 |
| Female gender (%) | 0.6946 | 0.5370 | 0.8984 | 0.0054 |
| Valvular heart disease (%) | 2.0471 | 1.4914 | 2.8098 | <0.0001 |
| Previous TIA/stroke (%) | 0.9922 | 0.6260 | 1.5724 | 0.9733 |
| Chronic heart failure (%) | 1.8819 | 1.3928 | 2.5427 | <0.0001 |
| Hypertension (%) | 1.4546 | 1.0589 | 1.9983 | 0.0202 |
| CAD (%) | 5.1507 | 3.8039 | 6.9744 | <0.0001 |
| PAD (%) | 2.4907 | 1.7426 | 3.5599 | <0.0001 |
| Diabetes mellitus (%) | 1.6023 | 1.2069 | 2.1270 | 0.0010 |
| Type of AF (%) (ref. = first detected) | 0.7389 | 0.5541 | 0.9854 | 0.0390 |
| Heart rhythm strategy (%) (ref. = rhythm control only) | 0.4464 | 0.2595 | 0.7677 | 0.0028 |
| Zone 3: South (Greece, Italy, Portugal) | ||||
| Age (%) (ref. = ≤65 years) | 2.5456 | 1.6490 | 3.9297 | <0.0001 |
| Female gender (%) | 0.4779 | 0.3319 | 0.6881 | <0.0001 |
| Valvular heart disease (%) | 1.7361 | 1.1890 | 2.5350 | 0.0040 |
| Previous TIA/stroke (%) | 1.6033 | 0.9988 | 2.5739 | 0.0489 |
| Chronic heart failure (%) | 2.5786 | 1.8496 | 3.5949 | <0.0001 |
| Hypertension (%) | 1.7333 | 1.1545 | 2.6023 | 0.0074 |
| CAD (%) | 19.7886 | 12.7869 | 30.6241 | <0.0001 |
| PAD (%) | 2.1623 | 1.4587 | 3.2054 | <0.0001 |
| Diabetes mellitus (%) | 2.0772 | 1.4446 | 2.9868 | <0.0001 |
| Type of AF (%) (ref. = first detected) | 0.9548 | 0.6786 | 1.3433 | 0.7905 |
| Heart rhythm strategy (%) (ref. = rhythm control only) | 0.5602 | 0.3137 | 1.0005 | 0.0475 |
CAD, coronary artery disease; PAD, peripheral vascular disease.
Determinants of NOAC use in the East were previous TIA/stroke (P = 0.0108), no coronary artery disease (P = 0.0048), type of AF (P = 0.0089), and non-rhythm control (P = 0.0110). In the South, NOAC use was more common with younger age (P = 0.0002), non-valvular heart disease (P < 0.0001), no coronary artery disease (P = 0.0161), type of AF (P = 0.0489), and non-rhythm control (P = 0.0113) (Table 2).
Determinants of antiplatelet therapy use in West countries were coronary artery disease (P = 0.0014) and lack of hypertension (P = 0.0077). In East countries, older age (P = 0.0003), coronary artery disease (P = 0.0009), and type of AF (P = 0.0007) determined antiplatelet therapy use. In the South, significant factors were younger age (P = 0.0128), no previous stroke/TIA (P = 0.0398) or heart failure (P < 0.0001), and non-rhythm control (P = 0.0351) (Table 2).
Determinants of combination OAC plus antiplatelet therapy in the West were older age (P = 0.0073), hypertension (P = 0.0039), coronary artery disease (P < 0.0001), and peripheral vascular disease (P = 0.0014). In the East, combination therapy was more common in older patients (P = 0.0318), coronary artery disease (P < 0.0001), and peripheral artery disease (P < 0.0001). In the East countries, combination therapy was more common with older age (P = 0.0318), males (P = 0.0054), valvular heart disease (P < 0.0001), chronic heart failure (P < 0.0001), hypertension (P = 0.0202), coronary artery disease (P < 0.0001), peripheral artery disease (P < 0.0001), diabetes (P = 0.0010), type of AF (P = 0.0390), and non-rhythm control (P = 0.0028). In the South, determinants of combination therapy were older age (P < 0.0001), males (P < 0.0001), valvular heart disease (P = 0.004), previous stroke/TIA (P = 0.0489), chronic heart failure (P < 0.0001), hypertension (P = 0.0074), coronary artery disease (P < 0.0001) and peripheral artery disease (P < 0.0001), diabetes (P < 0.0001), and non-rhythm control (P = 0.0475) (Table 2).
Prevalence of stroke risk factors by region
Apart from age and female sex, the commonest stroke risk factors in the West countries were hypertension (57.1%) and heart failure (21.7%), and in the South countries (73.1 and 37.1%, respectively). In the East, hypertension (76.8%), heart failure (69.6%), and diabetes (23.9%) were the most common (Table 3).
Prevalence of stroke risk factors in patients according to the ESC guidelines
| Whole cohort | OAC alone | |||
|---|---|---|---|---|
| N | % | N | % | |
| Zone 1: West (Belgium, Denmark, Netherlands, Norway) | ||||
| Heart failure (%) | 152 | 21.7 | 103 | 20.3 |
| Hypertension (%) | 436 | 57.1 | 323 | 59.6 |
| Age (%): | ||||
| <65 | 273 | 35.5 | 186 | 34.0 |
| 65–74 | 286 | 37.2 | 216 | 39.5 |
| ≥75 | 210 | 27.3 | 145 | 26.5 |
| Diabetes mellitus (%) | 117 | 15.2 | 83 | 15.2 |
| Previous TIA (%) | 33 | 4.3 | 28 | 5.2 |
| Previous stroke (%) | 43 | 5.6 | 28 | 5.1 |
| Ischaemic thromboembolic complications (%) | 89 | 11.6 | 62 | 11.4 |
| PAD (%) | 23 | 3.5 | 13 | 2.9 |
| Myocardial infarction (MI) (%) | 81 | 12.6 | 29 | 6.2 |
| Female (%) | 258 | 33.6 | 185 | 33.8 |
| Zone 2: East (Poland, Romania) | ||||
| Heart failure (%) | 892 | 69.6 | 434 | 66.1 |
| Hypertension (%) | 1000 | 76.8 | 513 | 76.7 |
| Age (%): | ||||
| <65 | 482 | 36.9 | 275 | 41.0 |
| 65–74 | 441 | 33.8 | 226 | 33.7 |
| ≥75 | 383 | 29.3 | 170 | 25.3 |
| Diabetes mellitus (%) | 310 | 23.9 | 149 | 22.4 |
| Previous TIA (%) | 31 | 2.4 | 17 | 2.6 |
| Previous stroke (%) | 96 | 7.4 | 57 | 8.5 |
| Ischaemic thromboembolic complications (%) | 164 | 12.7 | 94 | 14.1 |
| PAD (%) | 146 | 11.4 | 51 | 7.7 |
| Myocardial infarction (MI) (%) | 172 | 15.5 | 41 | 7.4 |
| Female (%) | 594 | 45.5 | 328 | 48.9 |
| Zone 3: South (Greece, Italy, Portugal) | ||||
| Heart failure (%) | 367 | 37.1 | 202 | 35.8 |
| Hypertension (%) | 758 | 73.1 | 426 | 73.7 |
| Age (%) | ||||
| <65 | 275 | 26.3 | 152 | 26.1 |
| 65–74 | 311 | 29.8 | 189 | 32.4 |
| ≥75 | 458 | 43.9 | 242 | 41.5 |
| Diabetes mellitus (%) | 211 | 20.3 | 101 | 17.4 |
| Previous TIA (%) | 62 | 6.0 | 36 | 6.2 |
| Previous stroke (%) | 56 | 5.4 | 35 | 6.0 |
| Ischaemic thromboembolic complications (%) | 152 | 14.6 | 94 | 16.2 |
| PAD (%) | 159 | 15.3 | 79 | 13.6 |
| Myocardial infarction (MI) (%) | 186 | 19.8 | 43 | 8.1 |
| Female (%) | 408 | 39.1 | 245 | 42.0 |
PAD, peripheral vascular disease.
Antithrombotic therapy use with cardioversion and ablation
Among those patients in whom PCV was performed, OAC (or OAC plus antiplatelet therapy) was used in 80.6% in the West countries, compared with 71.6% in the East and 50.0% in the South countries (Table 4).
Antithrombotic prescription at inclusion and at discharge when PCV was either performed at the time of the survey or planned at discharge
| Performed (n = 93) | Planned (n = 5) | |||||||
|---|---|---|---|---|---|---|---|---|
| Inclusion | Discharge | Inclusion | Discharge | |||||
| N | % | N | % | N | % | N | % | |
| Zone 1: West (Belgium, Denmark, Netherlands, Norway) | ||||||||
| None and unknown | 20 | 21.5 | 8 | 8.6 | 0 | 0.0 | 0 | 0.0 |
| OAC alone | 49 | 52.7 | 59 | 63.4 | 4 | 80.0 | 5 | 100.0 |
| Antiplatelet alone | 14 | 15.1 | 6 | 6.5 | 1 | 20.0 | 0 | 0.0 |
| OAC + antiplatelet | 8 | 8.6 | 16 | 17.2 | 0 | 0.0 | 0 | 0.0 |
| Othersa | 2 | 2.1 | 4 | 4.3 | 0 | 0.0 | 0 | 0.0 |
| Total | 93 | 100.0 | 93 | 100.0 | 5 | 100.0 | 5 | 100.0 |
| Performed (n = 447) | Planned (n = 6) | |||||||
| Zone 2: East (Poland, Romania) | ||||||||
| None and unknown | 188 | 42.0 | 25 | 5.6 | 1 | 16.6 | 0 | 0.0 |
| OAC alone | 86 | 19.2 | 145 | 32.4 | 3 | 50.0 | 3 | 50.0 |
| Antiplatelet alone | 125 | 28.0 | 88 | 19.7 | 1 | 16.7 | 0 | 0.0 |
| OAC + antiplatelet | 41 | 9.2 | 175 | 39.2 | 1 | 16.7 | 2 | 33.3 |
| Othersa | 7 | 1.6 | 14 | 3.1 | 0 | 0.0 | 1 | 16.7 |
| Total | 447 | 100.0 | 447 | 100.0 | 6 | 100.0 | 6 | 100.0 |
| Performed (n = 210) | Planned (n = 2) | |||||||
| Zone 3: South (Greece, Italy, Portugal) | ||||||||
| None and unknown | 78 | 37.1 | 35 | 16.7 | 1 | 50.0 | 0 | 0.0 |
| OAC alone | 53 | 25.2 | 76 | 36.2 | 1 | 50.0 | 1 | 50.0 |
| Antiplatelet alone | 51 | 24.3 | 53 | 25.2 | 0 | 0.0 | 0 | 0.0 |
| OAC + antiplatelet | 17 | 8.1 | 29 | 13.8 | 0 | 0.0 | 1 | 50.0 |
| Othersa | 11 | 5.2 | 17 | 8.1 | 0 | 0.0 | 0 | 0.0 |
| Total | 210 | 100.0 | 210 | 100.0 | 2 | 100.0 | 2 | 100.0 |
aOthers include: OAC + Other ATT, AP + Other ATT, OAC + AP + Other ATT and Other ATT (fondaparinux, LMW heparin, UF heparin, other).
For ECV, the corresponding figures were 87.0, 88.2, and 81.6%, respectively (Table 5). For the patients undergoing ablation, the corresponding figures by region were 94.2, 76.2, and 87.9%, respectively (Table 6).
Antithrombotic prescription at inclusion and at discharge when ECV were either performed at the time of the survey or planned at discharge
| Performed (n = 253) | Planned (n = 48) | |||||||
|---|---|---|---|---|---|---|---|---|
| Inclusion | Discharge | Inclusion | Discharge | |||||
| N | % | N | % | N | % | N | % | |
| Zone 1: West (Belgium, Denmark, Netherlands, Norway) | ||||||||
| None and Unknown | 20 | 7.9 | 9 | 3.5 | 13 | 27.1 | 1 | 2.1 |
| OAC alone | 183 | 72.3 | 188 | 74.3 | 20 | 41.7 | 37 | 77.1 |
| Antiplatelet alone | 15 | 5.9 | 11 | 4.4 | 10 | 20.8 | 0 | 0.0 |
| OAC + antiplatelet | 31 | 12.3 | 32 | 12.7 | 4 | 8.3 | 5 | 10.4 |
| Othersa | 4 | 1.6 | 13 | 5.1 | 1 | 2.1 | 5 | 10.4 |
| Total | 253 | 100.0 | 253 | 100.0 | 48 | 100.0 | 48 | 100.0 |
| Performed (n = 153) | Planned (n = 19) | |||||||
| Zone 2: East (Poland, Romania) | ||||||||
| None and Unknown | 16 | 10.4 | 3 | 2.0 | 6 | 31.6 | 0 | 0.0 |
| OAC alone | 100 | 65.4 | 109 | 71.2 | 7 | 36.8 | 17 | 89.4 |
| Antiplatelet alone | 12 | 7.8 | 8 | 5.2 | 5 | 26.3 | 0 | 0.0 |
| OAC + antiplatelet | 24 | 15.7 | 26 | 17.0 | 1 | 5.3 | 1 | 5.3 |
| Othersa | 1 | 0.7 | 7 | 4.6 | 0 | 0.0 | 1 | 5.3 |
| Total | 153 | 100.0 | 153 | 100.0 | 19 | 100.0 | 19 | 100.0 |
| Performed (n = 206) | Planned (n = 24) | |||||||
| Zone 3: South (Greece, Italy, Portugal) | ||||||||
| None and Unknown | 28 | 13.6 | 11 | 5.3 | 4 | 16.7 | 0 | 0.0 |
| OAC alone | 123 | 59.7 | 133 | 64.6 | 14 | 58.3 | 20 | 83.3 |
| Antiplatelet Alone | 18 | 8.7 | 18 | 8.7 | 4 | 16.7 | 0 | 0.0 |
| OAC + antiplatelet | 30 | 14.6 | 35 | 17.0 | 1 | 4.2 | 2 | 8.3 |
| Othersa | 7 | 3.4 | 9 | 4.4 | 1 | 4.2 | 2 | 8.3 |
| Total | 206 | 100.0 | 206 | 100.0 | 24 | 100.0 | 24 | 100.0 |
aOthers include: OAC + other ATT, AP + other ATT, OAC + AP + other ATT and other ATT (fondaparinux, LMWheparin, UFheparin, other).
Antithrombotic prescription at inclusion and at discharge when the following catheter ablation was either performed at the time of the survey or planned at discharge
| Performed (n = 86) | Planned (n = 22) | |||||||
|---|---|---|---|---|---|---|---|---|
| Inclusion | Discharge | Inclusion | Discharge | |||||
| N | % | N | % | N | % | N | % | |
| Zone 1: West (Belgium, Denmark, Netherlands, Norway) | ||||||||
| None and unknown | 0 | 0.0 | 3 | 3.4 | 2 | 9.1 | 0 | 0.0 |
| OAC alone | 76 | 88.4 | 75 | 87.2 | 16 | 72.7 | 18 | 81.8 |
| Antiplatelet alone | 2 | 2.3 | 1 | 1.2 | 0 | 0.0 | 0 | 0.0 |
| OAC + antiplatelet | 7 | 8.1 | 6 | 7.0 | 2 | 9.1 | 2 | 9.1 |
| Othersa | 1 | 1.2 | 1 | 1.2 | 2 | 9.1 | 2 | 9.1 |
| Total | 86 | 100.0 | 86 | 100.0 | 22 | 100.0 | 22 | 100.0 |
| Performed (n = 42) | Planned (n = 12) | |||||||
| Zone 2: East (Poland, Romania) | ||||||||
| None and unknown | 1 | 2.4 | 0 | 0.0 | 1 | 8.3 | 0 | 0.0 |
| OAC alone | 34 | 81.0 | 30 | 71.4 | 7 | 58.3 | 2 | 16.7 |
| Antiplatelet alone | 1 | 2.4 | 3 | 7.1 | 0 | 0.0 | 1 | 8.3 |
| OAC + antiplatelet | 1 | 2.4 | 2 | 4.8 | 3 | 25.0 | 3 | 25.0 |
| Othersa | 5 | 11.8 | 7 | 16.7 | 1 | 8.4 | 6 | 50.0 |
| Total | 42 | 100.0 | 42 | 100.0 | 12 | 100.0 | 12 | 100.0 |
| Performed (n = 58) | Planned (n = 11) | |||||||
| Zone 3: South (Greece, Italy, Portugal) | ||||||||
| None and unknown | 2 | 3.5 | 2 | 3.5 | 2 | 18.2 | 2 | 18.2 |
| OAC alone | 49 | 84.5 | 50 | 86.2 | 7 | 63.6 | 8 | 72.7 |
| Antiplatelet alone | 7 | 12.1 | 5 | 8.6 | 2 | 18.2 | 1 | 9.1 |
| OAC + antiplatelet | 0 | 0.0 | 1 | 1.7 | 0 | 0.0 | 0 | 0.0 |
| Othersa | 0 | 0.0 | 0 | 0.0 | 0 | 0.0 | 0 | 0.0 |
| Total | 58 | 100.0 | 58 | 100.0 | 11 | 100.0 | 11 | 100.0 |
aOthers include: OAC + other ATT, AP + other ATT, OAC + AP + other ATT and other ATT (fondaparinux, LMW heparin, UF heparin, other).
Characteristics of patients undergoing cardioversion and ablation
The median ages of those undergoing PCV, ECV, and ablation in West countries were 69, 67, and 63 years, respectively. In East countries, the corresponding figures were 69, 60, and 59, respectively. In the South, median ages were 69, 70, and 59.5, respectively.
In West countries, duration of AF > 7 days among those undergoing PCV, ECV, and ablation were 17.2, 39.9, and 20.9%. The corresponding percentages in East countries were 38.9, 64.7, and 40.5%, respectively. In the South, the corresponding figures were 9.1, 46.6, and 22.4%, respectively (Supplementary material online, Table S1).
The proportions with a CHA2DS2-VASc score of ≥2 in West countries were 68.8, 62.1, and 57.0%, respectively. In East countries, the corresponding figures were 90.1, 74.5, and 35.7%, while in South countries, 72.4, 76.2, and 44.8%, respectively.
Discussion
In this analysis from the EORP-AF Pilot registry, we show regional differences in patient characteristics, treatment options, and management options among European cardiologists. In particular, stroke risk and application of antithrombotic therapy varied, as did patient selection for rhythm control interventions. This is despite publication of new guidelines from the ESC in 2010, which was followed by a focused update in 2012.4,5
As expected, heart failure was the commonest cause for hospitalization in all regions. Chronic heart failure was particularly common in East countries, and the combination of AF and heart failure (especially those requiring hospitalization) leads to a poor prognosis.12 Our dataset does not differentiate between heart failure with reduced or preserved ejection fraction (HFrEF and HFpEF, respectively) but recent studies suggest that irrespective of ejection fraction, decompensated heart failure is associated with more adverse outcomes in the presence of AF.13–15
Differences in associated comorbidity were evident. Of note, hypertension, peripheral artery disease and chronic kidney disease were more common in South countries, where patients were significantly older. This is in keeping with the high disease burden associated with hypertension in South countries.16 These comorbidities contribute to increased cardiovascular risk associated with AF, particularly from thromboembolism.17
Stroke risk as quantified by a CHA2DS2-VASc score of ≥2 was generally highest in East and South countries. OAC use was generally high (>72%) but antiplatelet therapy is still used in ∼15%. Indeed, differences in determinants of antithrombotic therapy use were evident, particularly where antiplatelet therapy was used alone or in combination with OAC. Coronary artery disease was a very strong determinant of antiplatelet therapy use, whether alone or in combination with OAC. Combination of OAC plus antiplatelet therapy use was also more common with older age, male sex, peripheral artery disease and especially in the South, where concomitant stroke risk factors were evident. This is despite evidence that in patients with stable vascular disease, combination OAC plus antiplatelet therapy does not confer added advantage in reducing stroke and thromboembolism, but substantially increases the risk of major bleeding, especially intracranial bleeding.18–20
OAC in patients selected for rhythm control was highest in West countries, compared with only 50% use among those who had undergone PCV in South countries. This is surprising, as cardioversion of patients with AF of >48 h duration—whether electrical or pharmacological—should require appropriate thromboprophylaxis.4 This is consistent with a recent registry (RHYTHM-AF) showing substantial variation in management, and undertreatment with antithrombotic therapy in patients undergoing cardioversion.11,21
Interestingly, patients from West countries undergoing ECV were younger, while AF duration in South countries of patients undergoing rhythm control was usually <7 days. Such patients probably have the better chance of a successful outcome. Patients from East countries undergoing pharmacological or ECV were generally at higher stroke risk (as evident by the proportion with a CHA2DS2-VASc score of ≥2), while those undergoing ablation in East countries had the lowest stroke risk (CHA2DS2-VASc score of ≥2 in only 35.7%). The high stroke risk profile in those undergoing cardioversion is perhaps surprising, as multiple comorbidities (reflected by a high CHA2DS2-VASc score) may reduce the chance of successful outcomes with rhythm control and the long-term maintenance of sinus rhythm.22 The best evidence for ablation success is in those with few comorbidities, and practice in East countries reflects this, while West and South countries perform ablation on high stroke risk patients.23 Current guidelines recommend that OAC should not be stopped post-ablation in patients with a CHA2DS2-VASc score of ≥2.4,23
Limitations
This pilot registry is limited by its dependence upon data obtained from the cardiologists in nine ESC member countries only, and we recognize that in many healthcare systems, AF patients are often looked after by non-cardiologists. Nonetheless, this analysis provides evidence for regional differences in patient characteristics, treatment options and management options. Our division into three regions (West, East, and South) is also an artificial division of convenience, and inter-country differences would also be evident. Nonetheless, it is recognized that geographic variations can lack statistical power, and are at besthypothesis-generating.24 Random effects may be of importance, for example, higher comorbidities in ‘East’ countries which could plausibly lead to less rhythm control strategies in these countries. Also, an analysis by country would be interesting but we would be underpowered due to the modest numbers per country if such an analysis was made. Indeed, some of the management practices may also reflect the choice of participating centres, but the EORP-AF protocol includes consecutive patients and obtains a mix of electrophysiology- and non-electrophysiology-based hospitals to reflect representative clinical practice in the various countries. Nonetheless, we have avoided comparisons of management in relation to the type of clinical practice (e.g. office vs. hospital-based cardiologists) in one country vs. another, as we may not be comparing like with like; however, we have tried to minimize heterogeneity by focusing on the subgroup of n = 902 hospital-admitted patients in whom no rhythm control was performed or planned at initial presentation. The relatively small numbers in some subgroups, for example, in determining antithrombotic therapy use, are a limitation and it remains possible that with larger numbers more homogeneity may be evident. We also recognize that regional descriptions of the rhythm control patients are based on small numbers. Finally, the present analysis focuses on baseline data, and outcome data from the EORP-AF Pilot registry follow-up phase will become available in due course. A more comprehensive assessment in all member ESC countries would be obtained from the EORP-AF general long-term registry.
Conclusions
From the systematic collection of contemporary data regarding the management and treatment of AF in nine participating member ESC countries, we provide hypothesis-generating observational insights into regional management practices in Europe with regard to patient characteristics and treatment options.
Supplementary material
Supplementary material is available at Europace online.
EORP sponsors
At the time of the registry, the following companies are supporting the EURObservational Research programme: GOLD: Abott Vascular, Bayer Pharma, Bristol Myers Squibb (BMS), Pfizer, Boehringer Ingelheim, Daiichi Sankyo Europe, Menarini international Operations, Novartis Pharma, Sanofi-Aventis, Servier International. SILVER: Amgen. BRONZE: Boston Scientific International, Merck & Co. (MSD).
Conflict of interest: G.Y.H.L.—consultant for Bayer, Medtronic, Sanofi, BMS/Pfizer, Daiichi-Sankyo, and Boehringer Ingelheim, and has been a speaker for Bayer, BMS/Pfizer, Boehringer Ingelheim, Daiichi-Sankyo and Medtronic. L.H.R.—speaker bureaus for Bayer, BMS/Pfizer, Janssen Pharmaceuticals, Takeda, Roche Diagnostics, and Boehringer Ingelheim. G.B.—received small speaker's fee from Medtronic Inc and Boston Scientific. M.M.O.—consultant for Medtronic, Sorin, and Biotronik, and speaker bureau for Boston Scientific and St Jude Medical. L.T.: consultant and Speakers bureau member for Servier; Committee Member for Servier, Medtronic, St Jude Medical, CVIE Therapeutics, Boston Scientific, Vifor Pharma, Cardiorentis. Other authors—none declared in relation to this manuscript.
