


Abstract
Guideline-adherent therapy for stroke prevention in atrial fibrillation has been associated with better outcomes, in terms of thromboembolism (TE) and bleeding.
In this report from the EuroObservational Research Programme-Atrial Fibrillation (EORP-AF) Pilot General Registry, we describe the associated baseline features of ‘high risk’ AF patients in relation to guideline-adherent antithrombotic treatment, i.e. whether they were adherent, over-treated, or under-treated based on the 2012 European Society of Cardiology (ESC) guidelines. Secondly, we assessed the predictors of guideline-adherent antithrombotic treatment. Thirdly, we evaluated outcomes for all-cause mortality, TE, bleeding, and the composite endpoint of ‘any TE, cardiovascular death or bleeding’ in relation to whether they were ESC guideline-adherent treatment. From the EORP-AF cohort, the follow-up dataset of 2634 subjects was used to assess the impact of guideline adherence or non-adherence. Of these, 1602 (60.6%) were guideline adherent, whilst 458 (17.3%) were under-treated, and 574 (21.7%) were over-treated. Non-guideline-adherent treatment can be related to region of Europe as well as associated clinical features, but not age, AF type, symptoms, or echocardiography indices. Over-treatment per se was associated with symptoms, using the EHRA score, as well as other comorbidities. Guideline-adherent antithrombotic management based on the ESC guidelines is associated with significantly better outcomes. Specifically, the endpoint of ‘all cause death and any TE’ is increased by >60% by undertreatment [hazard ratio (HR) 1.679 (95% confidence interval (CI) 1.202–2.347)] or over-treatment [HR 1.622 (95% CI 1.173–2.23)]. For the composite endpoint of ‘cardiovascular death, any TE or bleeding’, over-treatment increased risk by >70% [HR 1.722 (95% CI 1.200–2.470)].
Even in this cohort with high overall rates of oral anticoagulation use, ESC guideline-adherent antithrombotic management is associated with significantly better outcomes, including those related to mortality and TE, as well as the composite endpoint of ‘cardiovascular death, any TE or bleeding’. These contemporary observations emphasize the importance of guideline implementation, and adherence to the 2012 ESC guidelines for stroke prevention in AF.
Introduction
Whilst the risk of stroke is increased in atrial fibrillation (AF), the risk is not homogeneous and is dependent upon stroke risk factors. Rather than a didactic use of risk scores to artificially categorize patients into treatment groups as per older guidelines, the European Society of Cardiology (ESC) guidelines now recommend a risk factor-based approach to stroke prevention.1 The initial step is to identify the low-risk patients (defined as a CHA2DS2-VASc score = 0 for males, 1 for females) who do not need any antithrombotic therapy. The subsequent step is to offer effective stroke prevention, which is oral anticoagulation (OAC) to AF patients with ≥1 additional stroke risk factors. A similar approach has been recommended in the 2014 National Institute for Health and Care Excellence (NICE) guidelines.2
In the EuroObservational Research Programme Pilot survey on Atrial Fibrillation (EORP-AF Pilot), we previously reported a high rate of OAC use (nearly 80%) and this was reflected in the low rates overall of stroke and thromboembolism (TE) during follow-up.3 Those patients at very high risk (CHA2DS2-VASc score 8–9) paradoxically had slightly less OAC use, and more aspirin—and the elderly were often prescribed less OAC.4
Guideline-adherent therapy for stroke prevention has been associated with better outcomes, in terms of TE and bleeding, as was first reported a decade ago in the EuroHeart survey on AF.5 Since then, other observational cohorts have confirmed this.6 Even modelling data from clinical trials show that prescribing guideline-adherent therapy improved efficacy and safety outcomes.7
In this report from the EORP-AF Pilot General Registry, we describe the associated baseline features of ‘high risk’ AF patients in relation to guideline-adherent antithrombotic treatment, i.e. whether they were adherent, over-treated, or under-treated. Secondly, we evaluated outcomes for all-cause mortality, TE, bleeding, and the composite endpoint of ‘any thromboembolism, cardiovascular death or bleeding’ in relation to whether they were ESC guideline-adherent treatment. Thirdly, we assessed the predictors of guideline-adherent antithrombotic treatment.
Methods
The design, full baseline features, and results from the EORP-AF Pilot survey have been previously published.8 In brief, the EORP-AF registry population comprised consecutive inpatients and outpatients with AF presenting to cardiologists in participating ESC countries. Consecutive patients were screened for eligibility at the time of their presentation to a cardiologist (hospital or medical centre). All patients provided written informed consent. Patients with the primary or secondary recorded diagnosis of AF were included.
Patients were officially enrolled in the EORP-AF only if an ECG diagnosis (12-lead ECG, 24-h Holter, or other electrocardiographic documentation) confirming AF was made.8 The qualifying episode of AF should have occurred within the last year, and patients did not need to be in AF at the time of enrolment. For the pilot phase, nine countries formally participated. A minimum of 20 consecutive patients per centre were to be enrolled, with a target of 3000 patients. Enrolment into the registry started in February 2012, and the ended in March 2013.
In this ancillary analysis, we focused on differences in antithrombotic therapy management of high-risk AF patients, in relation to whether they were guideline adherent, over-treated, or under-treated (see Figure 1 for definitions).
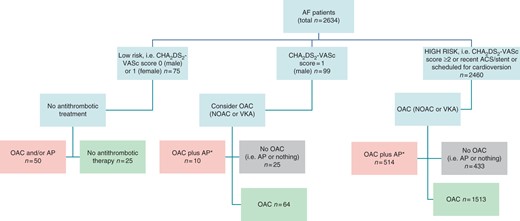
Flow chart for categorizing antithrombotic guideline adherence, amongst patients with follow-up. *In high-risk patients without CAD and diabetes. AP, antiplatelet agent. All patients with follow-up: pink = over-treatment (n = 574); light green = guideline adherent (n = 1602); grey = undertreatment (n = 458). For high-risk patients only: pink = over-treatment (n = 514); light green = guideline adherent (n = 1513); grey = undertreatment (n = 433). Amongst ‘low risk’ if scheduled for cardioversion, these are re-categorized as high risk. Also, any patients with recent ACS or stents would be re-categorized as ‘high risk’ and ‘guideline adherent’ (light green).
We also investigated the differences in characteristics between guideline adherent, over-treated, or under-treated patients who were at high risk, and the associated adverse outcomes at 1 year. We recorded outcomes for all-cause mortality, TE, bleeding, and the composite endpoint of ‘any thromboembolism, cardiovascular death or bleeding’. Thromboembolism refers to stroke, transient ischaemic attack (TIA), acute coronary syndrome (ACS), coronary intervention, cardiac arrest, peripheral embolism, and pulmonary embolism—each of these as recorded by the investigator, in this ‘real world’ observational registry. Finally, we determined the multivariate predictors of guideline adherence or non-adherence, amongst the high-risk subgroup.
Statistical analyses
Univariate analysis was applied to both continuous and categorical variables. Continuous variables were reported as mean ± SD or as median and interquartile range. Among-group comparisons were made using a non-parametric test (Kruskal–Wallis test). Categorical variables were reported as percentages. Inter-group comparisons were made using a χ2 test or a Fisher's Exact test if any expected cell count was <5. For qualitative variables with more than two possibilities, the Monte Carlo estimates of the exact P-values are used.
The odds ratio (OR) of events at 1 year was obtained by logistic procedure separately for ‘over treatment’ and ‘undertreatment’; the reference was the guideline-adherence group and the Wald confidence interval (CI) at 95% was produced.
A stepwise multiple logistic regression was used to determine the predictors of guideline-adherent antithrombotic therapy use including into the model all the candidate variables (variables with P < 0.10 in univariate, except those with a high number of missing data). For modelling, adjustment for site variance (67 sites were involved in the registry) was taken into account by using two types of variables, as follows: first, the nature of the site: specialized or not specialized, i.e. those who did interventional electrophysiology and those who did not; second, the site of enrolment of each patient, i.e. outpatient clinic, cardiology ward, cardiac surgery ward, first heart aid, private cardiology practice, or other (reflecting European clinical practice in different countries).
A significance level of 0.05 is required to allow a variable into the model (SLENTRY = 0.05), and a significance level of 0.05 is required for a variable to stay in the model (SLSTAY = 0.05). No interaction was tested. A Hosmer and Lemeshow Goodness-of-Fit test was used to verify that the model was optimal.
A two-sided P value of <0.05 was considered as statistically significant. All analyses were performed using SAS statistical software version 9.3 (SAS Institute, Inc., Cary, NC, USA).
Results
From the EORP-AF cohort, the follow-up dataset of 2634 subjects was used to assess the impact of guideline adherence or non-adherence. Of these, 1602 (60.6%) were guideline adherent, whilst 458 (17.3%) were under-treated, and 574 (21.7%) were over-treated.
The elderly (age >75; P = 0.0221) and females (P < 0.0001) tended to be not guideline adherent with regard to antithrombotic therapy. Also, first detected and paroxysmal AF patients tended to be under-treated (P < 0.0001). With regard to associated medical history, lone AF was uncommon but tended to have non-guideline-adherent treatment (P = 0.0012). Guideline-adherent patients were less likely to have valvular heart disease, chronic heart failure, or hypercholesterolaemia—as well as other various comorbidities, including coronary artery disease, chronic kidney disease, peripheral vascular disease, current smoker, hypertensive cardiomyopathy, and hypertrophic cardiomyopathy (see Table 1). Prior haemorrhagic event and pharmacological cardioversion were more common amongst under-treated patients (P = 0.0146 and P < 0.0001). Electrical cardioversion was more common amongst guideline-adherent patients.
Baseline characteristics of patients where OAC is recommended using 2012 ESC (all subjects with follow-up)
| Undertreatment | Guideline adherence | Over-treatment | P-Value | |
|---|---|---|---|---|
| Number of patients | 458 | 1602 | 574 | |
| Demographics | ||||
| Age in years median (IQR) | 70 (61–80) | 69 (61–76) | 70 (63–78) | 0.0336 |
| Age ≥75 years (%) | 36.5 | 31.3 | 36.6 | 0.0221 |
| Age >65 years (%) | 61.8 | 62.9 | 67.2 | 0.1186 |
| Female gender (%) | 41.9 | 41.8 | 31.5 | <0.0001 |
| AF type (%)a | ||||
| First detected | 37.1 | 29.0 | 26.6 | <0.0001 |
| Paroxysmal | 31.3 | 26.2 | 24.6 | |
| Persistent | 19.3 | 24.9 | 33.7 | |
| Permanent | 12.2 | 19.8 | 15.2 | |
| Concomitant disease (%) | ||||
| Lone AF | 7.0 | 3.3 | 3.3 | 0.0012 |
| Coronary artery disease | 43.2 | 20.3 | 73.1 | <0.0001 |
| Myocardial infarction | 51.2 | 36.1 | 47.2 | 0.0022 |
| PTCA/CABG | 47.0 | 40.0 | 52.3 | 0.0079 |
| Stable angina | 36.3 | 42.9 | 31.6 | 0.0120 |
| Chronic heart failure | 41.5 | 42.1 | 60.3 | <0.0001 |
| CHF of whom NYHA III/IV | 54.8 | 39.6 | 40.7 | 0.0011 |
| Valvular heart disease | 62.7 | 59.4 | 72.9 | <0.0001 |
| Dilated cardiomyopathy | 10.0 | 11.6 | 12.7 | 0.4191 |
| Hypertrophic cardiomyopathy | 5.9 | 3.1 | 4.0 | 0.0296 |
| Restrictive cardiomyopathy | 0.2 | 0.7 | 0.4 | 0.5493a |
| Hypertensive cardiomyopathy | 21.9 | 17.0 | 25.8 | <0.0001 |
| Other cardiac disease | 9.4 | 7.8 | 10.4 | 0.1613 |
| Chronic obstructive pulmonary disease | 10.6 | 10.8 | 13.7 | 0.1582 |
| Hyperthyroidism | 1.4 | 3.5 | 3.0 | 0.0684 |
| Hypothyroidism | 6.9 | 7.3 | 6.8 | 0.8849 |
| Chronic kidney disease | 19.6 | 10.8 | 14.4 | <0.0001 |
| Peripheral vascular disease | 11.2 | 9.1 | 18.8 | <0.0001 |
| Cardiovascular risk factors (%) | ||||
| Diabetes | 17.2 | 18.8 | 27.6 | <0.0001 |
| Hypertension | 66.4 | 70.8 | 74.2 | 0.0245 |
| Current smoker | 17.4 | 9.5 | 11.1 | <0.0001 |
| Hypercholesterolaemia | 47.4 | 42.3 | 64.8 | <0.0001 |
| Alcohol ≥2–3/day | 6.6 | 8.7 | 8.9 | 0.3335 |
| Physical activity (%) | ||||
| None | 42.5 | 40.2 | 32.1 | 0.0101 |
| Occasional | 33.7 | 33.6 | 38.9 | |
| Regular | 19.7 | 21.0 | 25.0 | |
| Intense | 4.0 | 5.2 | 4.0 | |
| Co-morbidities (%) | ||||
| Ischaemic thrombo-embolic complications | 9.5 | 13.3 | 14.0 | 0.0583 |
| Previous stroke | 4.9 | 6.1 | 6.9 | 0.3989 |
| Previous TIA | 3.1 | 4.3 | 4.5 | 0.4858 |
| Haemorrhagic events | 9.3 | 6.1 | 5.0 | 0.0146 |
| Haemorrhagic stroke | 4.8 | 4.1 | 3.6 | >0.999b |
| Major bleeding | 31.0 | 22.4 | 35.7 | 0.2938 |
| Malignancy | 7.9 | 4.7 | 4.5 | 0.0205 |
| Previous interventions | ||||
| Pharmacological cardioversion | 47.3 | 30.1 | 41.1 | <0.0001 |
| Electrical cardioversion | 17.6 | 36.9 | 21.3 | <0.0001 |
| Catheter ablation | 3.3 | 11.1 | 5.0 | <0.0001 |
| Pacemaker implantation | 4.8 | 8.3 | 6.8 | 0.0344 |
| ICD implantation | 0 | 1.9 | 1.4 | 0.0123 |
| AF surgery | 0.4 | 1.4 | 0.5 | 0.0861 |
IQR, interquartile range; ICD, implantable cardioverter-defibrillator.
Kruskal–Wallis test is used for quantitative data. χ2 or Fisher's Exact test is used for binary variables. For qualitative variables with more than two possibilities, the Monte Carlo estimates of the exact P-values are used.
aPersistent AF includes persistent AF and long-standing persistent AF.
bFisher's Exact test.
Event rates during 1 year are presented in Table 2. Crude event rates for stroke/TIA or any TE were numerically higher in under-treated and over-treated subjects. As expected, bleeding events were lower amongst under-treated patients. The composite of cardiovascular death, any TE, or bleeding was numerically lower in guideline-adherent patients. Broadly comparable figures are seen for the high-risk subgroup (Figure 2).
Event rates during 1 year vs. antithrombotic guideline adherence, amongst subjects with follow-up
| Undertreatment (n = 458) | Guideline adherence (n = 1602) | Over-treatment (n = 574) | |
|---|---|---|---|
| Stroke/TIA | 5 (1.3%) | 16 (1.1%) | 1 (0.2%) |
| Any TE | 19 (5.0%) | 45 (3.1%) | 24 (5.2%) |
| Bleeding | 1 (0.3%) | 18 (1.2%) | 6 (1.3%) |
| CV death—any TE or bleeding | 31 (8.0%) | 102 (6.9%) | 49 (10.3%) |
Stroke = stroke and/or TIA; any TE = stroke, TIA, ACS, coronary intervention, cardiac arrest, peripheral embolism, and pulmonary embolism.
Effect of antithrombotic guideline deviance on 1-year outcome
| One year outcome | OR | 95% CI | |
|---|---|---|---|
| (a) Subjects with follow-up | |||
| Undertreatment | Stroke/TIA | 1.210 | (0.440–3.324) |
| Any TE | 1.664 | (0.962–2.880) | |
| Bleeding | 0.206 | (0.027–1.545) | |
| CV death, any TE, or bleeding | 1.170 | (0.770–1.779) | |
| Over-treatment | Stroke/TIA | 0.196 | (0.026–1.480) |
| Any TE | 1.723 | (1.038–2.860) | |
| Bleeding | 1.027 | (0.405–2.602) | |
| CV death, any TE, or bleeding | 1.545 | (1.081–2.210) | |
| (b) High-risk patients | |||
| Undertreatment | Stroke/TIA | 0.970 | (0.322–2.920) |
| Any TE | 1.619 | (0.924–2.839) | |
| Bleeding | 0.207 | (0.027–1.553) | |
| CV death, any TE, or bleeding | 1.162 | (0.759–1.778) | |
| Over-treatment | Stroke/TIA | 0.211 | (0.028–1.597) |
| Any TE | 1.914 | (1.149–3.189) | |
| Bleeding | 1.108 | (0.437–2.809) | |
| CV death, any TE, or bleeding | 1.722 | (1.200–2.470) | |
The reference population is guideline adherence. Odds ratio of events at 1 year was obtained by logistic procedure separately for the over-treatment and undertreatment; the reference was the guideline adherence and the Wald CI at 95% was produced.
On analysis of the patients with follow-up, over-treatment was associated with a significantly higher OR of any TE [OR 1.723, 95% CI 1.038–2.860] and the composite of ‘cardiovascular death, any TE or bleeding’ (OR 1.545, 95% CI 1.081–2.210), when compared with guideline-adherent patients as the reference population (Table 3a). When the analysis was confined to the high-risk subgroup, similar ORs were seen (Table 3b). Similar trends were seen for the undertreatment groups, but sample size and low rates led to some CIs crossing neutral.
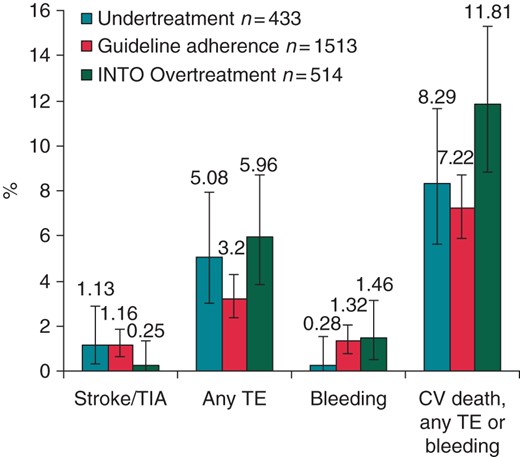
Event rates during 1 year vs. antithrombotic guideline adherence in subgroup of patients at high risk for stroke. CV, cardiovascular. The Clopper–Pearson interval is used for calculating 95% binomial CIs.
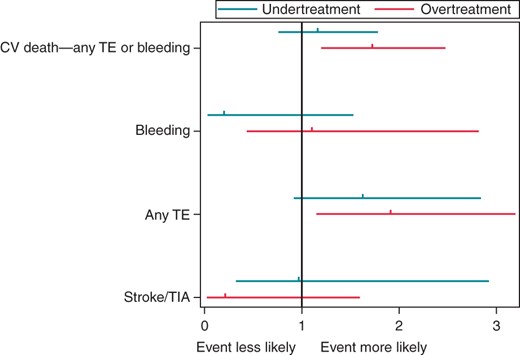
Multivariate effect of antithrombotic guideline deviance on 1-year outcome. Results are reported as OR with 95% CI compared with the reference group of guideline adherence (OR, 1.0).
Major adverse events in relation to their guideline-adherent antithrombotic therapy
Major adverse events during 1-year follow-up in relation to their guideline-adherent antithrombotic treatment strategy in patients at high risk for stroke are presented in Table 4. Event rates for ‘any TE’ were significantly lower in guideline-adherent patients (P = 0.0259), as were the composite endpoints of ‘all cause death and any TE’ (P = 0.0009) and ‘cardiovascular death, any TE or bleeding’ (P = 0.0118).
Major adverse events during 1-year follow-up in relation to antithrombotic treatment in patients at high risk for stroke
| Undertreatment (n = 433) | Guideline adherence (n = 1513) | Over-treatment (n = 514) | P-Value | |
|---|---|---|---|---|
| Number of patients | 433 | 1513 | 514 | |
| Events, n(%) | ||||
| All cause of death | 38 (8.8%) | 88 (5.8%) | 37 (7.2%) | 0.0777 |
| Any TE | 18 (5.1%) | 44 (3.2%) | 24 (6.0%) | 0.0259 |
| All cause of death + any TE | 56 (14.3%) | 132 (9.0%) | 61 (13.9%) | 0.0009 |
| Stroke/TIA | 4 (1.1%) | 16 (1.2%) | 1 (0.2%) | 0.2332[a] |
| Bleeding | 1 (0.3%) | 18 (1.3%) | 6 (1.5%) | 0.1969[a] |
| CV death, any TE, or bleeding | 30 (8.3%) | 100 (7.2%) | 49 (11.8%) | 0.0118 |
χ2 or Fisher's exact test [a] is used for binary variables. Any TE = stroke, TIA, ACS, coronary intervention, cardiac arrest, peripheral embolism, and pulmonary embolism.
Specifically, the endpoint of ‘all cause death and any TE’ is increased by >60% by undertreatment [hazard ratio (HR) 1.679 (95% CI 1.202–2.347)] or over-treatment [HR 1.622 (95% CI 1.173–2.23)] (see Table 5). For the composite endpoint of ‘cardiovascular death, any TE or bleeding’, over-treatment increased risk by >70% [HR 1.722 (95% CI 1.200–2.470)]. Bleeding events were low and non-significant differences were noted (Figure 3).
Outcomes with guideline-adherent antithrombotic treatment at high risk for stroke
| Guideline adherence | OR (95% CI) | P |
|---|---|---|
| (i) All cause of death plus any TE in patients | ||
| Undertreatment | 1.679 (1.202–2.347) | 0.0022 |
| Over-treatment | 1.622 (1.173–2.243) | 0.0032 |
| (ii) Bleeding | ||
| Undertreatment | 0.207 (0.027–1.553) | 0.0901 |
| Over-treatment | 1.108 (0.437–2.809) | 0.8292 |
| (iii) Combined endpoint of cardiovascular death, any TE, and bleeding | ||
| Undertreatment | 1.162 (0.759–1.778) | 0.4887 |
| Over-treatment | 1.722 (1.200–2.470) | 0.0029 |
Odds ratio of events at 1 year was obtained by logistic procedure separately for the over-treatment and undertreatment; the reference was the guideline adherence and the Wald CI at 95% was produced. Any TE = stroke, TIA, ACS, coronary intervention, cardiac arrest, peripheral embolism, and pulmonary embolism. The reference is guideline adherence.
Predictors of guideline-adherent treatment of ‘high risk’ subjects
Univariate and multivariate predictors of guideline adherence to antithrombotic management amongst high-risk subgroup are presented in Table 6. Multivariate predictors of non-guideline-adherent treatment (i.e. under/over-treatment) vs. guideline-adherent treatment include the following: (i) region with South Europe being less likely to be guideline adherent (P = 0.0010); (ii) study setting, for example, with cardiology ward patients being less likely to be guideline adherent (P = 0.0110); (iii) associated coronary artery disease (defined as myocardial infarction (MI), percutaneous coronary intervention, coronary artery bypass graft (CABG), or stable angina, P < 0.0001); (iv) hypercholesterolaemia (P = 0.0028); (v) current smoking status (P < 0.0001); (vi) previous pharmacological cardioversion (P = < 0.0001); (vii) heart rate (P = 0.0095); and (viii) main reason for admission/consultation (P < 0.0001). Previous electrical cardioversion and catheter ablation were associated with a greater likelihood of guideline adherence (P = 0.0001 and P = 0.0072). Amongst the various features, age, AF type, symptoms, and echocardiography indices did not emerge as independent predictors of guideline adherence or non-adherence.
Univariate and multivariate predictors of guideline non-adherence to antithrombotic management amongst high-risk subgroup
| Variable | Univariate | Multivariate | ||
|---|---|---|---|---|
| OR (95% CI) | P-Value | OR (95% CI) | P-Value | |
| Region | <0.0001 | 0.0003 | ||
| West (Belgium, Denmark, Netherlands, and Norway) | Ref | |||
| East (Poland and Romania) | 2.739 (2.189–3.426) | <0.0001 | 1.041 (0.737–1.471) | 0.8187 |
| South (Greece, Italy, and Portugal). | 2.241 (1.779–2.824) | <0.0001 | 1.772 (1.260–2.493) | 0.0010 |
| Type of centre | ||||
| Specialized | Ref | |||
| Non-specialized | 1.461 (1.224–1.743) | <0.0001 | Not selected | |
| Setting | <0.0001 | 0.0241 | ||
| Outpatient clinic | Ref | |||
| Cardiology ward | 1.965 (1.604–2.407) | <0.0001 | 1.483 (1.094–2.011) | 0.0110 |
| Cardiac surgery ward | 2.591 (0.362–18.538) | 0.3431 | 2.587 (0.206–32.47) | 0.4614 |
| First heart aid | 1.781 (0.810–3.915) | 0.1509 | 0.367 (0.101–1.333) | 0.1278 |
| Private cardiology practice | 0.864 (0.540–1.382) | 0.5406 | 0.900 (0.485–1.670) | 0.7382 |
| Other | 1.950 (1.357–2.803) | 0.0003 | 1.652 (0.949–2.874) | 0.0758 |
| Demographic data | ||||
| Age ≥75 (vs. <75) | 1.336 (1.129–1.581) | 0.0008 | Not selected | |
| Age >65 (vs. ≤65) | 1.227 (1.029–1.462) | 0.0224 | Not selected | |
| Females (vs. male) | 0.794 (0.673–0.937) | 0.0064 | Not selected | |
| AF type | 0.0033 | Not selected | ||
| First detected | Ref | |||
| Paroxysmal | 0.951 (0.763–1.186) | 0.6571 | ||
| Persistent | 1.023 (0.823–1.272) | 0.8362 | ||
| Permanent | 0.656 (0.510–0.846) | 0.0011 | ||
| Concomitant diseases | ||||
| Lone AF (vs. other) | 1.674 (0.998–2.807) | 0.0508 | Not selected | |
| Coronary artery disease (vs. none) | 5.939 (4.915–7.178) | <0.0001 | 4.528 (3.488–5.878) | <0.0001 |
| Chronic heart failure (vs. none) | 1.563 (1.327–1.842) | <0.0001 | Not selected | |
| Valvular heart disease (vs. none) | 1.471 (1.238–1.748) | <0.0001 | Not selected | |
| Dilated/hypertrophic/restrictive cardiomyopathy (vs. none) | 1.288 (1.082–1.534) | 0.0045 | Not selected | |
| Other cardiac disease (vs. none) | 1.330 (0.995–1.780) | 0.0545 | Not selected | |
| Chronic obstructive pulmonary disease (vs. none) | 1.168 (0.911–1.499) | 0.2208 | ||
| Hyperthyroidism (vs. none) | 0.639 (0.383–1.069) | 0.0879 | Not selected | |
| Hypothyroidism (vs. none) | 0.956 (0.698–1.309) | 0.7782 | ||
| Chronic kidney disease (vs. none) | 1.712 (1.359–2.156) | <0.0001 | Not selected | |
| Peripheral vascular disease (vs. none) | 1.853 (1.446–2.376) | <0.0001 | Not selected | |
| Diabetes (vs. none) | 1.346 (1.108–1.635) | 0.0027 | Not selected | |
| Hypertension (vs. none) | 1.146 (0.951–1.380) | 0.1533 | ||
| Hypercholesterolaemia | 1.874 (1.586–2.213) | <0.0001 | 1.433 (1.132–1.813) | 0.0028 |
| Current smoker (vs. not current) | 1.594 (1.223–2.078) | 0.0006 | 2.608 (1.782–3.816) | <0.0001 |
| Alcohol ≥2–3/day (vs. less) | 0.875 (0.640–1.197) | 0.4045 | ||
| Physical activity (%) | 0.1183 | |||
| None | Ref | |||
| Occasional | 1.193 (0.982–1.450) | 0.0750 | ||
| Regular | 1.117 (0.887–1.407) | 0.3454 | ||
| Intense | 0.765 (0.491–1.193) | 0.2378 | ||
| Co-morbidities (%) | ||||
| Ischaemic thrombo-embolic complications | 0.913 (0.719–1.160) | 0.4560 | ||
| Previous stroke | 1.020 (0.733–1.421) | 0.9056 | ||
| Previous TIA | 0.928 (0.621–1.388) | 0.7171 | ||
| Haemorrhagic events | 1.147 (0.832–1.582) | 0.4020 | ||
| Haemorrhagic stroke | 1.217 (0.272–5.448) | 0.7977 | ||
| Major bleeding | 1.713 (0.949–3.090) | 0.0741 | Not selected | |
| Malignancy | 1.268 (0.884–1.820) | 0.1973 | ||
| Previous interventions | ||||
| Pharmacological cardioversion | 1.957 (1.648–2.323) | <0.0001 | 1.773 (1.368–2.298) | <0.0001 |
| Electrical cardioversion | 0.426 (0.352–0.515) | <0.0001 | 0.582 (0.440–0.769) | 0.0001 |
| Catheter ablation | 0.228 (0.149–0.347) | <0.0001 | 0.477 (0.278–0.819) | 0.0072 |
| Pacemaker implantation | 0.695 (0.506–0.956) | 0.0252 | Not selected | |
| ICD implantation | 0.452 (0.205–0.996) | 0.0487 | Not selected | |
| AF surgery | 0.377 (0.142–1.004) | 0.0508 | Not selected | |
| Symptoms | <0.0001 | Not selected | ||
| EHRA I | Ref | |||
| EHRA II | 1.050 (0.863–1.279) | 0.6240 | ||
| EHRA III–IV | 1.517 (1.246–1.848) | <0.0001 | ||
| Heart rate | 1.005 (1.002–1.008) | 0.0005 | 1.005 (1.001–1.010) | 0.0095 |
| Body mass index | 0.990 (0.973–1.007) | 0.2480 | ||
| Systolic blood pressure | 1.009 (1.005–1.013) | <0.0001 | Not selected | |
| Diastolic blood pressure | 1.008 (1.002–1.014) | 0.0150 | Not selected | |
| Echocardiogram | ||||
| LA size | 0.964 (0.953–0.974) | <0.0001 | Not entered | |
| LVEF | 0.988 (0.981–0.994) | 0.0004 | Not entered | |
| LVH | 1.510 (1.258–1.813) | <0.0001 | Not selected | |
| Management strategy | 0.0108 | <0.0001 | ||
| Rate control | 0.911 (0.597–1.392) | 0.6674 | 0.714 (0.391–1.304) | 0.2727 |
| Rate and rhythm control | 1.211 (0.795–1.843) | 0.3729 | 1.538 (0.828–2.859) | 0.1731 |
| Rhythm control only | 0.913 (0.575–1.451) | 0.7001 | 1.586 (0.808–3.115) | 0.1804 |
| Observation | Ref | |||
| Main reason for admission/consultation (%) | <0.0001 | <0.0001 | ||
| Atrial fibrillation | 0.928 (0.542–1.588) | 0.7844 | 1.186 (0.561–2.509) | 0.6550 |
| Acute myocardial infarction | 23.184 (9.493–56.618) | <0.0001 | 18.27 (5.720–58.36) | <0.0001 |
| Valvular heart disease | 1.627 (0.830–3.188) | 0.1562 | 2.736 (1.114–6.722) | 0.0282 |
| Hypertension | 1.708 (0.702–4.158) | 0.2380 | 2.271 (0.629–8.199) | 0.2105 |
| Heart failure | 1.281 (0.730–2.246) | 0.3878 | 1.036 (0.477–2.254) | 0.9279 |
| Other coronary artery disease | 5.319 (2.704–10.462) | <0.0001 | 3.248 (1.331–7.929) | 0.0097 |
| Other cardiac | 0.947 (0.518–1.732) | 0.8598 | 1.119 (0.486–2.574) | 0.7914 |
| Other non-cardiac | Ref | |||
Under/over-treatment (n = 947) vs. guideline adherent (n = 1513). Univariate results correspond to logistic procedure with only 1 by 1 variable. For the multivariate analysis, only variables significant (P < 0.10) in univariate were taken into account to build the model. ‘Not selected’ corresponds to variable proposed in the multivariate model but not selected. ‘Not entered’ corresponds to significant (P < 0.10) variables but not taken into account in the model because of high number of missing data. There is no evidence of lack of fit (P = 0.44).
Multivariate predictors of undertreatment vs. guideline-adherent treatment include region (with undertreatment more likely in East and South Europe), non-specialized centre (P = 0.0082), lone AF (P < 0.0001), coronary artery disease (P = 0.0008), smoking (P < 0.0001), malignancy (P = 0.0288), previous pharmacological cardioversion (P = 0.0003), and main reason for admission/consultation. Previous electrical cardioversion and catheter ablation, body mass index, rate control strategy, and AF type (in persistent and permanent AF), were associated with less undertreatment (Supplementary material online, Table S1a).
Multivariate predictors of over-treatment vs. guideline-adherent treatment include study setting (e.g. cardiology ward), persistent AF, coronary artery disease, peripheral vascular disease, hypercholesterolaemia, symptoms (by EHRA score of II or more), diastolic blood pressure, and a presentation with acute MI. Females were less likely to be over-treated (Supplementary material online, Table S2b).
Discussion
In this analysis from a contemporary European cohort with AF, we show that guideline-adherent antithrombotic management based on the ESC guidelines is associated with significantly better outcomes, even in this cohort with high overall rates of OAC use. Specifically, the endpoint of ‘all cause death and any TE’ is increased by >60% by undertreatment or over-treatment in high-risk patients. For the composite endpoint of ‘cardiovascular death, any TE or bleeding’, over-treatment increased risk by >70%. Secondly, non-guideline-adherent treatment can be related to region of Europe as well as some associated clinical features, but not age, AF type, symptoms, or echocardiography indices. Over-treatment per se was associated with symptoms, using the EHRA score, as well as other comorbidities.
These observations emphasize the great importance of ESC guideline implementation, as well as adherence to treatment guidelines. Indeed, stroke prevention is central to the management of AF, and even from the historical trials of warfarin compared with placebo or control, there was a significant reduction in ‘all stroke and systemic TE’ (by 64%), ischaemic stroke (by 67%), and all-cause mortality (by 26%) by OAC.9 Thus, effective thromboprophylaxis means OAC, which reduces stroke and saves lives. The non-Vitamin K antagonist (VKA) oral anticoagulants (NOACs) have shown efficacy for reducing stroke and mortality over and above what can be achieved with warfarin.10,11 In contrast, antiplatelet therapy (particularly aspirin) is minimally effective for stroke prevention and does not reduce mortality, with a similar rate of major bleeding to warfarin.12
Thus, the major guidelines have emphasized the role of OAC for stroke prevention in AF, whether was adjusted dose VKAs [e.g. warfarin with good quality anticoagulation control (time in therapeutic range (TTR) >70%) or one of the NOACs].1,2 In 2012, the ESC guidelines1 also emphasized an important practice shift, so that rather than focus on identifying high-risk patients, the initial step should be to identify low-risk patients (i.e. CHA2DS2-VASc score = 0 for males, 1 for females) who did not need any antithrombotic therapy. Subsequent to that step, patients with one additional stroke risk factors can be offered effective stroke prevention, which is OAC.13
The EORP-AF general registry was designed to test the uptake and impact of ESC guideline implementation amongst European cardiologists, and our observations from this registry have shown how use of anticoagulation has increased to ∼80% (compared with 67% a decade ago, with the EuroHeart survey on AF5) and how guideline-adherence results in better outcomes in relation to ‘death, TE and bleeding’ outcomes. Nonetheless, high overall OAC use that is inappropriately prescribed (‘overtreatment’) would not lead to good outcomes, as shown in the present study.
Amongst the multivariate predictors of non-guideline-adherent treatment (i.e. under/over-treatment) vs. guideline-adherent treatment, the region differences emerged as a significant predictor with South Europe being less likely to be guideline adherent relative to West Europe. The regional differences in anticoagulation practice are evident, as are approaches to the management of AF.14,15 Also, study clinical setting (and reason for admission/consultation) can influence, for example, with cardiology ward patients being less likely to be guideline adherent but this may reflect these patients having associated comorbidities that could have precluded guideline adherence. Indeed, associated coronary artery disease emerged as a predictor for non-adherent treatments, and may reflect the use of OAC plus antiplatelet therapy, even if associated vascular disease was ‘stable’ whereby such co-administration may not be justified.16,17,18 Also, hypercholesterolaemia and smoking status could be reflective of the associated vascular disease. Interestingly, previous pharmacological cardioversion was a predictor of non-adherent treatment, perhaps from the cessation of thromboprophylaxis since the act of performing the cardioversion may distract physicians from assessing stroke risk, as shown in other registries.19,20 However, previous electrical cardioversion was associated with a greater likelihood of guideline adherence. Of note, age, AF type, symptoms, and echocardiography indices did not emerge as independent predictors of guideline adherence or non-adherence, in this European cohort. Of note, age did not independently determine guideline adherence, despite a tendency to under-anticoagulate the more elderly patients despite their greater likelihood of benefit from stroke prevention.4 However, symptomatic patients were more likely to be over-treated, perhaps reflecting patient values and preferences in terms of choice of management strategies potentially driven by symptom-triggered anxieties.21
Only two prior observational cohorts have examined the importance of guideline-adherent treatments, both showing improved outcomes with guideline-adherent antithrombotic therapy; however, this is the first study to show better outcomes with guideline-adherent stroke prevention based on the new 2012 ESC AF guidelines. This is novel as the latter guideline—for the first time—focused on the initial identification of ‘low risk’ patients who did not need any antithrombotic therapy, following which OAC can be offered to those with ≥1 stroke risk factors. Older guidelines had a categorical approach to stroke risk stratification and treatment decisions were focused on identifying ‘high risk’ patients to be targeted for OAC treatment.
Also, an important objective of the ESC-sponsored EORP programme was to assess impact of contemporary ESC guidelines (and guideline adherence), and this current EORP-AF analysis clearly fulfils this objective.
In the EuroHeart survey on AF, the use of guideline-adherent management was associated with better outcomes.5 Compared with guideline adherence, for example, undertreatment was associated with a higher chance of TE (1.97-fold) and the combined endpoint of cardiovascular death, TE, or major bleeding (1.5-fold).5 In contrast, over-treatment was non-significantly associated with a higher risk for major bleeding. In the Loire Valley AF project, similar observations were noted, whereby guideline adherence was associated with a lower risk of death compared with undertreatment (by 53%).6 Based on a trial dataset,7 the use of prescribing label recommendations was associated with improved efficacy and safety outcomes, as well as a positive net clinical benefit by following the prescribing label guidelines.
Limitations
We have limited data on NOACs, but our purpose was to test a management strategy, as per guideline adherence. We also had few bleeding events, and thus non-significant trends were noted. Notwithstanding the relatively small sample size and event rates, we still show that guideline-adherent antithrombotic management based on the 2012 ESC guidelines is associated with significantly better outcomes. We focused on stroke, TE, and death, as with such a registry design, some deaths may be due to undiagnosed strokes as real world observational data such as ours cannot mandate post-mortems on everyone, nor cerebral imaging. We also lack data on quality of anticoagulation control as reflected by TTR, as we now recognize that anticoagulation control, as reflected by high TTR (>70%) in VKA-treated patients, is associated with low risk of TE and serious bleeding.22–24 The EORP-AF protocol is also observational registry/survey with data input performed at baseline and at 1-year follow-up, and as this was not a clinical trial with periodic patient contact, we did not record the changes in therapy over intermediate time points.
In this study, we have expressed our ‘net clinical benefit’ in terms of a composite endpoint of ‘cardiovascular death, any TE and bleeding’, where any TE also referred to stroke, TIA, ACS, coronary intervention, cardiac arrest, peripheral embolism, and pulmonary embolism. The association between over-treatment and a significantly higher OR of any TE could be residual confounding, or some strokes being haemorrhagic strokes related to over-treatment. We were not able to calculate net clinical benefit using other methods of balancing ischaemic stroke reduction vs. intracranial haemorrhage as we did not have the specific data for the latter endpoint, as cerebral imaging was not mandated. Finally, we may have misclassified ‘undertreatment’ in some patients with CHA2DS2-VASc score 1 (in males) as well as ‘overtreatment’ in some patients with concomitant disease, e.g. ACS with stents.
Conclusion
European Society of Cardiology guideline-adherent antithrombotic management is associated with significantly better outcomes, including those related to mortality and TE, as well as the composite endpoint of ‘cardiovascular death, any TE or bleeding’. These contemporary observations emphasize the importance of guideline implementation, and adherence to the ESC guidelines for stroke prevention in AF.
Supplementary material
Supplementary material is available at Europace online.
EORP sponsors
At the time of the registry, the following companies are supporting the EURObservational Research programme: GOLD: Abott Vascular, Bayer Pharma, Bristol Myers Squibb (BMS), Pfizer, Boehringer Ingelheim, Daiichi Sankyo Europe, Menarini international Operations, Novartis Pharma, Sanofi-Aventis, Servier International. SILVER: Amgen. BRONZE: Boston Scientific International, Merck & Co. (MSD).
Conflict of interest: G.Y.H.L. has served as a consultant for Bayer, Merck, Sanofi, BMS/Pfizer, Daiichi-Sankyo, Biotronik, Medtronic, Portola, and Boehringer Ingelheim, and has been on the speakers bureau for Bayer, BMS/Pfizer, Boehringer Ingelheim, Daiichi-Sankyo, and Medtronic.
Acknowledgements
Members of the Executive Steering Committee, Steering Committee (National Coordinators), and Investigators were provided in the primary paper describing the baseline data, by Lip et al.8 We thank the EURObservational Research programme (EORP) team, national coordinators, and investigators for their contribution of performing the survey.
References
