


Abstract
To report trends in mortality rates for atrial fibrillation/flutter (AF), using all the certified causes of death mentioned on death certificates (conventionally known as ‘mentions’) as well as the underlying cause of death, in the national population of England (1995–2010) and in a regional population with longer coverage of all-mentions mortality (1979–2010).
Analysis of death registration data in England and in the Oxford record linkage study. In England between 1995 and 2010, AF was mentioned as a cause of death (either as an underlying cause or as a contributory cause) in 192 770 registered deaths in people aged 45 years of age and over (representing 0.254% of all registered deaths in this age group). Atrial fibrillation was given as the underlying cause of death in 21.4% of all deaths in which it was mentioned (41 298 of 192 770). In England, age-standardized death rates for mentions of AF increased almost three-fold between 1995 and 2010, from 202.5 deaths per million (1995) to 554.1 deaths per million (2010), with an average annual percentage change of 6.6% (95% confidence interval: 6.3, 7.0). Mortality rates for AF did not increase substantially until the mid-1990s: rates in Oxford were 145.4 deaths per million in 1979, 178.1 in 1995, and 505.1 in 2010.
Atrial fibrillation has become much more common as a certified cause of death. The reasons for this are likely to be multifactorial, with changes in demographics, lifestyle, advances in therapeutics, and altered perception of the importance of the condition by certifying doctors all likely to be contributing factors.
Atrial fibrillation/flutter has become more prevalent at death in both genders and most age groups.
The greatest increase in certification of atrial fibrillation/flutter as a cause of death occurred in the population aged 85+.
Although it is generally accepted that mortality rates for atrial fibrillation/flutter are higher in men than women, we report that in the population aged 85+ age-specific mortality rates are higher in women than men.
Introduction
Atrial fibrillation (AF) is the commonest sustained cardiac arrhythmia worldwide. It causes considerable morbidity, and is an important risk factor for stroke,1 peripheral vascular complications,2 and heart failure.3 Atrial fibrillation is considered to account for between 17 and 27% of strokes,4 and it occurs in heart failure in between 13 and 27% of cases, with prevalence of up to 50% reported among patients with severe heart failure.3
The prevalence of AF in the general UK population aged 45 years and over, determined by electrocardiography in the ECHOES study (1995–99), was found to be 1.6% in women and 2.4% in men, rising with age from 0.2% in men and women aged 45–54 to 8.0% in those aged 75 years and over.5 Half of all the cases were found in the elderly aged 75 years and over. Increased prevalence of the condition has been reported in several countries in recent years.6,7 Current data concerning population-based mortality associated with increasing prevalence of AF are limited. Most information about AF-associated mortality comes from selected cohort studies such as the Framingham Heart Study, or from clinical trials, or is out of date.1
Mortality statistics are an important source of information about trends for disease at the population level. Death certificates in England consist of two parts. In Part I, the certifying practitioner considers the main causal sequence of conditions leading to death and states the disease or condition that led directly to death on the first line I(a), and then works back through the antecedents (if any) of this condition, listing any intermediate causes of death on lines (b) and (c) and using further lines if more are required. The underlying cause of death, which initiated the chain of events leading ultimately to death, is taken as that on the lowest line. It is this cause which is considered to be the ‘underlying’ cause of death. Part II is used to list the condition(s) considered to have contributed to death that are not part of the main causal sequence leading to death.
From 1993 onwards (but not earlier), handwritten causes of death in England have been digitized by the local Registrar of Births, Deaths, and Marriages, sent electronically to the Office for National Statistics (ONS) for processing, and specific text terms from the death certificate converted by the ONS to the International Classification of Diseases (ICD) codes. Selection and modification rules are then assigned to apply the underlying cause of death.8 This method of registration of deaths in England makes information available on all causes of death mentioned on each death certificate (whether listed as the underlying cause of death or as a contributing cause of death, together termed ‘mentions’) not just the ‘underlying’ cause of death.
The recording of all causes of death on each certificate started earlier (in 1979) in the former Oxford National Health Service region of England as part of the Oxford Record Linkage Study (ORLS).9 The ORLS resource, while restricted to a particular region of England, allows comprehensive analysis of mortality data over an extended time period.
The main aim of this study is to report the mortality trends for AF in both the England national population (1995–2010) and the Oxford regional population (1979–2010).
Methods
The national and regional databases of death registration data were searched for records of deaths coded for atrial fibrillation and flutter (ICD 9th revision code 427.3 and ICD 10th revision code I48) and for ventricular fibrillation and flutter (ICD-9 427.4 and ICD-10 I49.0), occurring in the years 1995–2010 and 1979–2010, respectively. (ICD-9 revision codes cover the period 1979–2000, ICD-10 revision codes were introduced in 2001, and cover the period 2001 onwards.) Both data files end in December 2011. Since some deaths that occur within a given year are not registered until after the end of that year, we identified and included in our analysis deaths which were registered in 2011, but we only present deaths that occurred up to the end of 2010 (to provide as complete an enumeration as possible by calendar year of occurrence).
Deaths were analysed according to whether AF was recorded as the underlying cause of death or whether AF was recorded in any position on the death certificate, i.e. ‘mentioned’ as a cause of death. The maximum possible number of causes of deaths (mentions) held in our databases has increased over time from 7 (1979) to 10 causes of death per certificate (1995 onwards), but it is uncommon (<1% of deaths in England in 2010) for more than 7 causes of deaths to be listed.
The file of records for England (population 52 million) was provided by the ONS. The ORLS file covered a population of 2.5 million. Compared with England as a whole, the Oxford region (Berkshire, Buckinghamshire, Oxfordshire, and Northamptonshire) is relatively prosperous and healthy; and mortality rates from coronary heart disease are lower than average.10
For all the deceased persons in England with AF mentioned on their death certificate over the ICD-10 period 2001–10, we also determined the commonest other medical conditions certified as having contributed to their death.
We calculated the changes over time in annual age-standardized mortality rates. We standardized by applying the age-specific death rates, in 5-year age groups, in each population in each year to the European standard population.11
We calculated the average annual percentage change (AAPC) over time in age- and sex-specific mortality rates by fitting regression models to the logarithms of the mortality rates.
In a separate analysis, we examined all the deaths in England for single years 2001–10 to determine the mean number of causes of death (mentions) listed per certificate.
Results
Atrial fibrillation was mentioned as a cause of death (either as an underlying cause or as a contributory factor) in 192 770 registered deaths in people aged 45 years of age and over in England between 1995 and 2010 (representing 0.254% of all registered deaths in people aged 45 and over). Atrial fibrillation was given as the underlying cause of death in 21.4% of all deaths in which it was mentioned (41 298 of 192 770).
Age-standardized mortality rates for AF as mentions in England increased almost three-fold from 202.5 deaths per million in 1995 to 554.1 deaths per million in 2010 (Figure 1, Table 1). The overall AAPC in England was 6.6% (95% CI: 6.3, 7.0) (Table 1). Underlying cause mortality rates for England also increased significantly, from 55.1 deaths per million in 1995 to 88.8 deaths per million in 2010, with an AAPC of 2.2% (CI: 1.3, 3.0) (Figure 1) (data not in table).
Number of deaths certified as AF in England and the Oxford region based on mentions: mortality ratesa per million population based on the underlying cause (UC) and the mentions; AAPC based on the mentions
| Age group | Number of deaths | Mortality rate | Average annual % change (AAPC) | 95% CI | |||||||
|---|---|---|---|---|---|---|---|---|---|---|---|
| UC | Mentions | ||||||||||
| 1995 | 2010 | 1995–2010 | 1995 | 2010 | 1995 | 2010 | |||||
| England | Men | ||||||||||
| 45–49 | 3 | 13 | 104 | 0.0 | 0.5 | 1.8 | 6.9 | 7.1b | 3.6 | 10.6 | |
| 50–54 | 20 | 27 | 290 | 0.7 | 1.2 | 14.4 | 16.5 | 3.4b | 0.6 | 6.4 | |
| 55–59 | 27 | 66 | 634 | 6.4 | 4.8 | 21.7 | 45.2 | 4.9b | 2.7 | 7.3 | |
| 60–64 | 60 | 161 | 1608 | 7.1 | 10.4 | 52.9 | 104.9 | 4.3b | 3.3 | 5.3 | |
| 65–69 | 146 | 336 | 3433 | 28.9 | 30.7 | 140.5 | 286.1 | 4.1b | 3.3 | 4.9 | |
| 70–74 | 310 | 692 | 7097 | 85.7 | 86.8 | 340.6 | 714.7 | 4.1b | 3.3 | 5.0 | |
| 75–79 | 458 | 1323 | 12 981 | 189.9 | 184.2 | 783.4 | 1766.1 | 5.1b | 4.4 | 5.8 | |
| 80–84 | 538 | 1974 | 18 028 | 296.7 | 438.3 | 1400.3 | 3845.0 | 6.5b | 5.8 | 7.1 | |
| 85+ | 541 | 3840 | 27 838 | 700.0 | 1335.9 | 2459.1 | 9771.0 | 9.2b | 8.6 | 9.9 | |
| Total | 45+ | 2103 | 8432 | 72 013 | 50.8 | 72.7 | 208.8 | 594.3 | 6.8b | 6.3 | 7.2 |
| Oxford | 45+ | 91 | 396 | 3105 | 42.4 | 74.9 | 195.4 | 545.2 | 6.7b | 5.3 | 8.1 |
| England | Women | ||||||||||
| 45–49 | 1 | 5 | 54 | 0.0 | 1.6 | 0.6 | 2.6 | 5.0 | −0.6 | 11.1 | |
| 50–54 | 3 | 11 | 123 | 1.4 | 0.6 | 2.2 | 6.6 | 6.6b | 3.4 | 10.0 | |
| 55–59 | 16 | 27 | 311 | 2.4 | 6.6 | 12.7 | 17.9 | 3.2b | 0.8 | 5.7 | |
| 60–64 | 48 | 85 | 883 | 5.9 | 10.6 | 40.6 | 53.0 | 1.5 | −0.0 | 3.1 | |
| 65–69 | 112 | 168 | 2230 | 23.9 | 11.1 | 95.7 | 133.3 | 2.3b | 1.3 | 3.4 | |
| 70–74 | 320 | 458 | 5957 | 63.9 | 60.0 | 276.4 | 422.5 | 2.9b | 2.2 | 3.6 | |
| 75–79 | 551 | 1161 | 13 790 | 177.2 | 198.0 | 630.1 | 1263.1 | 4.3b | 3.7 | 4.9 | |
| 80–84 | 962 | 2433 | 26 411 | 404.2 | 570.4 | 1331.7 | 3288.7 | 5.8b | 5.3 | 6.3 | |
| 85+ | 1822 | 8438 | 70 998 | 917.9 | 2170.7 | 2878.4 | 10 484.6 | 8.9b | 8.4 | 9.4 | |
| Total | 45+ | 3835 | 12 786 | 120 757 | 56.1 | 96.4 | 193.9 | 514.9 | 6.5b | 6.2 | 6.9 |
| Oxford | 45+ | 152 | 583 | 5105 | 48.1 | 102.3 | 168.6 | 466.0 | 6.4b | 5.5 | 7.3 |
| Total | |||||||||||
| England | 45+ | 5938 | 21 218 | 192 770 | 55.1 | 88.8 | 202.5 | 554.1 | 6.6b | 6.3 | 7.0 |
| Oxford | 45+ | 243 | 979 | 8210 | 46.5 | 94.3 | 178.1 | 505.1 | 6.5b | 5.6 | 7.3 |
aAge standardized in 5-year age groups, within each of the broader age groups.
bStatistically significant change.
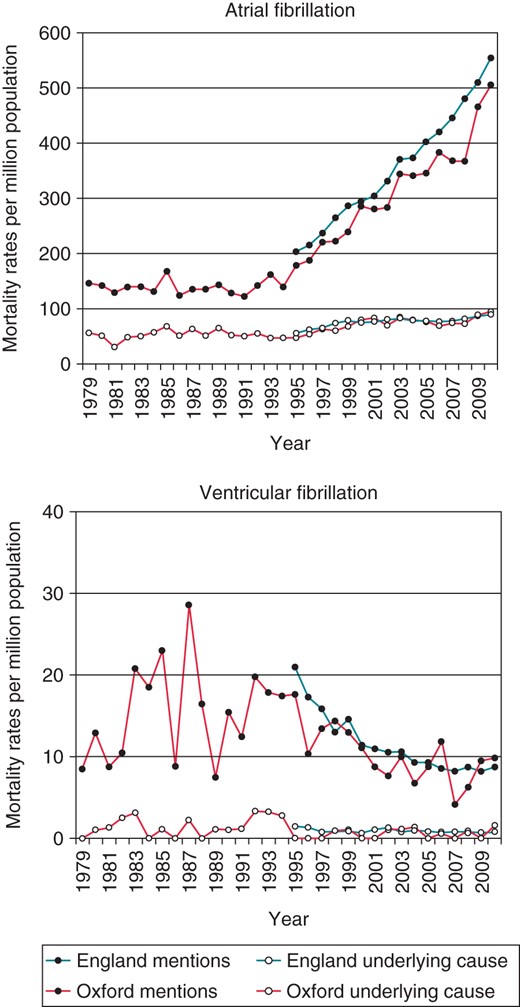
Age-standardized mortality rates for cardiac arrhythmias in England (1995–2010) and Oxford (1979–2010) populations aged 45+.
Age-standardized mortality rates for AF in the Oxford region were broadly unchanged between 1979 and the mid-1990s, whether identified as the underlying cause or as any mentioned cause of death [e.g. the AAPC in mortality rates for mentions of AF for men and women between 1979 and 1994 was 0.0 (CI: −1.0, 1.0)] (Figure 1) (data not in table). From the mid-1990s onwards mortality rates increased steeply (Figure 1). The AAPC for the Oxford region from 1995 to 2010 was almost identical to that in England, at 6.5% (CI: 5.6, 7.3, Table 1), which suggests that the Oxford and the England rates were probably similar before 1995 as well.
Age-specific mortality trends for AF in men and women are presented in Table 1 and Figure 2. The increasing trend of deaths with a mention of AF is similar, but slightly more pronounced, in men than women (with the exception of the AAPC in mortality for women aged 50–54 years, which is based on very low numbers and cannot be considered reliable). It is notable that the trend is seen across most age groups, although the rise in mortality is most pronounced in the population aged 85+ with an AAPC of 8.9% (CI: 8.4, 9.5). The majority of deaths in the population aged 85+ occurred in women: in England between 1995 and 2010, 70 998 women aged 85+ compared with 27 838 men in the same age category had AF mentioned on their death certificate (Table 1). Expressed as age- and sex-specific mortality rates, rates for women aged 85+ were significantly higher than those for men (Figure 2). For instance, in 2010, the underlying cause mortality rates were 1335.9 (CI: 1277.5, 1394.3) deaths per million for men and 2170.7 (CI: 2118.8, 2222.7) for women. For any mention of AF on the death certificate, the respective rates were 9771.0 (CI: 9613.3, 9928.7) and 10 484.6 (CI: 10 370.4, 10 598.8) (Table 1).
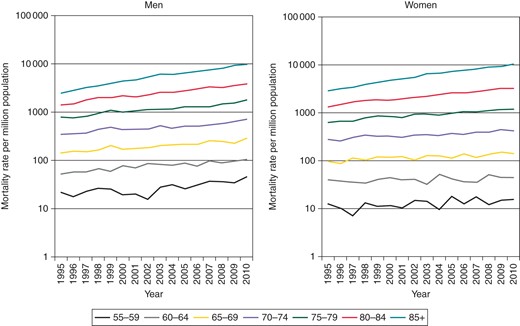
Age-specific mortality rates for AF in England for the population aged 55+ (logarithm scale).
To determine whether the trend of increasing mortality for AF is specific to this condition, rather than a result of increased recording of cardiac arrhythmias on death certificates more generally, we analysed the mortality rates for an unrelated cardiac arrhythmia (ventricular fibrillation) in the same populations over the same time period. In contrast to the trend seen for AF, we found evidence of declining attribution of mortality to this arrhythmia. In England, age-standardized mortality rates for ventricular fibrillation mentioned as any certified cause decreased from 21.0 deaths per million in 1995 to 8.7 deaths per million in 2010.
To investigate whether the increases in the number of cases of AF identified at death is explained by a general tendency to identify a greater number of causes of death over the period studied, we determined the average number of causes of death listed on the death certificates in England, per calendar year, over the ICD-10 period 2001–10. We found a gradual increase from an average of 2.30 (CI: 2.30, 2.31) causes of death per certificate in 2001 (N = 529 605) to 2.61 (CI: 2.61, 2.62) causes of death per certificate in 2010 (N = 491 989) representing a modest, statistically significant, increase of 13.5%.
Conditions associated with atrial fibrillation on death certificates
When AF was recorded as a contributing cause of death the commonest underlying causes of death were stroke, pneumonia, and myocardial infarction (Table 2). When AF was recorded as the underlying cause of death the commonest contributing cause of death was also stroke, followed by heart failure and senility (Table 2).
Conditions associated with AF on death certificates when AF is recorded both as contributing cause of death and underlying cause of death
| The 12 most common conditions given as the underlying cause of death on a death certificate when atrial fibrillation is recorded as a contributing cause of death (N = 22 818) for England 2001–10 | The 12 most common conditions given as the contributing cause of death on a death certificate when atrial fibrillation is recorded as the underlying cause of death (N= 28 721) for England 2001–10 (63 283 causes of death mentioned) | ||||
|---|---|---|---|---|---|
| ICD code | Underlying cause of death | N | ICD code | Other cause of death | N |
| I64 | Stroke unspecified | 3971 | I64 | Stroke unspecified | 11 295 |
| J18 | Pneumonia unspecified | 3259 | I50 | Heart failure | 8091 |
| I21 | Acute myocardial infarction | 2348 | R54 | Senility | 3980 |
| I25 | Chronic ischaemic heart disease | 1906 | J18 | Pneumonia unspecified | 3862 |
| I50 | Heart failure | 1063 | I10 | Essential hypertension | 3150 |
| J40-J44 | COPD | 991 | F01, F03, G30 | Dementia unspecified and vascular, Alzheimer's disease | 3064 |
| I73 | Other peripheral vascular diseases | 713 | I63 | Occlusive stroke | 2218 |
| C34 | Lung cancer | 700 | K55 | Vascular disorders of intestine | 1793 |
| I63 | Occlusive stroke | 601 | E10-E14 | Diabetes mellitus | 1776 |
| J98 | Other respiratory disorders | 533 | I67 | Other cerebrovascular disease | 1619 |
| I67 | Other cerebrovascular diseases | 491 | J69 | Pneumonitis | 1314 |
| F01, F03, G30 | Dementia unspecified and vascular, Alzheimer's disease | 473 | J40-J44 | COPD | 1230 |
COPD, chronic obstructive pulmonary disease.
Discussion
We have shown a marked increase in death rates attributed to AF in England between the mid-1990s to 2010, following a period of little change during the 1980s and early 1990s. In the USA, mortality rates for AF as either the underlying cause, or a contributing cause, of death have also risen although the increase started earlier, in 1980, and has continued.12,13 Demographic changes occurring in England over the past 20 years have resulted in a burgeoning population aged 60 years and over, and a proportion of the increase in AF is attributable to the increasing size of the elderly population. However, given that between 1995 and 2010, age-specific mortality for AF increased in all age groups, the increase in mortality cannot be explained solely in terms of demography, and other explanations must be sought.
In the last 30 years, mortality rates for cardiovascular diseases as a whole have fallen considerably in England.14 This decline in mortality means that patients now surviving these conditions are living long enough to develop AF, and so represent a large, growing, and high-risk population. In addition, recent, increased recognition of the high frequency and severe consequences of complications of AF may have made certifying doctors more aware of the condition, and so more likely to consider the arrhythmia to have been a contributory or underlying cause of death (rather than considering the condition as a fairly benign arrhythmia and omitting to record it on the death certificates).
Lifestyle factors, including alcohol consumption, obesity, diabetes, and hypertension, may also have contributed to the increase in mortality for AF. Alcohol-related deaths tripled in England between 1979 and 199915 and it has recently been estimated that over one-third of adults are drinking above weekly guidelines.16 Consumption of more than two drinks per day in women17 or three drinks per day in men or women18 significantly increases the risk of AF.
Research on the Framingham cohort established that obesity is a risk factor for AF and is partly mediated through left atrial enlargement.19 Over a mean period of 13.7 years, each unit increase in body mass index resulted in a 4–5% increase in AF risk. More importantly, the association remained unchanged even after adjusting for diabetes, hypertension, and myocardial infarction.19 Furthermore, obesity may be an independent risk factor for adverse events in patients with AF.20 As for the trend for AF, obesity has been mentioned as a cause of death on death certificates with increasing (yet still very low) frequency year-on-year in England over the last decade,21 and it has been suggested that the obesity epidemic might be contributing to an increase in the prevalence of AF.22
Diabetes, which increases the prevalence of AF and the risk of stroke associated with AF, has also been certified with increasing frequency as a contributing cause of death in England over the last decade.21 A study of AF in diabetic patients in England established its prevalence at 6.2% in females and 4.5% in males (over the period 1995–99).5 Atrial fibrillation was significantly more prevalent in the diabetic group than the general population. In the USA, the Atherosclerosis Risk in Communities study recently reported a two-fold increased incidence of AF in diabetic compared with non-diabetic participants.23 Furthermore, there was a positive linear association between HbA1c and the risk of AF regardless of diabetic status. In addition, in diabetics (but not their non-diabetic counterparts), levels of fasting glucose were significantly associated with AF.23
We found that mortality rates for AF were higher in men than women in all the 5-year age bands up to age 85. This is in agreement with a higher prevalence of morbidity for AF in men than women.5 The significance of higher mortality for AF in women than men aged 85+ is unclear. It may be explained in part by the fact that there are more very elderly women, in the higher age groups within the 85+ group, than very elderly men. We do not have population denominators for detailed 5-year age bands within the 85+ group. Alternatively, the higher age-specific risk in women than men aged 85+ may be a real elevation in risk. Elderly women with AF have a higher risk than elderly men of sequelae such as ischaemic stroke. It is possible that this is reflected in a higher rate of certification of AF in elderly women than men.24,25
Analysis of the underlying cause of mortality alone would have missed the majority of AF deaths and would have substantially underestimated the scale of their increase (Figure 1). The measures of death rates for AF are important because they relate age-specific numbers to age-specific populations. However, the numbers are important, too, because they give absolute measures of people affected by AF regardless of population denominators. A greater number of deaths were attributed (in whole or in part) to AF in men than in women up to age 75, with a greater number of deaths attributed to AF in women than men in each 5-year band above this (owing partly to the differential survival of men and women in general, and partly to the steepness of the function relating AF prevalence to age). We found that AF contributed to 120 757 female deaths in England over the period studied, compared with 72 013 male deaths. Considering only those deaths occurring before the age of 85, the equivalent figures were 49 759 female deaths, compared with 44 175 male deaths.
We report modest inflation, generally, in the average number of causes of death listed on the death certificates in England between 2001 and 2010 (13.5% aggregate increase over this period). This general increase is too small to account, in itself, for the substantial rise in AF deaths over the same period. We cannot rule out the possibility that the rise in AF is a consequence of a very specific effect of increased recording of AF as a cause of death when present at death. However, because the mortality rates for ventricular fibrillation over the period studied declined, we can be sure that the trend of increasing mortality for AF is not due to a non-specific increase in the recording of cardiac arrhythmias on death certificates. The most likely explanation for at least some of the rise in AF as a certified cause of death is an increase in the prevalence at death of AF deemed to have been life-threatening.
In conclusion, mortality for AF, assessed by the rates for mentions of AF on death certificates, increased steeply in England between 1995 and 2010. The reason for the rise is likely to be multifactorial, with a real increase in the prevalence and lethality of AF at death, perhaps related itself to lifestyle factors, advances in therapeutics for heart disease, and altered perception by certifying doctors of the life-threatening nature of AF, and demographic change all likely contributing factors.
Funding
This work was supported by the English National Institute for Health Research (grant number RNC/035/002). A.P. acknowledges funding support from the British Heart Foundation and the National Institute for Health Research Oxford Biomedical Research Centre Cardiovascular Theme. The views expressed in this article do not necessarily reflect those of the funding bodies.
Acknowledgements
M.E.D. proposed the study. M.E.D. performed the analysis and wrote the first draft. M.E.D., M.J.G., and A.P. interpreted the data. A.P. contributed specialist knowledge. All the authors contributed to the subsequent drafts. We would like to thank Leicester Gill for assistance in analysis of the England dataset and Raph Goldacre for preparation of the artwork.
Conflict of interest: none declared.
