


Abstract
During radiofrequency (RF) delivery, lesion volume is highly dependent on contact force (CF). It has recently been shown that changes of bipolar electrogram (EGM) predict transmurality. We hypothesized that there is a correlation between CF and EGM criteria of transmural lesion (TL) during RF.
We prospectively studied consecutive 512 RF applications from atrial fibrillation ablation procedures. A force-sensing ablation catheter (Tacticath®, Endosense) was used to continuously measure CF and force-time integral (FTI) during each RF application. Distal bipolar EGM was analysed before, during, and after each RF application. Depending on initial EGM morphology, transmurality of lesions was defined by: (i) disappearance of the positivity after RF when there was QR morphology, (ii) diminution >75% of the positivity when there was QRS morphology, or (iii) disappearance of the R′ positivity when there was RSR′ morphology. Electrogram criteria were validated by electrophysiologists blinded to force measurements. Force-time integral was higher in TL than in non-transmural lesions (NTLs): 652 ± 248 vs. 212 ± 140 gs (P < 0.001). Mean CF per RF pulse was higher in TL than in NTL: 26.3 ± 12.5 vs. 11.3 ± 10.3 g (P < 0.001). The best cut-off to predict TL was an FTI ≥ 392 gs [sensitivity 0.89, specificity (Sp) 0.93, positive predictive value (PPV) 0.98, and negative predictive value 0.67] and a higher FTI (>700 gs) warrants transmurality of RF atrial lesions (100% Sp and PPV).
Contact force and FTI during RF are correlated with TL. During RF delivery, a target FTI > 392 gs can be used as an endpoint.
This is the first study to correlate the likelihood of lesion's transmurality as assessed by specific local electrogram modifications during radiofrequency ablation to parameters that are now known as being of prime importance during pulse delivery (contact force and its product with time: the force-time integral).
The results have the potential to strongly impact our practice as using contact force and force-time integral allows some prediction of results.
Besides the fact that these results reinforce the importance of contact force assessment, they can further support electrical modification as a good and simple assessment of lesion transmurality.
Introduction
State-of-the-art radiofrequency (RF) catheter ablation for atrial fibrillation (AF) implies complete and perennial electrical disconnection of the pulmonary veins (PVs).1 The success of the ablation depends upon transmural lesion (TL) creation.2,3 Experimental data show that the quality of the electrode–tissue contact (the contact force; CF) is a major determinant of the depth/size of RF lesions.4–6
Amplitude reduction of bipolar and unipolar electrograms (EGMs) during RF delivery help in assessing lesion transmurality.7–9 A recent study10 described in detail EGM morphological changes as being highly predictive of TL. Nevertheless, artefacts during RF delivery may render EGM morphological changes difficult to assess.
We hypothesized that there is a correlation between electrode–tissue contact parameters (CF and force-time integral; FTI) and bipolar EGM criteria of TL during RF. If correlated with transmurality, establishing cut-off values of CF and FTI may help in efficient lesion creation (i.e. transmural) without excessive energy delivery.
Methods
Consecutive patients ablated for AF using a force-sensing irrigated catheter (Tacticath®, Endosense) were included. All the procedures were performed at the Princess Grace Hospital in Monaco and all patients gave written informed consent. Ablation strategy consisted in circumferential PV ablation with an endpoint of lasso-proven PV isolation (PVI) for paroxysmal AF patients. Additional lesions targeting fractionated EGMs as well as the roof and the left isthmus lines were performed for persistent AF patients.
Ablation procedures were performed in a fasting state, under local anaesthesia and mild intravenous sedation (midazolam 1–4 mg). During RF delivery, pain control was obtained by 10–20 mg intravenous nalbuphine. Heparin was administered to maintain activated clotting times of 300–350 s. Catheters were inserted via the right femoral vein. The Tacticath, a 7-French 3.5 mm open-irrigated tip catheter, has embedded three optical fibres which allow measurement of both the magnitude and direction of the CF; this information as well as the FTI for each RF application are displayed on a dedicated screen (Tactisys, Endosense). The Tacticath was inserted transseptally in the left atrium (LA) via a non-steerable sheath (Fast-Cath SL1, St Jude Medical; SJM). A circular catheter (Lasso 2550, Biosense-Webster Inc.; BW) was also inserted in the LA. A decapolar diagnostic catheter (Inquiry, Irvine Biomedical Inc.) was inserted in the coronary sinus.
Electroanatomic mapping (EnSite NavX, SJM) with image integration was used for each procedure. Radiofrequency was delivered with a Stockert 70 generator (BW) with a 42°C target temperature. Power setting was adjusted between 30 and 35 W for ostial PV ablation (ranging from 10 to 50 W for other locations). The catheter was continuously irrigated at 17 mL/min with 0.9% NaCl. Duration of each RF application was left to the operator's appreciation. Importantly, care was taken to perform each ablation in a point-by-point manner for 20–30 s.
For each of the RF pulses, the cardiac rhythm, the ablation site location, the delivered power, the pulse duration, the delivered endocardial energy, the mean CF, the total FTI, as well as the impedance at the beginning and at the end of RF delivery was recorded.
Electrograms were acquired on a digital electrophysiological recording system (Prucka Engineering, Inc.), with a sampling rate of 1 kHz. Bipolar signals were recorded with a 30–500 Hz filtering and a 50 Hz notch pass. Morphological analysis and measurements of the bipolar EGM on the distal poles of the ablation catheter were performed simultaneously after the procedure by two electrophysiologists blinded to force measurements. Amplification and display speed were optimized. Poor quality EGMs, mainly due to artefacts, were excluded from the final analysis. The first two major positive deflections were defined as R and R′, and the first and second major negative deflections were defined as Q and S, respectively.
All EGM were analysed before and after RF. Their predominant morphology was classified into one of the following patterns: QS, QR, QRS, RS, or RSR′. Were inputted: EGM criteria of transmurality (satisfied/not satisfied), peak-to-peak amplitude, positivity amplitude and negativity amplitude, and R′ amplitude when RSR′ morphology.
Depending on initial distal bipolar EGM morphology, transmurality was defined by the occurrence during RF, and the persistence after RF, of one of the following EGM criteria10: (i) complete disappearance of the positivity when there was initial QR morphology, (ii) diminution >75% of the positivity when there was initial QRS morphology, or (iii) complete disappearance of the R′ positivity when there was initial RSR′ morphology (Figure 1). For moderately fragmented potentials without obvious predominant morphology, complete disappearance of the positivity was considered as a transmurality criterion. We also considered the splitting of the EGM potential during RF as a criterion for TL.11
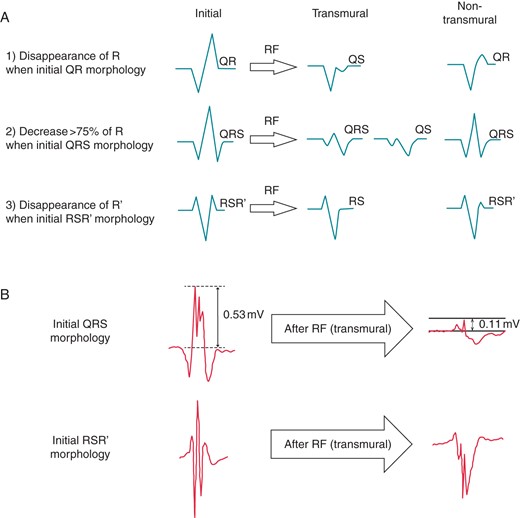
(A) Distal bipolar EGM criteria of TL after RF, depending on initial morphology. (B) Examples of recorded EGMs before and after RF, with different initial morphologies, displayed at 200 mm/s.
Statistical analysis
Statistical analysis was done with Stata 9.1 (Statacorp 2005). All continuous variables are expressed as mean ± SD. Median values are given in box plot diagrams. Two-tailed Wilcoxon t-test was used to compare numerical variables. Continuous variables were compared by analysis of variance and the Bonferroni correction for multiple-comparison test. Non-normal continuous variables were compared using the non-parametric Mann–Whitney–Wilcoxon test. Nominal variables were compared by use of the χ2 test. P < 0.05 was considered significant. The predictive values of different thresholds of CF and FTI for TL were assessed using sensitivity (Se), specificity (Sp), and the receiving operator characteristics (ROC) curves analysis.
Results
Seven patients (six males), aged 49–76 years (median 62.5 years) underwent catheter ablation procedures for paroxysmal AF (five) and long-standing persistent AF (two). A total of 512 point-by-point atrial RF applications were performed (see Figure 2).
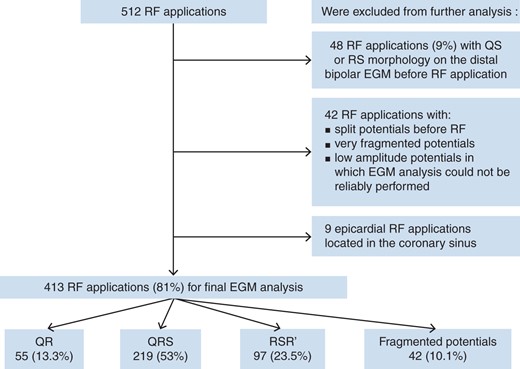
Flow-chart of EGM analysis of all RF pulses.
Forty-eight sites (9%) with QS or RS morphology on the distal bipolar EGM before RF application (favouring pre-existing scar) were excluded from further analysis. We also excluded 42 RF applications with split potentials before RF, or very fragmented/low amplitude potentials in which EGM analysis could not be reliably performed. In addition, nine epicardial RF applications located in the coronary sinus were excluded. In total, 99 of the initial 512 RF pulses were excluded from subsequent analysis.
Among the 413 RF applications (81%) suitable for EGM analysis, 388 were located in smooth atrial portions (LA except the appendage), 25 in pectinated portions (LA appendage). The rhythm was sinus rhythm in 285 (69%) of them, and AF in 128 (31%). Initial EGM morphology at the beginning of each RF application was classified as follows: QR in 55 (13.3%), QRS in 219 (53%), RSR′ in 97 (23.5%), and fragmented potentials in 42 (10.1%) cases, respectively.
Radiofrequency pulse characteristics in transmural vs. non-transmural lesions
Bipolar EGM criteria for TL were fulfilled for 332 RF applications (80%). Force-time integral was significantly higher for pulses resulting in TL than pulses resulting in non-transmural lesion (NTL) (652 ± 248 vs. 212 ± 140 gs, P < 0.001, Figure 3A). Mean CF per RF pulse was also much higher in TL sites (26.3 ± 12.5 vs. 11.3 ± 10.3 g, P < 0.001, Figure 3B). In addition, mean duration of RF applications was slightly higher for pulses resulting in TL (28.6 ± 13.6 vs. 21.9 ± 10.8 s, P < 0.001, Figure 3C). A higher energy per pulse was delivered when TL criteria were fulfilled (950 ± 509 vs. 739 ± 384 J, P < 0.001, Figure 3D).
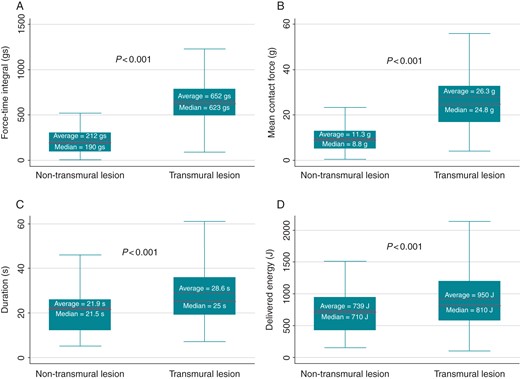
Box plot diagrams with median values for force-time integral (A), mean contact force (B), RF pulse duration (C), and delivered endocardial energy (D), for transmural and non-transmural lesions. Outside values are excluded.
In the TL group, mean delivered energy per lesion decreased with a higher CF (Figure 4). Below 10 g, mean delivered energy in TL was 1590 ± 671 vs. 1430 ± 558 J with a CF of 10–15 g (P = 0.3); 1181 ± 475 J with a CF of 15–20 g (P = 0.02 vs. 10–15 g); 935 ± 298 J with a CF of 20–25 g (P = 0.002 vs. 15–20 g); and 808 ± 302 J with a CF of 25–30 g (P = 0.03 vs. 20–25 g).
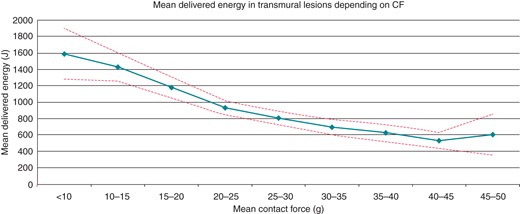
Mean delivered energy per RF pulse in the TL group, depending on the contact force (CF). Dashed lines represent the 95% confidence interval. Mean delivered energy quickly decreases as the CF increases from <10 to 20–25 g. Between 20–25 and 35–40 g, mean delivered energy decreases slowly, whereas it remains stable above 40 g.
However, differences in delivered power between TL and NTL sites did not reach significance (34 ± 6.1 W for TL pulses vs. 32.6 ± 5.7 W for NTL pulses, P = 0.06). Impedance before RF was slightly higher in TL sites (167 ± 14.2 vs. 162.6 ± 14.8 Ω, P = 0.01), but end-pulse impedance was not significantly different (155.2 ± 18.8 Ω for TL pulses vs. 153.6 ± 14.3 Ω for NTL pulses, P = 0.46). The impedance drop was not discriminant for transmurality (9 ± 11.1 Ω for TL vs. 11.8 ± 16.6 Ω for NTL, P = 0.14).
Transmural lesion prediction
Receiving operator characteristics curves were made for FTI, mean CF, RF pulse duration, and delivered energy (Figure 5), for determining the best thresholds to predict TL. Force-time integral had the best prediction value with an area under curve (AUC) of 0.95 (P < 0.001 vs. the other AUC). Mean CF, RF pulse duration, delivered energy, and power had an AUC of 0.87, 0.64, 0.62, and 0.43, respectively.
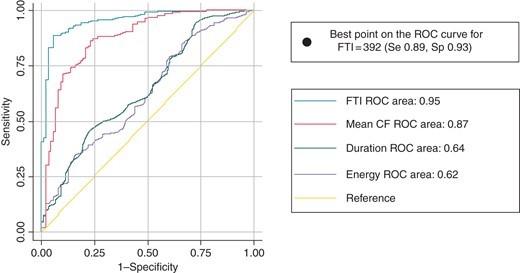
Receiving operator characteristics curves for TL predictability. Force-time integral (FTI) is the best predictor of transmurality with the best area under the ROC curve (in teal) with the value of 0.95. Mean CF curve is in red, RF duration in green, and delivered energy in purple. Among all the curves, the best threshold to predict transmurality is an FTI = 392 with the minimal distance to the best ROC point (Se 0.89, Sp 0.93).
The best threshold to predict transmurality (defined by the minimal distance from the left corner of the ROC space) on ROC curve of the FTI was 392 gs, with a Se of 0.89 and a Sp of 0.93. The positive predictive value (PPV) for TL of an FTI = 392 gs was 0.98, and the negative predictive value (NPV) for TL was 0.67. A higher FTI threshold (700 gs) had 100% Sp and PPV for TL, but a decreased Se (0.39) and NPV (0.3; Figure 6).
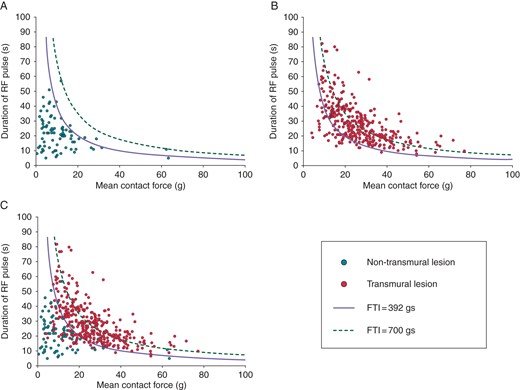
Scatter plots showing duration of the RF pulse over mean contact force, for each non-transmural lesion (NTL) (A), transmural lesion (TL) (B), and both (C). NTL are displayed as red dots and TL as blue dots. The curves for FTI = 392 (continuous line) and FTI = 700 (dashed line) are displayed on each scatter plot. In (A), 93% of NTL dots are underneath the curve of FTI = 392, and all NTL have an FTI < 700 (Sp = 1). In (B), 89% of TL are above the FTI = 392 gs curve. (C) shows both NTL and TL dots.
Smooth portions vs. pectinated portions
Subgroup analysis of RF applications in smooth portions and in pectinated portions showed similar results. No significant differences existed between FTI and CF of TL and NTL, respectively, depending on the atrial wall type.
In smooth portions (LA except the appendage), FTI and CF were greater in TL compared with NTL: 652 ± 248 vs. 208 ± 136 gs for FTI (P < 0.001) and 26.3 ± 12.6 vs. 11.2 ± 10.7 g for CF (P < 0.001), respectively.
In pectinated portions (LA appendage), results were similar: 617 ± 241.3 vs. 193 ± 61 gs for FTI (P < 0.001) and 25.7 ± 12.2 vs. 11.5 ± 5.7 g for CF (P = 0.02), in TL vs. NTL, respectively.
Bipolar electrogram amplitude changes after radiofrequency
Regardless of EGM morphology, FTI was poorly (but significantly) correlated with EGM peak-to-peak amplitude reduction after RF (r = 0.16, P = 0.001), and with EGM positivity reduction (r = 0.36, P < 0.001), but not with EGM negativity reduction (P = 0.95). Mean CF was correlated only with EGM positivity reduction after RF (r = 0.18, P < 0.001). Considering only the 274 initial QR/QRS morphologies, EGM positivity reduction had an improved correlation with FTI (r = 0.44, P < 0.001) and mean CF (r = 0.33, P < 0.001). For the 97 initial RSR′ morphologies, R′ wave reduction after RF had a significant correlation with FTI (r = 0.43, P < 0.001) and mean CF (r = 0.22, P = 0.04).
For all morphologies, RF application duration and delivered endocardial energy were both correlated with EGM peak-to-peak amplitude reduction (r = 0.26, P < 0.001 and r = 0.25, P < 0.001, respectively), EGM positivity reduction (r = 0.17, P < 0.001 and r = 0.13, P < 0.01, respectively), and EGM negativity reduction (r = 0.13, P = 0.01 and r = 0.14, P < 0.01, respectively). Radiofrequency power was neither correlated with EGM global amplitude, positivity, or negativity reduction (P = 0.3, P = 0.09, and P = 0.14, respectively).
Discussion
Our study shows the predictive value of catheter contact to obtain TL. At similar power delivered with an open-irrigated force-sensing catheter, CF and FTI are the best predictors of transmurality of atrial lesions, as defined by the changes of the bipolar EGM.
Mean CF was much higher for RF pulses when transmurality criteria were satisfied (26 vs. 11 g); nevertheless, the intermittent character of the contact (as defined by an oscillating CF with the cardiac cycle), almost always present in a beating heart, is integrated in a more powerful index, the FTI. Experimental data show that an intermittent catheter contact creates equivalent ablation lesions when energy delivery duration is increased.12 In our study, the FTI best predicted transmurality, with a cut-off of 392 gs. A higher cut-off (700 gs) had a 100% Sp for obtaining TL but had a low Se (39%), raising the risk of unnecessary longer RF applications. The clinical implication of this finding is, in our opinion, obvious: while using a force-sensing catheter, very good tissue contact (i.e. >20 g) must be aimed, but does not warrant TL. Since during RF delivery artefacts make EGM changes difficult to assess, a target FTI >400 gs may help operators to guide the RF duration.
The rationale for better RF lesions using higher CF is a larger electrode–tissue contact area, allowing improved RF energy delivery to the myocardium. This point was also suggested in our study by a lower mean delivered energy in TL when using higher CF, reflecting the fact that lower energy is needed to create equivalent lesions when higher CF is applied. Interestingly, we found that above a CF of 35–40 g, there was no further decrease of the mean delivered energy in TL, suggesting an already optimal catheter tissue contact. Accordingly, CF higher than 40 g should probably be avoided because of a higher risk of complications without expected additional benefit.
Advantages of CF monitoring during AF ablation are two-fold. First, it provides additional useful information for safe catheter manipulation.13 In addition, arrhythmia control is best achieved when ablation lesions are delivered with an average CF of >20 g, clinical failure being universally noted for CF <10 g.14 In our TL group, mean CF was 26 g, which supports the hypothesis that clinical results depends upon transmurality of lesions. In the first clinical evaluation of the CF use (the TOCCATA study14), despite complete PVI in all, clinical recurrences were frequent (75%) in patients treated with FTI < 500 gs. In several single-centre evaluations,15,16 use of CF reduced ablation and procedure times for PVI, with a trend towards a decline in acute PV reconnections.
In the EFFICAS I study,17 low FTI at first ablation (357 vs. 708 gs) was predictive of early gap occurrence following PVI; the authors interpreted this phenomenon as indicative of catheter instability and development of oedema. Both of these possible mechanisms translate into a NTL lesion. While human pathology data on transmurality of lesions are lacking, acute ablation lesions on T2-weighted (for oedema) and delayed-enhancement (for necrosis) magnetic resonance imaging following AF ablation were correlated with FTI maps in 3-case report.18 First proof that use of CF and FTI information may optimize lesion creation was brought by the EFFICAS II study:19 by performing ablations with a stable catheter position, a CF > 10 g and a FTI > 400 gs, as well as contiguous lesions creation, PVI at 3 months was significantly improved. All this figures are very similar to ours, suggesting once again the clinical importance of the transmurality of lesions. We obtained similar FTI cut-offs using local scar criteria instead of PVI durability or AF recurrence, which reinforces the legitimacy of our data and provides electrophysiologists a helpful tool in the everyday clinical setting of the electrophysiology lab. Moreover, in EFFICAS studies, reconduction gaps at 3 months after acute PVI have clinical impact, since one-third of the patients with gaps report symptoms, and the quality of life improves in the absence of gaps.20
Since not only CF and time, but also delivered power is important for lesions creation, more complex indices, such as the force-power-time index (FPTI)21 and the lesion size index (LSI)22 have been proposed. Force-power-time index was highly correlated with lesion depth in canine beating heart and was predictive of steam pop.21 Lesion size index best predicted reconnection after PVI in humans (EFFICAS I).22 In our series, programmed power was always the same around PV ostia: 35 W on the anterior wall and 30 W for the posterior wall applications and there was only a trend towards a slightly higher power for TL.
In our study, impedance drop was not predictive of transmurality. Recent experimental data support this finding: while reflecting tissue heating,23 impedance drop was not correlated with lesions depth in an in vivo experimental study with ultrasound real-time visualization of lesion formation.24
Limitations
In Otomo's10 study, another best discriminator (EGM criteria) for TL was, at the parallel sites, the complete abolition of the negative deflection in distal unipolar EGM (Se 100%, Sp 100%). Most of the unipolar EGM (using the Wilson central terminal as indifferent electrode) were of poor quality and therefore not assessed in our study. The bipolar EGM criteria have slightly smaller accuracy in case of QRS morphology (Se 85%, Sp 95%).
One of the greatest limitations was possible catheter's instability. In some cases, this was suspected from illogical EGM changes during the pulse, and those pulses were eliminated from further analysis. Moreover, care was taken to deliver unique lesions on one site, but in case of NTL some new applications were possible since operators aimed to reach the endpoint of PVI.
Morphological EGM changes, as described in Otomo's paper,10 also depend on catheter's orientation; we did not assess orientation (parallel/non-parallel to the atrial wall), but all EGM morphologies of the bipolar signal were analysed (QR in case of non-parallel orientation and QRS or RSR′ in case of parallel orientation). The transmurality criteria described in the Methods section combined all possibilities, and their accuracy is high: the Se and Sp to predict TL would be 100% for both QR and RSR′ morphology, and 85 and 95%, respectively, for QRS morphology. Otomo suggested that applying EGM criteria may help recognizing TL formation and may reduce thermal damage and shorten the ablation and procedure time. Nevertheless, analysing EGM changes during RF delivery is difficult since artefacts are almost always present.
Radiofrequency delivery was performed in an irrigated mode; in this setting, there was a continuous linear increase of the delivered power at the beginning of each pulse, with the programmed power being reached several seconds (up to 10 s) after the beginning of each pulse. Thus, post hoc calculations of FPTI/LSI were impossible.
Finally, a small number (seven) of patients were included in our study. However, as we assessed numerous RF applications, the small number of patients may have only limited impact on the results.
Conclusion
Contact force and FTI are correlated with transmurality of lesions. Before RF delivery, good and stable tissue contact (i.e. >20 g) must be aimed. During RF delivery, a target FTI > 392 gs (if possible 700 gs) can be used as an endpoint for each ablation site, warranting TL.
Acknowledgements
Preliminary results of this study have been presented at HRS annual meeting in May 2012 in Boston, MA, USA (oral presentation, AB13-01).
Conflict of interest: D.G.L.: sponsored research (Endosense); N.S.: sponsored research, board of advisors, shares (Endosense).
References
Author notes
The first two authors contributed equally to this paper.
