


Abstract
After an old myocardial infarction (MI), patients are at risk for reentrant ventricular tachycardia (VT) due to scar tissue that can be accurately identified by late gadolinium enhancement cardiac magnetic resonance (LGE-CMR). Although the ability of LGE-CMR to predict sustained VT in implantable cardioverter-defibrillator (ICD) recipients has been well established, its use to predict monomorphic VT (sustained or not) cycle length (CL) and so, optimize ICD programming has never been investigated.
We included retrospectively 49 consecutive patients with an old MI who had undergone LGE-CMR before ICD implantation over a 4-year period (2006–09). Patients with amiodarone used were excluded. Scar extent was assessed by measuring scar mass, percent scar, and transmural scar extent. The endpoint was the occurrence of monomorphic VT, requiring an ICD therapy or not. The endpoint occurred in 26 patients. The median follow-up duration was 31 months. Scar extent parameters were significantly correlated with the study endpoint. With univariate regression analysis, the scar mass had the highest correlation with the VT CL (R = 0.671, P = 0.0002). Receiver-operating characteristic curve showed that scar mass can predict VT CL (area under the curve = 0.977, P < 0.0001). For a cut-off value of scar mass at 17.6 g, there is 100% specificity and 94.4% sensitivity.
In this observational and retrospective study, scar mass studied by LGE-CMR was specific and sensitive to predict VT CL and so could be a promising option to improve ICD post-implantation programming and decrease appropriate and inappropriate shocks. These conclusions must now be confirmed in a large and prospective study.
We found that scar extent parameters studied by late gadolinium enhancement cardiac magnetic resonance (LGE-CMR) are correlated with ventricular tachycardia cycle length.
This finding could be a new and promising option to optimize implantable cardioverter-defibrillator (ICD) programming.
The utility of LGE-CMR to predict ventricular tachycardias has been established by other studies, but the use to predict ventricular tachycardia cycle length and optimize ICD programming from our knowledge is novel.
Introduction
After an old myocardial infarction (MI) patients are at risk of developing malignant ventricular tachycardias (VTs).1 Implantable cardioverter-defibrillators (ICDs) reduce the risk of post-MI sudden cardiac death (SCD),2 but this beneficial effect is conditional by an optimal programming with a constant challenge which is to avoid inappropriate therapies caused predominantly by supraventricular tachyarrhythmias (SVT). Recently in the MADIT-RIT trial, it was demonstrated that the occurrence of ICD therapy were associated with an increase of all-cause mortality.3 So it was proposed to programme ICD therapies for heart rate of 200 b.p.m. or higher or with a prolonged delay in therapy at 170 b.p.m. or higher.
These post-MI VT are usually due to reentry in the infarct zone and myocardial scar has been demonstrated as a substrate for reentrant VT.4,5 Studies showed that the complex structure of scars (fibrosis, bundles of surviving myocytes) is likely to determine reentrant circuit characteristics.6,7 A canine infarct model of reentrant VT showed that VT cycle length (CL) and scar geometry were highly correlated (R2 = 0.75) and that the measurement of VT CL before electrophysiological study could guide the ablation therapy by estimating scar size and geometry.8 Moreover, histological studies in patients and animal models of acute MI have shown that the duration of coronary artery occlusion is proportionally correlated to the size and transmural extent of myocardial scar.9–11 It was also demonstrated that reperfused MI (with therefore a smaller scar extent) caused shorter VT CL than not reperfused MI (with larger scar extent).12 All these studies suggested a correlation between scar size and VT CL.
Since a few years, attention has been focused on late gadolinium enhancement cardiac magnetic resonance imaging (LGE-CMR), which can accurately and reproducibly identify myocardial scar extent and predict its size and geometry.13,14 The amount and the transmural scar extent on LGE-CMR have been shown to predict overall mortality in patients with coronary artery disease (CAD) and may identify patients at risk for SCD.15–17,18 Recently, the scar size studied by LGE-CMR was recently correlated to VT CL.19 Therefore, its use to predict VT CL and optimize ICD programming has never been investigated. Accordingly, the purpose of this study was to evaluate whether post-implantation VT CL is correlated to scar extent parameters and whether scar characteristics can help to optimize ICD programming in post-MI patients during a long-term follow-up period.
Methods
Study population
The study was conducted in a retrospective observational manner in our Cardiology Department, at the Caen University Hospital (Normandy, France), during a period of 4 years (2006–09), on 66 consecutive patients with CAD who had undergone LGE-CMR prior to primary or secondary preventive ICD implantation. Ethical committee study procedures were in accordance with the Declaration of Helsinki. The study protocol was approved by our institutional review board and patients were also informed before ICD implantation and CMR examination that their data could be used for research studies. We excluded 17 patients who received amiodarone (and others membrane active antiarrhythmic drugs) during follow-up due to the significant VT CL lengthening caused by these drugs.20 Systematically, all patients were also examined by trans-thoracic echocardiography before ICD implantation.
Cardiac magnetic resonance data acquisition
All patients were scanned on a dedicated 1.5T CMR scanner (GE Medical systems). Sequence parameters were as follows: TR = 50 ms; TE = 1.7 ms; flip angle = 55°; slice thickness = 7 mm; matrix size = 256 × 216; field of view = 360–420 mm; 20 images per cardiac cycle. Images were acquired during breathholds of ∼15 s using vector electrocardiogram gating. After initial localizer sequences, a stack of steady-state free precession cine images were acquired in the short-axis plane from the level of the mitral valve annulus to the left ventricular (LV) apex. Contrast-enhanced images were acquired ∼15 min after bolus injection of gadoterate meglumine, Dotarem® 0.15 mmol/kg (Guerbet).
Cardiac magnetic resonance image post-processing and data analysis
All analyses were performed by an experienced cardiologist blinded to clinical and electrophysiological data using the freely available validated cardiovascular image analysis software package Segment v1.9 (http://segment.heiberg.se)21,22 and a previously validated method.15 Short-axis cine images were used to measure end-diastolic volume (EDV), end-systolic volume (ESV), LV mass, and LV ejection fraction (LVEF) by standard methods. Papillary muscles were regarded as part of the ventricular cavity. Scar analysis was performed using short-axis LGE-CMR images. Endocardial and epicardial LV borders as scar tissue were semi-automatically delineated in each LV short-axis slice. We used a binary approach (scar tissue vs. normal myocardium) to characterize scar tissue due to the high reproducibility of this scar quantification method (Figure 1).13,23 Endocardial and epicardial LV borders as scar tissue were semi-automatically delineated in each LV short-axis slice.24 Three aspects of scar were quantified: the percent scar (percentage of the total LV volume), the scar mass, and the transmural scar extent. The percent scar was calculated by summing the absolute amount of hyperenhanced tissue for all LV short-axis slices divided by the total amount of LV tissue. The scar mass was obtained by multiplying the percent scar by LV mass. For the transmural scar extent, scar presence ≥75% was defined as transmural and the number of LV segment was expressed in the standard AHA 17-segment model.25
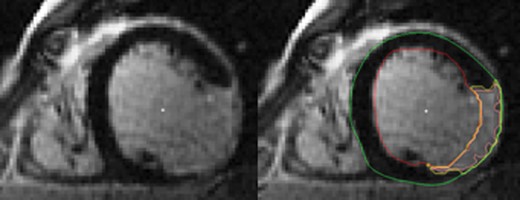
Scar area assessment by LGE-CMR in short-axis orientation. On the right panel, yellow contour indicates scar area, green contour the epicardial border, and red contour the endocardial border. Endocardial and epicardial LV borders as scar tissue were semi-automatically delineated in each LV short-axis slice. Three aspects of scar were quantified: the percent scar, the scar mass, and the transmural scar extent. The percent scar was calculated by summing the absolute amount of hyperenhanced tissue for all LV short-axis slices divided by the total amount of LV tissue. The scar mass was obtained by multiplying the percent scar by LV mass. For the transmural scar extent, scar presence ≥75% was defined as transmural and the number of LV segment was expressed in the standard AHA 17-segment model. LGE-CMR, late gadolinium enhancement cardiac magnetic resonance; LV, left ventricular.
All measurements were repeated in 18 patients by the same observer and by a second observer, blinded to the results of the first analysis, to assess intra-observer and inter-observer agreement.
Implantable cardioverter-defibrillator implantation and details
All patients received an ICD according to international guidelines.26 Some patients were eligible for cardiac resynchronization therapy (CRT) and received a combined CRT defibrillator (CRT-D) device as recommended.27 All manufacturers were represented for either ICD or CRT-D device. Ventricular tachycardia zone was programmed from 171 ± 7 to 217 ± 7/min with antitachycardia pacing (ATP) (burst and/or ramp) and shock therapies. Arrhythmias faster than 217 ± 7/min were assigned to the ventricular fibrillation (VF) zone with maximal shocks as the first-line therapy. The VT detection duration was 14 ± 2 tachycardic intervals out of 20 ± 3 RR intervals and 26 ± 3 tachycardic intervals out of 37 ± 3 RR intervals for VF. Implantable cardioverter-defibrillator programming used during this period (2006–09), while it was current at the time, is now outdated since the results of more recent trials.3
Follow-up, events, and endpoint
Follow-up started at ICD implantation. All patients were followed 1 month after ICD implantation and then every 6 months until 31 December 2011. Patients were instructed to contact the clinic after experiencing an ICD discharge for an additional visit. Appropriate ICD therapy was defined as ATP for VT and/or shock therapy for VT or VF. Implantable cardioverter-defibrillator therapy was classified as inappropriate when triggered by sinus or SVT, T-wave oversensing, or electrode dysfunction. The detection zones of VT were set at mean RR intervals between 520 and 275 ms (117–217 b.p.m.). The measured VT CL was calculated as the mean value of 6 RR intervals before and 6 RR intervals after detection, i.e. a total of 12 intervals. Only the first VT during the observation period was used for the analyses. Detection of monomorphic VT, requiring an ICD therapy or not, was chosen as the study endpoint.
Statistics
Statistical analyses were performed on the R software version 2.14.0 (R Development Core Team). Categorical variables were expressed as percentages (numbers) and compared using Fisher's exact test between the two groups. Continuous variables were presented as mean ± standard derivation and using a Student's t-test, or Mann–Whitney U test, if not normally distributed. The normal distribution of the variables was tested with Shapiro–Wilk test. Given the small number of patients, the absence of linearity and normal distributions, we preferred to use Spearman's correlations based on the value ranks rather than Pearson's correlations to study the relationship between the VT CL and the patient baseline characteristics and scar extent variables. All clinical, electrocardiographical, and CMR variables were assessed in univariate Cox proportional hazards models, but for the sake of clarity only significant or interesting variables were presented in Table 4. Unadjusted and adjusted hazard ratios with their corresponding 95% confidence interval (CI) are reported. Given the absence of normal distribution of the VT CL and the small size of the population, it was not possible to make a multivariate model. A receiver-operating characteristic (ROC) curve was used to evaluate the capability of the scar mass level (corresponding to the most correlated parameter of VT CL in the univariate model) to predict VT CL and the area under the curve (AUC) was calculated. In all analyses, a P≤ 0.01 was considered statistically significant and was preferred to 0.05 to exclude a randomly generated significant difference due to the small number of patients.
Results
Study population
During the study period, 49 patients with new ICD implants for CAD with a LGE-CMR performed prior to device implantation and without amiodarone use were identified. Baseline characteristics were not different in patients either with primary or secondary preventions (Table 1). Patient characteristics are shown in Table 2. In the entire population, the mean age was 61 ± 11 years. Forty-eight (96%) patients were male. Forty-four (90%) patients presented as ST-elevation MI. Patients experienced a MI 8.7 ± 2.5 years before LGE-CMR examination. Twenty-nine patients (59%) underwent coronary revascularization before ICD implantation. All patients had stable sinus rhythm (65 ± 12 b.p.m.), a mean LVEF examined by trans-thoracic echocardiography at 27 ± 8%, and were examined by LGE-CMR within 3.4 ± 1.9 months prior to ICD implantation. Nine patients (18%) received an ICD as secondary prevention; the remaining 40 patients (82%) as primary prevention. A combined CRT-D device was implanted in nine patients (18%). In all patients, LGE-CMR was performed to guide the need for potential revascularization prior to ICD implantation.
Comparison between primary and secondary preventive therapy
| Primary prevention (n = 40) | Secondary prevention (n = 9) | P value | |
|---|---|---|---|
| Age (years) | 61 ± 11 | 62 ± 11 | 0.79 |
| Male gender, n (%) | 39 (97) | 8 (89) | 0.24 |
| NYHA functional class | 1.9 ± 0.7 | 1.9 ± 0.8 | 0.99 |
| Follow-up (months) | 33 ± 21 | 21 ± 17 | 0.09 |
| ICD single chamber, n (%) | 30 (75) | 4 (44) | 0.07 |
| ICD dual chamber, n (%) | 4 (10) | 2 (22) | 0.31 |
| CRT-D, n (%) | 6 (15) | 3 (34) | 0.19 |
| ICD VT: zone lower setting (b.p.m.) | 171 ± 7 | 171 ± 8 | 0.89 |
| ICD VF: zone lower setting (b.p.m.) | 217 ± 6 | 216 ± 9 | 0.58 |
| QRS (ms) | 112 ± 30 | 117 ± 41 | 0.61 |
| LVEF (%) | 22 ± 6 | 26 ± 12 | 0.08 |
| Diabetes, n (%) | 11 (27) | 3 (33) | 0.72 |
| ST-elevation MI, n (%) | 37 (92) | 7 (78) | 0.19 |
| Pre-ICD revascularization, n (%) | 24 (60) | 5 (56) | 0.81 |
| Medication, n (%) | |||
| Beta-blocker | 39 (97) | 9 (100) | 0.63 |
| ACE inhibitor or ATII antagonist | 39 (97) | 9 (100) | 0.63 |
| Statin | 38 (95) | 9 (100) | 0.49 |
| Diuretics | 26 (65) | 5 (56) | 0.59 |
| Aldosterone blockers | 18 (45) | 2 (22) | 0.21 |
| Aspirin or clopidogrel | 39 (97) | 9 (100) | 0.63 |
| Scar mass (g) | 22 ± 9.2 | 18.2 ± 12.1 | 0.23 |
| Percent scar (%) | 11.9 ± 5.6 | 10.9 ± 8.3 | 0.64 |
| Transmural scar extent >75%, n | 13.1 ± 7.7 | 8.3 ± 6.1 | 0.09 |
Continuous data are expressed as mean ± SD and categorical data as n (%).
MI, myocardial infarction; LVEF, left ventricular ejection fraction; ICD, implantable cardioverter-defibrillator; NYHA, New York Heart Association; CRT-D, cardiac resynchronization therapy defibrillator; ACE, angiotensin-converting enzyme; ATII, angiotensin II.
Transmural scar extent is expressed in number of LV segment (n).
Comparison between patients who presented VT or not
| VT (n = 26) | No VT (n = 23) | P value | |
|---|---|---|---|
| Age, years | 61 ± 10 | 60 ± 12 | 0.96 |
| Male gender, n (%) | 25 (96) | 22 (96) | 0.99 |
| ST-elevation MI, n (%) | 24 (92) | 20 (87) | 0.99 |
| Pre-ICD revascularization, n (%) | 12 (46) | 17 (74) | 0.69 |
| ICD indication, n (%) | |||
| Primary prevention | 19 (73) | 21 (91) | 0.77 |
| Secondary prevention | 7 (27) | 2 (9) | 0.77 |
| NYHA functional class | 1.9 ± 0.7 | 1.9 ± 0.7 | 0.97 |
| Hypertension, n (%) | 5 (19) | 11 (48) | 0.55 |
| Diabetes, n (%) | 8 (31) | 6 (26) | 0.99 |
| Device type, n (%) | |||
| ICD single chamber, n (%) | 18 (69) | 16 (69) | 0.99 |
| ICD dual chamber, n (%) | 4 (15) | 2 (9) | 0.99 |
| CRT-D, n (%) | 4 (15) | 5 (22) | 0.99 |
| ICD VT treatment zone lower setting (b.p.m.) | 170 ± 8 | 173 ± 7 | 0.43 |
| ICD VF treatment zone lower setting (b.p.m.) | 216 ± 8 | 217 ± 7 | 0.88 |
| Medication, n (%) | |||
| Beta-blocker | 26 (100) | 22 (96) | 0.94 |
| ACE inhibitor or ATII antagonist | 26 (100) | 22 (96) | 0.94 |
| Statin | 25 (96) | 21 (91) | 0.99 |
| Diuretics | 19 (73) | 15 (65) | 0.99 |
| Aldosterone blockers | 12 (46) | 10 (43) | 0.99 |
| Aspirin or clopidogrel | 26 (100) | 22 (96) | 0.94 |
| QRS duration, ms | 111 ± 33 | 117 ± 34 | 0.79 |
| Left bundle branch block, n (%) | 9 (35) | 8 (35) | 0.99 |
| Right bundle branch block, n (%) | 3 (11) | 5 (22) | 0.98 |
Continuous data are expressed as mean ± SD and categorical data as n (%).
MI, myocardial infarction; ICD, implantable cardioverter-defibrillator; NYHA, New York Heart Association; CRT-D, cardiac resynchronization therapy defibrillator; ACE, angiotensin-converting enzyme; ATII, angiotensin II.
Follow-up and events
During a median follow-up of 31 months (interquartile range 13–49), 26 patients (53%) presented a VT, requiring an ICD therapy or not and 6 patients died (12%). Three patients (6%) presented a VF requiring an ICD therapy. Non-cardiac death was reported in two patients (4%). Cardiac death by end-stage heart failure occurred in four patients (8%). Ventricular tachycardia occurred 20 ± 17 months after ICD implantation. Eight of the 26 patients (31%) were successfully treated by shock following ATP failure or direct shock therapy and 11 patients (42%) were treated with ATP therapy only. Seven patients (27%) presented non-sustained VT and consequently did not require ICD therapy. The mean VT CL was 312 ± 43 ms. Two patients presented inappropriate shocks for rapid SVT during follow-up (290 and 270 ms).
Cardiac magnetic resonance variables
Cardiac magnetic resonance findings are listed in Table 3. There was a non-significant difference in CMR-ICD implantation delay between patients who did and did not present VT. All patients had evidence of scar tissue on LGE-CMR. In the entire population, the mean LVEF was 23 ± 9%. The mean LV mass was 187 ± 43 g, the mean ESV was 202 ± 60 mL, and mean EDV 255 ± 59 mL. The mean distribution of the number of LV segments with transmural (≥75%) scar extent was 7.8 ± 3.6, the mean percent scar was 11.6 ± 6.5%, and the mean scar mass was 20.6 ± 9.8 g.
CMR variables
| VT (n = 26) | No VT (n = 23) | P value | |
|---|---|---|---|
| CMR haemodynamic data | |||
| LVEF, % | 23 ± 8 | 24 ± 10 | 0.54 |
| LV EDV, mL | 267 ± 64 | 241 ± 41 | 0.12 |
| LV ESV, mL | 215 ± 62 | 188 ± 55 | 0.12 |
| LV mass, g | 196 ± 56 | 182 ± 38 | 0.31 |
| LGE-CMR | |||
| Percent scar, % | 12.2 ± 7.2 | 10.8 ± 5.7 | 0.46 |
| Scar Mass, g | 21.8 ± 10.1 | 19.2 ± 9.5 | 0.36 |
| Transmural scar extent >75%, n | 8.3 ± 3.9 | 7.2 ± 3.3 | 0.30 |
Data are expressed as mean ± SD.
LV, left ventricle; LV EDV, LV end-diastolic volume; LV ESV, LV end-systolic volume; LVEF, left ventricular ejection fraction; LV mass, left ventricular mass; LGE-CMR, late gadolinium enhancement cardiac magnetic resonance.
Transmural scar extent is expressed in number of LV segment (n).
All measurements were repeated in 18 randomly selected patients by the same observer and by a second observer, blinded to the results of the first analysis. The intra-class correlation coefficient for scar extent quantification was 0.91 for intra-observer agreement and 0.73 for inter-observer agreement (P < 0.001 for both), demonstrating high reproducibility.
Parameters correlated with ventricular tachycardia cycle length
As depicted in Table 4 and Figure 2, all the scar variables were significantly correlated with the initial VT CL, requiring an ICD therapy or not. Notably, LVEF (R = −0.159, P = 0.439) was not associated with the study endpoint. Patients who received ICD implantation as secondary preventive therapy (n = 7), presented a positive correlation between scar mass and initial VT CL (R = 0.69, P = 0.043) and a positive correlation between scar mass and first recurrent VT (R = 0.62, P = 0.034).
Results of univariate analysis for correlations between VT CL and baseline characteristics, CMR, and scar extent parameters
| R | P value | |
|---|---|---|
| Baseline characteristics | ||
| QRS duration | −0.373 | 0.061 |
| Pre-ICD revascularization | 0.193 | 0.344 |
| CMR parameters | ||
| LVEF | −0.159 | 0.439 |
| LV EDV | 0.302 | 0.133 |
| Scar mass | 0.671 | 0.0002 |
| Percent scar | 0.501 | 0.009 |
| Transmural scar extent >75% | 0.512 | 0.007 |
LVEF, left ventricular ejection fraction; LV EDV, LV end-diastolic volume.
Transmural scar extent is expressed in number of LV segment (n).
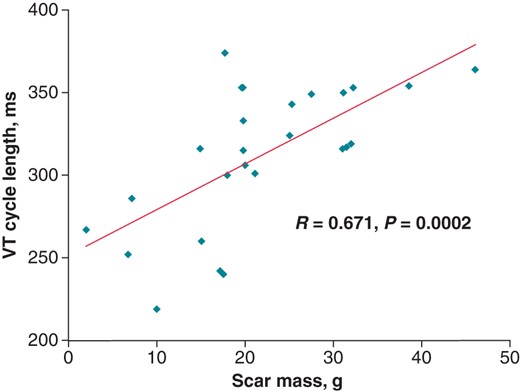
Correlation between the scar mass and the VT cycle length. VT, ventricular tachycardia.
Scar mass as a predictor of ventricular tachycardia cycle length
Figure 3 demonstrates the ROC curve for scar mass as predictor of VT CL [AUC = 0.977, 95% CI (0.927–1), P < 0.0001]. We found a cut-off value of scar mass at 17.6 g with 100% specificity, 94.4% sensitivity, 100% positive predictive value, and 88.9% negative predictive value to have a VT with CL >300 ms in the current study population. Scar mass was chosen, since it was the parameter most correlated with VT CL.
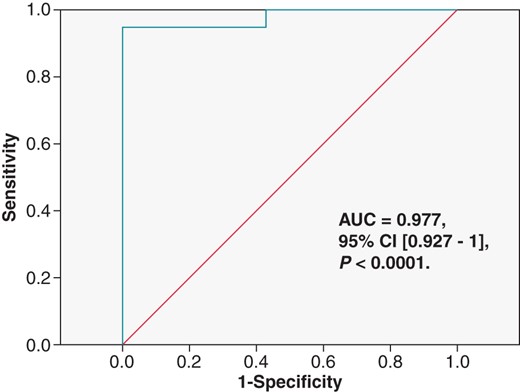
Receiver-operating characteristic curve for scar mass as predictor of VTs cycle length. AUC, area under the curve.
Discussion
Our observational study showed (i) a positive correlation between scar extent variables (scar mass, percent scar, and transmural scar extent) and the VT CL; (ii) that scar mass may be potentially a reliable non-invasive tool to predict post-implantation VT CL (but these preliminary conclusions need to be confirm in a larger and prospective cohort).
Our study hypothesis was based on experimental and clinical models. These post-MI VT are usually due to reentry in the infarct zone and myocardial scar has been demonstrated as a substrate for reentrant VT.4,5 Scar size and geometry are important determinants for the reentrant circuit geometry and may contribute to VT CL.6,7 Moreover, histological studies in patients and animal models of acute MI have shown that the duration of coronary artery occlusion is proportionally correlated to the size and transmural extent of myocardial scar.9–11 It was also demonstrated that reperfused MI (with therefore a smaller scar extent) caused shorter VT CL than not reperfused MI (with larger scar extent).12 This correlation between VT CL and scar extent studied by LGE-CMR has also been demonstrated by Woie et al.19 in 24 CAD patients with an ICD for primary or secondary prevention and LGE-CMR prior to ICD implantation. They showed a positive correlation between scar extent (based on scar border zone quantification) and VT CL (R = 0.614, R2 = 0.342, P = 0.004). They did not study the extent of scar transmurality.
In our study, we preferred using a binary approach (scar tissue vs. normal myocardium) with a study of scar transmurality given the dynamic properties of the peri-infarct zone over time and after a reperfused MI28 and given the high reproducibility of the binary approach compared with the border zone approach.23 In our study, scar quantification failed to predict monomorphic VT occurrence recorded by ICD devices requiring a therapy or not. However, this point is not surprising because in the literature, scar quantification has been demonstrated to predict SCD and prolonged VT requiring therapy by the ICD device,15,17 but the ability of scar extent quantified by LGE-CMR to predict non-sustained VT occurrence is uncertain.
The new insight highlighted in our study is that the scar mass presented a high correlation with VT CL (R = 0.671, P = 0.0002) and as depicted in the ROC curve (Figure 3), can accurately predict VT CL [AUC = 0.977, 95% CI = (0.927–1), P < 0.0001]. For a cut-off value of scar mass at 17.6 g, there is a 100% specificity and a 94.4% sensitivity of having a VT with a CL > 300 ms. In light of these results, the scar mass could be useful in optimizing post-implantation ICD programming after a MI especially in primary prevention. In our study population, for a scar mass <17.6 g, it would seem unwise to programme a VT zone >300 ms due to the low probability of having a slow VT and the risk of inappropriate shocks related to SVT. In this population, a high VT detection and therapy zone can be safe and ‘shock effective’. Conversely, for patient presenting a scar mass >17.6 g, our LGE-CMR criteria are consistent with current standard programming3 suggesting to programme a slow VT zone with a prolonged delay in therapy and an ATP optimization programming to avoid excessive and premature appropriate shocks. If sustained VT occurred, ATP therapy should be promoted and much aggressive ATP setup could be used despite a first series of ATP failures. In this population, in light of our results and based on the current standard programming,3 the VF zone can be higher since high VT rates are unlikely to occur.
In our study population, among patients with appropriate shocks, one patient with a scar mass >17.6 g experienced a slow VT (CL = 310 ms) treated by shock directly whereas in the light of scar mass value indicating a high probability of slow VT occurrence, we could have prolonged the delay of therapy or optimized ATP programming for VT CL > 300 ms and therefore tried to avoid shock delivery. During the follow-up, two patients with a scar mass >17.6 g (respectively, 31.5 and 18 g) experienced an inappropriate shock for rapid SVT detected (respectively, 29 and 270 ms) in the VF zone. These two inappropriate shocks could possibly have been avoided with the help of the scar mass value. Given lower VT detection and therapy zone programming with appropriate discrimination parameters, there would probably have been a chance of successfully classifying the arrhythmia as SVT and thereby avoiding inappropriate shocks.
Avoiding inappropriate device therapy and limiting appropriate therapy (particularly shocks) remain a challenge due to their deleterious effects.3 In a recent study with 636 patients implanted with an ICD for primary or secondary prevention, during follow-up of 22.8 ± 8.8 months, 11% were found to have received inappropriate device therapy, almost half of which could have been prevented by better device programming.29 Numerous strategies have been proposed to reduce appropriate and inappropriate device therapy, such as ATP optimization in the slow VT zone and ATP programming in the VF zone before shock delivery,30 the use of longer detections times,31 or more recently in the MADIT-RIT trial, programming ICD therapies for tachyarrhythmias of 200 b.p.m. or higher or with a prolonged delay in therapy at 170 b.p.m. or higher.3 This latter recommendation would also probably have avoided the two inappropriate therapies and the shock therapy delivered for a slow VT observed in our population, independently of the LGE-CMR results.
Our results are innovative and interesting because if confirmed in a large and prospective study, it could help to refine ICD programming. Figure 4 represents a new proposition to optimize ICD programming to reduce appropriate and inappropriate shocks in patients after an old MI based on our LGE-CMR criteria and on the MADIT-RIT recommendation.3
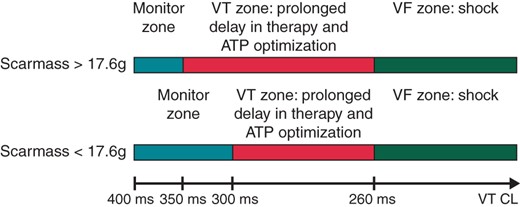
Proposition to optimize ICD post-implantation programming using the scar mass value (proposition that could be used in case of confirmation of our conclusions in a large and prospective study). ATP, antitachycardia pacing; CL, cycle length; VT, ventricular tachycardia.
Study limitation
This study was a retrospective and single-centre study, with a relatively small sample size and a small number of VT, so our conclusions require confirmation in a larger and prospective cohort comparing patients in which ICD programming would be based on the LGE-CMR findings and patients with ICD programming not based in those parameters. The rational of our study is based on the assumption that scar extent parameters are a major determinant of VT CL that is true with homogeneous and dense scars. But scars can also be heterogeneous with an irregular border zone, so anatomically small VT circuits with rapid spin time may be located in the border zone of large infarct scars where functional barriers may determine a major portion of the formed reentrant pathway. Conversely, small infarct scars may contain significant areas of impedance mismatch, where poorly coupled surviving myofibril bundles slow wavefront propagation and lead to long CL. Implantable cardioverter-defibrillator programming used during this period (2006–09), while it was current at the time, is now outdated since the results of more recent trials.3 We considered for analysis only first detected VT in each patient during follow-up, but probably some patients may have presented multiple episodes of VT with different CL. Since we did not perform electrophysiological studies, we cannot be certain of the reentrant mechanism underlying the VT we observed in this study. The high predictive power of scar mass demonstrated in our work could be overestimated compared with real life due to the low number of patients, the post hoc definition of cut-off value for scar mass, the design of the study (single-centre and retrospective study), the software, and the method used. Unfortunately, given the absence of normal distribution of VT CL and the small size of the population, it was not possible to make a multivariate model. Due to the characteristics of cardiac CMR images and to the great variability of the images among patients, it has been shown that LV segmentation was difficult to achieve.32 We tried to minimize this potential bias by performed analysis by an experienced cardiologist. Finally, our sequences did not include coverage of the entire myocardium (just one short-axis slice was missing), so we could possibly have missed small areas of scar.
Conclusion
In study including patients with an old MI and ICDs for primary or secondary prevention, we demonstrated a strong positive correlation between VT CL and scar extent parameters identified by LGE-CMR (particularly the scar mass). Bearing in mind that this work was a single-centre and retrospective study with a small number of patients, assessment of scar extent prior to ICD implantation by LGE-CMR could be a promising and beneficial option to optimize ICD programming and decrease appropriate and inappropriate shock in patients presenting an old MI.
Authors' contributions
J.A. contributed to the study design, data collection, CMR sequence, data analysis and interpretation, and manuscript preparation. E.S. and A.L. contributed to the study design, data analysis and interpretation, and manuscript preparation. A.E.D. contributed to data analysis and manuscript review. A.L. and A.L. contributed to the CMR sequence, data analysis, and manuscript review. V.R., F.L., P.S., S.G., L.C.-R., and P.M. contributed to the study design, data interpretation, and manuscript review. All authors approved the final version of the manuscript submitted.
Conflict of interest: none declared.
