


Abstract
To demonstrate that critical conduction within the cavotricuspid isthmus (CTI) can be directly visualized by voltage gradient mapping and facilitate efficient ablation compared to standard techniques.
Group 1 (1 operator, n = 11) ablated based upon contact voltage measurements and voltage gradient mapping. Ablation targeted low-voltage bridges (LVBs) within the CTI. Repeat maps were obtained following ablation. Group 2 (operators 2, 3, and 4 n = 35) utilized electroanatomic navigation and ablated by the creation of linear lesions from the tricuspid valve to the inferior vena cava. Demonstration of bidirectional block (BDB) was required in both groups. LVB were associated with CTI conduction in all Group A patients. LVB ablation terminated flutter, or created BDB. Following ablation, CTI voltage connections were absent in all patients. Compared with Group B, Group A had less radiofrequency (RF) lesions to atrial flutter (AFL) termination (P = 0.001), less total RF lesions (P = 0.0001), and less total RF time (P = 0.001). Group 1 had no recurrent AFL whereas Group 2 had three recurrences. (follow-up median of 231 ± 181 days).
(i) Voltage gradient mapping visualized regions of critical CTI conduction, (ii) ablation of LVB terminated AFL and resulted in BDB, (iii) repeat mapping confirmed the absence of trans-isthmus voltage, and (iv) Compared with standard ablation, voltage gradient mapping decreases total RF lesions, lesions to AFL termination, and total RF time. Use of voltage gradient mapping can facilitate successful AFL ablation.
Areas of critical conduction through the cavotricuspid isthmus can be directly visualized
Targeting RF ablation to these area results in bidirectional block with less RF lesions and energy when compared with standard techniques
Residual conducting following ablation can be easily identified.
Direct visualization allows successful ablation in patients with unusual anatomy.
Introduction
Atrial flutter (AFL) is a frequent clinical arrhythmia. Much information has been gleaned by electrophysiologic evaluation of AFL, from the studies by Waldo et al.1 and Stevenson et al.2 demonstrating the presence of manifest and concealed entertainment. By identifying the critical regions for AFL conduction, ablation approaches were developed and reported by Feld et al.3 and Cosio et al.4 It became clear that cavotricuspid isthmus (CTI) was critical for the propagation of flutter waves within the right atrium.
Ablation therapy of AFL has become treatment of choice compared to medical management.5 Current guidelines recommend ablation for first episode of AFL (Class IIa), or for recurrent typical AFL (Class I).6 In a large meta-analysis of long-term outcomes for AFL ablation, including 153 studies and 9786 patients, the overall success rate was 94.3%.7 The overall recurrence rate was found to be 8.4%. Recurrence was most likely when the ablation endpoint was termination of AFL without demonstration of bidirectional block (BDB) across the CTI. A number of reports demonstrated the technique and importance of BDB for successful AFL ablation.8–10
The standard approach involves placing an ablation catheter at the cavotricuspid annulus at the 6 o'clock position in an left anterior oblique (LAO) view. The ablation catheter is then drawn back to the vena cava. This process is repeated until BDB is achieved.11 Adjustment of the lesion line either more lateral or more septal may be required because of variations in patient anatomy in order to create complete block across the CTI. Anatomic and microstructural variation has been well described,12 which complicates successful ablation. Incomplete CTI block is associated with a 20–40% recurrence rate while the creation of BDB is associated with a markedly reduced rate of recurrence.13,14
While the standard approach for ablation of AFL is highly successful, anatomic variations can make identification of the critical regions of CTI conduction unclear, and as previously noted, may frustrate the ability to create BDB within the CTI.
We have previously demonstrated that creation of a voltage gradient map (VGM) is useful in visualizing the slow pathway in patients with AV nodal reentry tachycardia (AVNRT).15 By creating a VGM, the slow pathway can be seen as a low-voltage bridge (LVB) connecting the posterior septum to the region of the compact node. Ablation of the LVB associated with the slow pathway successfully terminates and prevents reduction of AVNRT, and also provides a clear end point for AVNRT ablation by demonstrating the absence of any residual LVB. In the present study, we compared standard ablation of AFL to a VGM guided technique. We report that this technique may be utilized to directly visualize the critical connections within the CTI, and permit rapid and successful ablation of AFL with less total radiofrequency (RF) time and RF lesions compared with standard ablation approaches.
Methods
Group 1 (operator 1): 11 consecutive patients with typical isthmus-dependent AFL underwent a four-wire electrophysiology study, including electrodes placed in the coronary sinus (CS), RA, His, and right ventricle (RV). Electroanatomic contact mapping was performed using a 20 pole circular mapping catheter (Reflexion HD, SJM), and three-dimensional (3D) anatomic reconstruction was performed with an Ensite Velocity System (SJM). The collection window was adjusted to exclude ventricular signals by placing the right window at the earliest ventricular activation recorded from the RV electrode or surface electrode. The left window was adjusted based upon the sinus or AFL rate in order to prevent ventricular voltage collection from the previous beat. Data collection in AFL is more complicated because exclusion of concurrent ventricular signals is required. Propagation data can be derived from this methodology provided the ventricular synchronization is stable. Triggering collection based upon the proximal CS is also possible, but care must be given for avoidance beats containing ventricular signals.
To create a voltage gradient map, both the voltage high slider and the low-voltage slider were adjusted dynamically to reveal LVBs within the CTI. This adjustment reveals regions of high voltage in the posterolateral atrium that are connected by a LVB to a high-voltage region around the coronary sinus ostium (CS OS). Data points were reviewed to confirm the validity of the recorded data to exclude premature atrial, junctional, or ventricular beats. Interpolation was set to 10–15 and the interior/exterior projections set to 7–15 mm. Voltage measurements were acquired in sinus rhythm and/or during AFL (when inducible or persistent). An average of 3.7 points per cm2 were acquired. The methodology for this technique was published recently for the visualization of the slow pathway in AVNRT.15
Using an 8 mm non-irrigated ablation catheter lesions were applied to the LVB, until AFL termination, or complete coverage of the CTI LVB. The study end point was the demonstration of BDB across the CTI and a final VGM that demonstrated absence of the CTI associated LVB. Patients had 2–3 VGMs created during the study.
Group 2: (operators 2, 3, and 4) 35 consecutive patients with typical AFL underwent a four-wire electrophysiology study with 3D positional mapping. Ablation across the CTI was performed by placement of linear lesions from the tricuspid valve to the inferior vena cava (IVC) at a 6 o'clock position in an LAO view. Operators 2 and 3 used non-irrigated 8 mm catheters, whereas operator 4 used an open irrigated 8 mm catheter. Lesions were repeated as required until flutter termination and completion of BDB.
Statistical analysis was performed by t-test comparing standard techniques used by operators 2, 3, and 4 (Group 2) compared to operator 1 using VGM (Group 1). Significance was defined by a P value <0.05. A Tukey ANOVA comparison of Group 1 to Group 2 was also performed. In this format, a significant Tukey P value means the data are independent and have homogeneous variance, thus allowing analysis of significance between groups (homoscedasticity).
Results
Comparisons of demographics of the patients are included in Table 1. There were no significant differences between the groups. Except for anti-arrhythmic drug use AF was observed, in 17 of the 46 patients during follow-up and 18 of the 46 patients required anti-arrhythmic therapy following ablation. There was a significant difference comparing Group 1 with Group 2 in anti-arrhythmic use (P = 0.0001). There was no significant difference observed in AF between groups following ablation. Anti-arrhythmic use could have had an effect on the recurrence of AFL but this effect could not be assessed.
Demographics
| Operator | Number | Agea | M/F | Days F/U (median)b | AA drugsc | AFd | Recurrence |
|---|---|---|---|---|---|---|---|
| 1 | 11 | 66 | 10/1 | 343 | 3 | 4 | 0 |
| 2 | 11 | 61 | 10/1 | 181 | 4 | 4 | 0 |
| 3 | 9 | 68.5 | 9/0 | 220 | 0 | 2 | 1 |
| 4 | 15 | 63 | 12/3 | 196 | 11 | 7 | 2 |
| Operator | Number | Agea | M/F | Days F/U (median)b | AA drugsc | AFd | Recurrence |
|---|---|---|---|---|---|---|---|
| 1 | 11 | 66 | 10/1 | 343 | 3 | 4 | 0 |
| 2 | 11 | 61 | 10/1 | 181 | 4 | 4 | 0 |
| 3 | 9 | 68.5 | 9/0 | 220 | 0 | 2 | 1 |
| 4 | 15 | 63 | 12/3 | 196 | 11 | 7 | 2 |
a1 vs. 2, 3, and 4 P = NS
bANOVA P = 0.14 (NS)
c1 vs. 2, 3, and 4 P = 0.0001
d1 vs. 2, 3, and 4 P = NS
During the follow-up period, no recurrent AFL was seen in Group 1; but was observed in three patients in Group 2. However, the number of patients is not sufficient to provide a statistical comparison and therefore, the influence of technique on AFL recurrence could not be assessed.
Successful termination of AFL was achieved in all patients with sustained AFL regardless of the approach used. BDB was confirmed by pace mapping from the CS OS and lateral right atrium in both groups following ablation.
No complications were observed during the procedure or during follow-up. One patient from operator 3 died during follow-up, unrelated to cardiac causes.
Specific results in Group 1
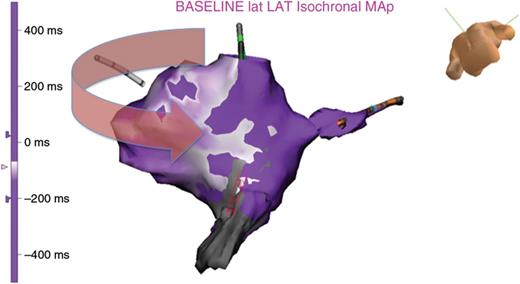
In all patients, VGM demonstrated conduction across the CTI via an LVB. The anatomic relationship is demonstrated in Figure 1. The CTI LVBs could be oriented either perpendicular to the tricuspid annulus (Figure 2A), parallel to the tricuspid annulus (Figure 2C), or both (Figure 3).
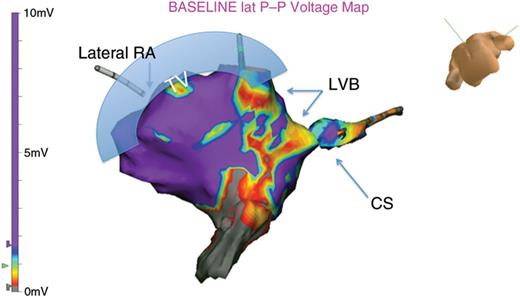
The anatomic relationship is displayed. In a caudel veiw, the tricuspid annulous is observed at the superior margin to the left of the image. The CS OS is observed to the right. The VGM shows high-voltage regions as purple, with LVBs seen as red and yellow. These LVBs are typically oberserved bridging high-voltage regions.
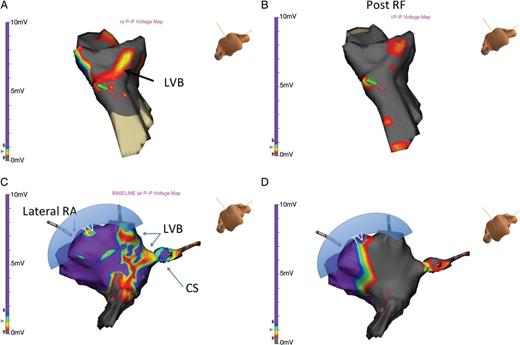
(A) A LVB is identified across in the lateral atrium to the CS region. This LVB outlines the path through the CTI and is perpendicular to the tricuspid annulus. (B) Following ablation, marked changes in voltage measurements are observed. No LVB is seen within the CTI, and BDB is achieved. (C) In this patient, the critical link is seen as a LVB that is parallel to the typical CTI associated LVB demonstrated in 2A. (D) Following ablation, no further voltage connection remains, confirming complete block along the CTI. BDB was observed.
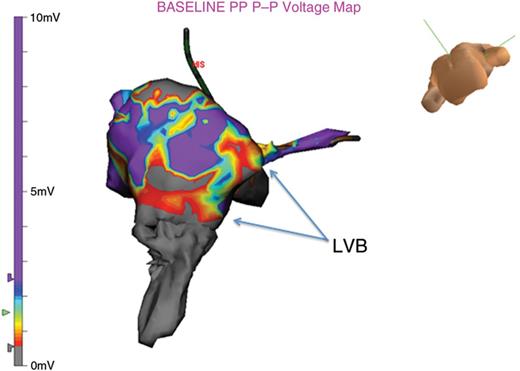
At times there are multiple LVB connections within the CTI. In this example there are three observed.
Following lesion placement, a repeat VGM documented the absence of LVB connection in the region of the CTI (Figures 2B and D). The absence of the CTI associated LVB correlated with the presence of BDB determined by CS and lateral RA pacing. If a residual LVB was observed within the CTI, BDB was not demonstrated, and repeat ablation was performed on the remaining LVB (see Figure 4).
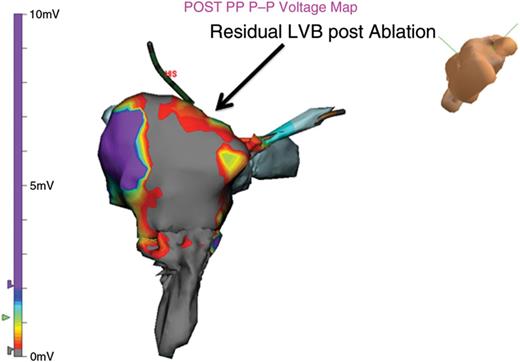
A residual LVB is found immediately following ablation. BDB is initially observed, despite the presence of a residual CTI LVB. Repeat pacing 10 min later, demonstrated recurrent CTI conduction. Permanent BDB required ablation of the residual LVB.
Propagation maps obtained during AFL confirm the activation front moved through the CTI via the associated LVB (Figure 5).
A propagation map is made during AFL, demonstrating penetration from the high-voltage region into the LVB connection. The corresponding VGM is displayed.
Voltage gradient map compared to standard approaches
Compared to standard approaches, Group 1 had less RF lesions required to terminate AFL, 5.8–20.4 s P = 0.001 (see Table 2).
Comparison of groups
| Group 1 | Group 2 | P value | Tukey valuea | |
|---|---|---|---|---|
| Lesions termination | 5.8 ± 4.1 | 20.4 ± 15.7 | 0.001 | 0.0012 |
| Total lesions delivered | 14.2 ± 9.8 | 28.6 ± 12 | 0.001 | 0.009 |
| Total RF time (seconds) | 451.1 ± 202.6 | 1194 ± 517.8 | 0.0001 | 0.009 |
| Total fluoroscopy time | 27.1 ± 9.9 | 28.2 ± 13 | 0.56 (NS) | 0.04 |
| Total case time (minutes) | 119 ± 63 | 127 ± 53 | 0.7 (NS) | (NA) |
aTukey value: the observations are independent and there is equal variation across observations (homoscedasticity).
Group 1 also had less total lesions given compared to standard approaches, 14.2–28.6 s P = 0.0001 (see Table 2).
The total lesion time was significantly decreased in Group 1 compared to the standard approach, 425.5–1194 s P = 0.001 (see Table 2).
Total fluoroscopy time was not significantly different between Group 1 compared to standard techniques (see Table 2).
Total case time was not affected by the use of voltage gradient mapping compared to standard techniques (see Table 2).
Discussion
In the present study, we report our results using a technique that enables direct visual identification of critical regions of CTI conduction. Compared to standard ablation techniques, VGM results in decreased RF lesions and total RF time.
In addition, the CTI associated LVB was easily identified in both sinus rhythm and in AFL. Since the VGM represents the underlying atrial substrate, it is independent of the rhythm during which the voltage is measured. While the absolute voltage may differ, by using VGM, the voltage adjustment allows clear identification of the LVB regardless of the underlying rhythm.
The anatomy of the CTI can be complex. In large histological review of the anatomy within the CTI, Gami et al.12 demonstrated large variability within the posterior boundary of the cristae terminalis (CT), including medial insertion of the pectonate muscles in 54% with another 19% have a secondary ridge creating a second the CT. Pectonate muscles extended to the CTI in 70% of patients. Of importance was also the presence of a sub-eustation pouch in 16% of patients that observed on the septal side of the CTI. Tai and Chen16 reported the quadrilateral area of the CTI formed by the eustation valve, a line connecting the IVC and TV, and the TV. In the majority of patients the region anterior to the IVC (64%) is primarily formed of fibrous and fatty tissue; muscular bands primarily form the middle portion of the quadrangle interspersed by thin membranes (64%). A third sector near the TV is composed of smooth tissue. These anatomic and microstructural variations have a significant impact on the success of ablation based upon the anatomic approach, since more lateral or more septal ablation may be required for successful BDB.
Several methodologies have been proposed for improving efficiency and success of AFL ablation. In a trial comparing maximal voltage-guided (MVG) ablation compared to purely anatomic ablation, 69 patients were randomized. The results suggested that maximal voltage-guided therapy reduced ablation time: 5.9 vs. 11.2 min. In addition, the average number of lesions were reduced from 14.2 to 7.9.17 Other studies have also evaluated MVG and found relative outcome improvement compared to standard techniques.18 Previously, minimal voltage-guided ablation was evaluated by Hall et al.19 in which the anatomic approach was compared to ablation of low-voltage regions within the CTI. This study found no difference between the approaches. However, the low-voltage levels were limited to 1.2 mV and were not adjusted for the identification of LVB as performed in the present study. None of the previous studies created 3D voltage maps.
In the present study, the total number of RF lesions required to achieve BDB was 14.2 with a total energy of 7 ± 3.4 min using VGM compared to 28 lesions and 19.9 ± 10.1 min using standard techniques (P = 0.0001). Creation of a voltage gradient map permitted more precise localization of critical points of conduction through the CTI. In additiona, the ability to directly visualize these LVBs allows confirmation of successful BDB as well as the ability to visualize where further ablation is required for completion of the ablation.
For the most part, the CTI-associated LVB was consistent with the expected anatomic position of the CTI, although in some patients, residual LVB was observed around the CS or lateral RA. In such patients, the VGM directed ablation to that region in order to complete the successful ablation of the CTI.
The absence of a residual LVB following ablation correlated with BDB. However, BDB may be present transiently because of localized tissue injury and reoccur during the waiting period or during follow-up. In such patients, the VGM often shows a residual CTI LVB before it is observed electrophysiologically. This finding was observed in one of our patients where electrophysiologic block was present but and residual LVB was observed. The presence of the LVB appeared before recurrence of bidirectional conduction was detected within the CTI (see Figure 2C). Ablation of the residual CTI LVB resulted in permanent BDB.
The ability to visually identify the conducting pathway through the CTI has several advantages:
Direct localization of the CTI LVB provides a clear target that is not just anatomically based.
In patients with unusual anatomy, the visualization provides certainty regarding the critical limb of the circuit.
Following ablation, the elimination of the CTI LVB confirms the success of the ablation independent of whether BDB is achieved.
Residual CTI LVB, which suggests CTI conduction recovery, and thus, should be ablated to prevent early recovery.
Compared to standard techniques, VGM significantly decreases the number of RF lesions and total energy delivered required to create BDB in patients with AFL.
Limitations
Detection of the CTI associated LVB is contingent upon accurate contact voltage data. As a result, careful review of the data points is essential to exclude catheter artefact, premature atrial beats, or measurements from the right ventricle.
In addition, creation of the atrial, CS, and IVC geometry is important to ensure an accurate portrayal of the CTI. If the geometry or voltage points do not reflect the true atrial substrate, the utility of the VGM created will be severely impaired.
Because there was no randomization between providers, the possibility of skill could influence the results. However, all the operators had similar time in practice, similar patient loads, and similar ablation outcomes; it was felt that the standard technique was fairly representative of current clinical practice. Clearly a randomized clinical trial will be necessary to definitively answer that question, as well as, a larger study to examine long-term outcomes. The present study demonstrates proof of concept and encouraging results that should stimulate further study.
The present study had insufficient enrollment to demonstrate a significant difference in AFL recurrence rates, and therefore, a larger multicentre trial would be necessary to clarify the efficacy between VGM-guided or standard procedures.
Conclusions
In the present study, voltage gradient mapping was utilized for direct visualization of CTI conduction. By allowing the electrophysiologist to clearly define the CTI associated LVB, ablation therapy can be efficiently and effectively performed. This may be especially important in patients with challenging anatomy, where standard anatomic approaches fail. In such cases, identification of and visualization of residual critical regions of conduction within the CTI would be immensely helpful. Compared to standard techniques for AFL ablation, the overall success is not significantly affected. Regardless of the technique used, CTI ablation is very effective in treating isthmus-dependent AFL. However, in the present study, use of VGM decreases the number of lesions to terminate AFL, decreases the total number of RF lesions required to create BDB through the CTI, and decreases the total RF time required for successful ablation. In additiona, the absence of the CTI associated LVB following ablation, provides an additional endpoint to the procedure, and is an independent indicator of successful AFL ablation. For these reasons, voltage gradient mapping should be considered a valuable adjuvant to AFL ablation.
Conflict of interest: S.J.B. was advisory board member of St Jude Medical.
