-
PDF
- Split View
-
Views
-
Cite
Cite
Stefanie Hillebrand, Karin B. Gast, Renée de Mutsert, Cees A. Swenne, J. Wouter Jukema, Saskia Middeldorp, Frits R. Rosendaal, Olaf M. Dekkers, Heart rate variability and first cardiovascular event in populations without known cardiovascular disease: meta-analysis and dose–response meta-regression, EP Europace, Volume 15, Issue 5, May 2013, Pages 742–749, https://doi.org/10.1093/europace/eus341
Close - Share Icon Share
Abstract
Heart rate variability (HRV) is associated with cardiovascular disease (CVD) in individuals with known CVD. It is less clear whether HRV is associated with a first cardiovascular event. Therefore, we performed a meta-analysis to study the association between HRV and incident cardiovascular events in populations without known CVD.
We performed a meta-analysis and dose–response meta-regression of studies assessing the association between HRV and CVD. We searched Pubmed, Embase, Web of Science, Cochrane library, ScienceDirect, and CINAHL up to December 2011 for eligible studies. We selected studies that used the standard deviation of the normalized N–N interval (SDNN), low-frequency (LF) or high-frequency (HF) spectral component as a measure of HRV. Primary outcomes were (non)fatal cardiovascular events. Eight studies with a total number of 21 988 participants were included. The pooled relative risk (RR) comparing the lowest level to the highest level of SDNN was 1.35 (95% CI 1.10, 1.67). The pooled RRs for LF and HF were 1.45 (95% CI 1.12, 1.87) and 1.32 (95% CI 0.96, 1.81), respectively. In a meta-regression, the predicted RR of incident CVD of the 10th and 90th HRV (SDNN) percentiles compared with the 50th percentile were 1.50 (95% CI 1.22, 1.83) and 0.67 (95% CI 0.41, 1.09).
In conclusion, low HRV is associated with a 32–45% increased risk of a first cardiovascular event in populations without known CVD. An increase in SDNN of 1% results in an ∼1% lower risk of fatal or non-fatal CVD.
Introduction
Cardiovascular disease (CVD) is one of the main causes of morbidity and mortality in industrialized countries. Cardiac autonomic dysfunction is a risk factor for the development of CVD that can be measured non-invasively using heart rate variability (HRV).1 Physiologically, HRV is thought to be the result of adaptive changes in heart rate caused by the sympathetic and parasympathetic nervous system, with the purpose to buffer blood pressure.2 Less compensatory change (low HRV) suggests a decreased adaptive autonomic nervous system and is thought to be associated with increased morbidity. Heart rate variability has long been known to be associated with morbidity and mortality after myocardial infarction.3 This finding has been confirmed in many studies.4,5 Besides acute myocardial infarction and cardiac death, occurrences of congestive heart failure and arrhythmias have also been associated with reduced HRV.6,7
Although HRV is associated with cardiovascular events in individuals with known CVD, fewer studies have been published on the association between HRV and the risk of CVD in a population without known CVD. Therefore, the aim of this meta-analysis was to assess the association between HRV and CVD in individuals without known CVD at baseline.
In this meta-analysis, low heart rate variability (HRV), measured as standard deviation of the normalized N-N interval (SDNN), is associated with approximately 40% increased risk of a first cardiovascular event in populations without known cardiovascular disease (CVD).
Meta-regression shows that a 1% increase in SDNN results in an approximately 1% lower risk of fatal or non-fatal CVD.
The association between HRV and first cardiovascular event was depended on duration of measurement.
Methods
Search strategy
A systematic literature search was performed, aimed at identifying epidemiological studies with data on the association between HRV and CVD. We searched the electronic databases Pubmed, Embase, Web of Science, Cochrane library, ScienceDirect and CINAHL from their inception up to December 2011. No language restriction was set in advance. The reference lists of all the relevant identified articles were screened for additional potentially relevant articles.
Eligibility criteria
Initial selection of studies by title and abstract was performed by two reviewers (S.H. and K.B.G.) independently. Disagreements were resolved by consensus. Population-based studies in adults assessing the association between HRV and CVD were eligible for inclusion. Abstracts of meetings and unpublished results were not eligible. Since the aim of the study was to assess the association between HRV and incident CVD, cohorts restricted to patients with CVD at baseline were excluded. Furthermore, we did not include studies in our meta-analysis if they presented a measure of HRV that was only used in one or two studies. To be included, studies should have expressed the association between HRV and CVD as relative risks (RRs) (risk ratios, odds ratios, or hazard ratios). Maximally adjusted RRs and confidence intervals (CIs) for the association between HRV and CVD were extracted. Data were extracted in duplicate (S.H. and K.B.G.), using a standard data extraction sheet.
Measures of heart rate variability
Heart rate variability can be expressed using several measures. In order to calculate different measures of HRV, intervals between adjacent normal R waves (NN intervals) are measured. The standard 12-lead electrocardiogram is a common method to measure these intervals. In the time-domain analyses, a variety of statistical variables are calculated from N–N intervals. The most commonly used time-domain variables are the standard deviation of all N–N intervals (SDNN) and the square root of the mean of the sum of the squares of differences between adjacent R–R intervals (RMSSD).8
The frequency domain is another method used to calculate HRV, of which the low-frequency (LF) and the high-frequency (HF) spectral components are common measures. In the frequency-domain method, cyclic fluctuations of RR intervals are quantified by the frequency of the fluctuation using Fourier transformation or auto regression spectral analysis.1 Typically, HF fluctuations are thought to be caused by respiration and are effectuated by parasympathetic outflow. Low-frequency fluctuations are probably the result of a blood pressure resonance phenomenon mediated by the baroreflexes and are effectuated by both sympathetic and parasympathetic fluctuations in outflow.2,9
Study endpoints
The outcome of interest was the occurrence of a first fatal or non-fatal cardiovascular event. In this meta-analysis, we defined fatal or non-fatal CVD as myocardial infarction, coronary revascularization procedures, hospitalization for unstable angina pectoris, congestive heart failure, arrhythmia (atrial/ventricular), arterial peripheral vascular disease, stroke (ischaemic/haemorrhagic), or death from these events.10
Risk of bias assessment
For the aim of the present meta-analysis, the risk of bias assessment focused on design elements that could potentially bias the association between HRV and CVD: (i) ascertainment that the outcome of interest was not present at baseline, (ii) adequacy of follow-up (loss-to-follow-up of <5% was considered adequate), (iii) effect estimates having been adjusted for potential confounding factor, (iv) adequacy of endpoint verification. Endpoint verification was considered adequate when diagnoses were confirmed using medical records or death certificates. Self-report was considered to present a high risk of bias.
Statistical analyses
According to the data available in included articles, HRV was categorized based on percentiles (median, tertiles, or quartiles). When papers presented their results using an author-defined cut-off value, we calculated the accompanying percentiles under the assumption of a normal distribution of HRV. If authors calculated RR for one SD change in HRV, we recalculated this RR for categories based on quartiles assuming a normal distribution of HRV and a linear association on a logarithmic scale between HRV and CVD. For each study the highest HRV category was used as the reference, and for all studies the lowest HRV category was compared with the highest category. We performed a random effects meta-analysis based on maximally adjusted RRs of the highest vs. the lowest categories and their accompanying standard error. Heterogeneity was quantified using the I² statistics. We performed two sensitivity analyses: one excluding populations with only diabetes patients and one separating the different measurement durations of HRV (short measurements of 10 s to 3min vs. longer measurements of 24h).
Secondly, we performed a meta-regression to assess a dose–response slope for the association between HRV and CVD. We used a random effects model to take the between-study variation into account. For each individual study, a weight was calculated based on the standard error. The 50th percentile was used as the reference category.11 Based on the slope from the random effects regression, we predicted risk ratios comparing the 10th and the 90th percentile to the 50th percentile. Statistical analyses were performed with Stata Statistical Software (Statacorp, USA), version 12.
Results
Literature search
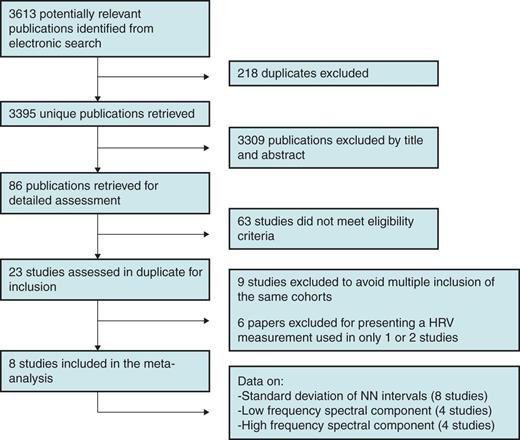
We identified 3613 publications by database search (PubMed, n = 2062; EMBASE, n = 516; Web of Science, n = 83; ScienceDirect, n = 9; CINAHL, n = 152; Cochrane, n = 791). After checking for duplicates, we retrieved 3395 unique publications. After screening of title and abstract, 3309 studies were excluded and 86 papers were retrieved for detailed assessment. Sixty-three papers did not meet the eligibility criteria, 23 studies were assessed in duplicate for inclusion. Of these papers, several were based on the same cohort. Four papers were based on the ARIC study12–15, two on the Framingham Heart study16,17, three on the Cardiovascular Health study18–20, three on the Ohasama study,21–23 and two on a cohort from Finland.24,25 To avoid multiple inclusions of the same study subjects, for each study we only included the paper with the largest sample size in our meta-analysis. As a result, nine papers were excluded. Furthermore, six studies were excluded because they presented a measure of HRV that was only used in one or two studies.23,26–30 Finally, a total of eight studies were included in this meta-analysis that used SDNN, LF, or HF as a measure of HRV (Figure 1).
Study characteristics
Characteristics of the included studies are presented in Table 1. All included studies were prospective cohort studies. Two cohorts presented data separately for diabetics and non-diabetics.15,31 A total of 21 988 participants were included in the analyses. The size of the study populations ranged from 159 to 11 647.15,31 The percentage of women varied from 0 to 64%.32,33 Mean follow-up duration ranged from 3.5 to 15 years.17,32 Four studies defined their endpoint as cardiovascular death.25,32–34 Other studies used a combined endpoint, namely: congestive heart failure, hospitalization for angina pectoris, and cardiovascular death;17 MI, coronary revascularization, and cardiovascular death;15 MI, arterial peripheral vascular disease, stroke, congestive heart failure, hospitalization for angina pectoris, and cardiovascular death;20 and MI, coronary revascularization, arterial peripheral vascular disease, stroke, and cardiovascular death.31
| . | Study population . | Measure of HRV . | Duration of measurement . | Endpoints . | N . | Mean follow-up (year) . | Women (%) . | Age range (year) . | Adjusted for . |
|---|---|---|---|---|---|---|---|---|---|
| Kop 2010 | Cardiovascular Health Study, USA | SDNN, LF, HF | 24 h | MI, per. vasc., stroke, CHF, hosp. AP., and cardiovasc. death | 908 | 13.3 | 59 | 62–80 | Not adjusted |
| Liao 2002 | Atherosclerosis Risk in Community Study, USA | SDNN, LF(nu), HF(nu) | 2 min | MI, cor. revasc., and cardiovasc. death | 11 647 | 8 | 42 | 48–60 | Age, sex, ethnicity, centre, smoking, mean heart rate |
| Gerritsen 2001 | Hoorn Study, the Netherlands | SDNN, LF, HF | 3 min | MI, cor. revasc., per. vasc., stroke and cardiovasc. death | 159 | 7.9* | 52 | 57–71 | Age, sex, glucose tolerance status |
| Makikallio 2001 | General population Turku, Finland | SDNN | 24 h | Cardiovasc. death | 232 | 10 | 47 | ND | Age, sex, CHF, VES, previous MI, AP cardiac medication |
| De Bruyne 1999 | Rotterdam Study, the Netherlands | SDNN | 10 s | Cardiovasc. death | 5272 | 4 | 60 | 60–78 | Age, sex, DBP, BMI, DM, negative T-waves, mean R–R interval, Q–Tc interval |
| Dekker 1997 | Zutphen Study, the Netherlands | SDNN | 30 s | Cardiovasc. death | 878 | 15 | 0 | 40–60 | Age, BMI, SBP, total cholesterol, smoking |
| Bernstein 1997 | The Bronx Ageing Study, USA | SDNN | 10–40 RR intervals | Cardiovasc. death | 391 | 8.5 | 64 | 75–85 | Age, sex, DM, hypertension, smoking, history CVD, BMI, cancer, cholesterol, self-health index, medication |
| Tsuji 1996 | Framingham Heart Study, USA | SDNN, LF, HF | 2 h | MI, CHF, hosp. AP. and cardiovasc. death | 2501 | 3.5 | 56 | 26–53 | Age, sex, SVP, smoking, DM, SBP, LVH, medication |
AP, angina pectoris; BMI, body mass index; cardiovasc. death, cardiovascular death as defined by authors; CHF, congestive heart failure; cor. revasc, coronary revascularization procedures; CVD, cardiovascular disease; DBP, diastolic blood pressure; DM, diabetes mellitus; HF, high-frequency spectral component; hosp. ap, hospitalization for angina pectoris; LF, low-frequency spectral component; LVH, left ventricular hypertrophy; MI, myocardial infarction; ND, not defined; nu, normalized units; per. vasc, arterial peripheral vascular disease; SBP, systolic blood pressure; SDNN, standard deviation of N–N intervals; SVP, supraventricular premature beats; VES, ventricular extra systoles; *, median.
| . | Study population . | Measure of HRV . | Duration of measurement . | Endpoints . | N . | Mean follow-up (year) . | Women (%) . | Age range (year) . | Adjusted for . |
|---|---|---|---|---|---|---|---|---|---|
| Kop 2010 | Cardiovascular Health Study, USA | SDNN, LF, HF | 24 h | MI, per. vasc., stroke, CHF, hosp. AP., and cardiovasc. death | 908 | 13.3 | 59 | 62–80 | Not adjusted |
| Liao 2002 | Atherosclerosis Risk in Community Study, USA | SDNN, LF(nu), HF(nu) | 2 min | MI, cor. revasc., and cardiovasc. death | 11 647 | 8 | 42 | 48–60 | Age, sex, ethnicity, centre, smoking, mean heart rate |
| Gerritsen 2001 | Hoorn Study, the Netherlands | SDNN, LF, HF | 3 min | MI, cor. revasc., per. vasc., stroke and cardiovasc. death | 159 | 7.9* | 52 | 57–71 | Age, sex, glucose tolerance status |
| Makikallio 2001 | General population Turku, Finland | SDNN | 24 h | Cardiovasc. death | 232 | 10 | 47 | ND | Age, sex, CHF, VES, previous MI, AP cardiac medication |
| De Bruyne 1999 | Rotterdam Study, the Netherlands | SDNN | 10 s | Cardiovasc. death | 5272 | 4 | 60 | 60–78 | Age, sex, DBP, BMI, DM, negative T-waves, mean R–R interval, Q–Tc interval |
| Dekker 1997 | Zutphen Study, the Netherlands | SDNN | 30 s | Cardiovasc. death | 878 | 15 | 0 | 40–60 | Age, BMI, SBP, total cholesterol, smoking |
| Bernstein 1997 | The Bronx Ageing Study, USA | SDNN | 10–40 RR intervals | Cardiovasc. death | 391 | 8.5 | 64 | 75–85 | Age, sex, DM, hypertension, smoking, history CVD, BMI, cancer, cholesterol, self-health index, medication |
| Tsuji 1996 | Framingham Heart Study, USA | SDNN, LF, HF | 2 h | MI, CHF, hosp. AP. and cardiovasc. death | 2501 | 3.5 | 56 | 26–53 | Age, sex, SVP, smoking, DM, SBP, LVH, medication |
AP, angina pectoris; BMI, body mass index; cardiovasc. death, cardiovascular death as defined by authors; CHF, congestive heart failure; cor. revasc, coronary revascularization procedures; CVD, cardiovascular disease; DBP, diastolic blood pressure; DM, diabetes mellitus; HF, high-frequency spectral component; hosp. ap, hospitalization for angina pectoris; LF, low-frequency spectral component; LVH, left ventricular hypertrophy; MI, myocardial infarction; ND, not defined; nu, normalized units; per. vasc, arterial peripheral vascular disease; SBP, systolic blood pressure; SDNN, standard deviation of N–N intervals; SVP, supraventricular premature beats; VES, ventricular extra systoles; *, median.
Risk of bias
Cardiovascular disease at baseline was assessed in all studies except in one that did not give a clear description of this assessment.32 Six studies mentioned loss-to-follow-up; in five of them this was <5%.15,20,31–33 The other study mentioned a loss-to-follow-up of 5.6%.34 Two studies did not give any information about loss-to-follow-up.17,25 Heart rate variability was assessed prior to the outcome in all eight papers. The instrument used to measure N–N intervals was clearly described in all studies, but one study lacked data on the assessment of HRV from the recordings.34 Diagnosis of CVD was verified by medical records, death certificates, or general practitioner's registries in all studies. Seven studies adjusted for potential confounders, one study only presented unadjusted risk estimates.20 For details of adjustments see Table 1.
Standard deviation of N–N intervals and cardiovascular disease
All eight studies reported on the association between SDNN and fatal and non-fatal CVD. Two studies presented data for two separate groups of patients (diabetic and non-diabetic). The reported RRs of fatal or non-fatal CVD comparing low to high HRV ranged from 0.78 to 1.99. One study reported an RR below 1.034 and one study an estimate of 1.02.33 In the other six studies, the RRs were all >1.26. In a random effects meta-analysis, a low SDNN was associated with an increased risk of fatal or non-fatal CVD: RR 1.35 (95% CI 1.10, 1.67). The I2 of the analysis was 60.2% (Figure 2).
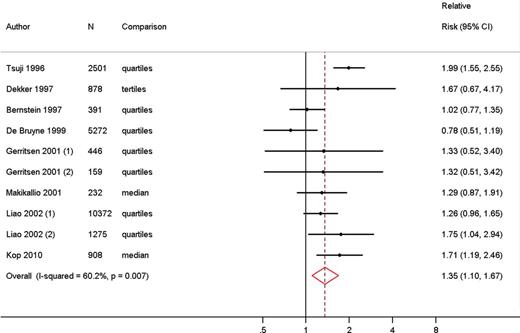
Meta-analysis comparing risk of fatal and non-fatal cardiovascular disease in low vs. high heart rate variability measured as standard deviation of N–N intervals.
We performed a sensitivity analysis excluding the risk estimates of the two populations with diabetes.15,31 This analysis showed a similar pooled RR of fatal or non-fatal CVD of 1.32 (95% CI 1.04, 1.68). Furthermore, we distinguished between different measurement durations. This analysis indicated effect modification of the association between HRV and fatal or non-fatal CVD by duration of the measurement, although the number of studies per subgroup were small. The association was stronger for HRV measured over 2–24h (RR for CVD 1.70, 95% CI 1.33, 2.17) than HRV measurements over 2–3min (RR 1.35, 95% CI 1.08, 1.69) or measurements shorter than ∼30 seconds (RR 0.97, 95% CI 0.74, 1.28).
Finally, for studies that defined their outcome solely as cardiovascular death (n = 4) pooled RR of 1.05 (95% CI 0.83, 1.33) was shown.
Low-frequency spectral component and cardiovascular disease
Four studies used the LF spectral component as a measure of HRV, with a total number of 15 215 participants. All these studies used combined endpoints to define CVD. Two studies presented results for the diabetic as well as the non-diabetic population.15,31 The RRs for the lowest LF compared with the highest LF category ranged from 1.01 to 1.77. The pooled RR was 1.45 (95% CI 1.12, 1.87), indicating that a low LF was associated with a higher risk of fatal and non-fatal CVD. I2 of this analysis was 50.4% (Figure 3).
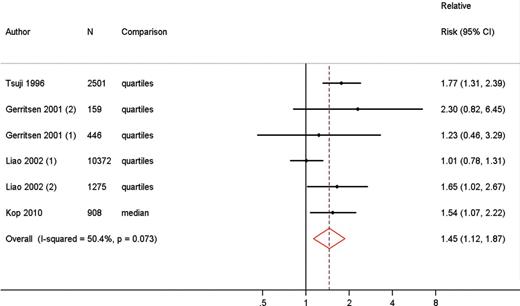
Meta-analysis comparing risk of fatal and non-fatal cardiovascular disease in low vs. high heart rate variability measured as low-frequency spectral component.
High-frequency spectral component and cardiovascular disease
The HF spectral component was used as a measure of HRV in the same studies that reported on the LF spectral component. The RRs for the association between HF and HRV ranged from 0.83 to 1.87. Lower HF was associated with a higher risk of fatal and non-fatal CVD (RR 1.32, 95% CI 0.96, 1.81), I2 = 67% (Figure 4).
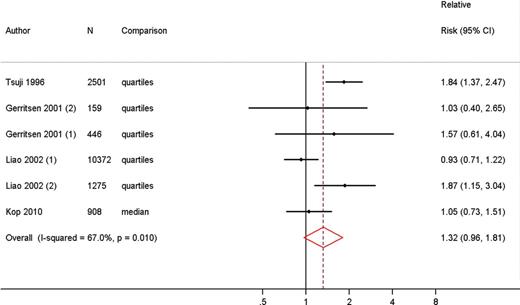
Meta-analysis comparing risk of fatal and non-fatal cardiovascular disease in low vs. high heart rate variability measured as high-frequency spectral component.
Meta-regression of standard deviation of the normalized N–N interval and cardiovascular disease
We performed a meta-regression to assess a dose–response relationship between HRV and CVD for studies with SDNN as a measure for HRV. We accepted a linear relationship between HRV and CVD, since the model including a quadratic term did not perform better than the linear model (P from likelihood ratio = 0.75). The random effects meta-regression showed an increasing risk of cardiovascular events for lower HRV (slope = −0.01, P = 0.011). The predicted RR of fatal or non-fatal CVD of the 10th HRV percentile compared with the 50th percentile was 1.50 (95% CI 1.22, 1.83); the predicted RR of the 90th percentile compared with the 50th percentile was 0.67 (95% CI 0.41, 1.09). These results indicate that an increase in SDNN of 1% results in an ∼1% lower risk of the development of fatal or non-fatal CVD (Figure 5).
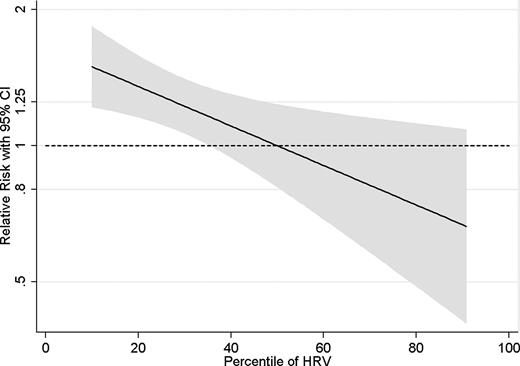
Dose–response meta-regression for the association between heart rate variability measured as standard deviation of NN intervals and fatal and non-fatal cardiovascular disease.
Discussion
Main results
The present meta-analysis was performed to assess the association between HRV and a first cardiovascular event in a population without known CVD. The study showed that individuals with low HRV have ∼40% increased risk of fatal or non-fatal CVD compared with individuals with high HRV. Our study is the first meta-analysis and dose–response meta-regression to show that low HRV is also associated with CVD in a population without known CVD.
Strengths and limitations
The present study has several strengths. First, studies included in our analyses were cohorts with a large total number of participants, which adds to the robustness of the results. Outcome ascertainment at baseline and verification of endpoints were considered adequate in the majority of the studies. Furthermore, our findings were consistent across three different measures of HRV (SDNN 1.35, LF 1.45, and HF 1.32).
A potential weakness of our study is the adjustment for possible confounders in some studies. One study did not present adjusted RRs.20 Furthermore, none of the studies adjusted for physical activity and respiration, whereas only one study adjusted for mean heart rate. Studies have been published that suggest that these factors should be taken into account.35–37
Another potential limitation is the limited number of included studies, especially in the analysis of the LF and HF spectral component (n = 4). Despite the low number of studies however, the direction and magnitude of the pooled RRs of fatal and non-fatal CVD for these two measures of HRV were in line with the pooled risk of the studies using SDNN.
Clinical implications and future research
Heart rate variability is the result of changes in heart rate caused by fluctuations in sympathetic and parasympathetic outflow. These fluctuations vary in length. An example of slow fluctuations is circadian variation, whereas faster fluctuations in heart rate are due to sympathetic and parasympathetic responses to minor haemodynamic changes. Respiration causes a cyclic variation in intrathoracic pressure and thereby venous return, which leads to fluctuations in cardiac output and arterial blood pressure. The arterial baroreflex reacts to these fluctuations in arterial blood pressure by producing fluctuations in parasympathetic and sympathetic autonomic outflow that induce compensatory modulations in peripheral resistance, cardiac contractility and heart rate.2,9 Less compensatory change (low HRV) suggests a less adaptive autonomic nervous system. However, the physiological interpretation of HRV, especially in the LF spectral band, remains controversial. Whereas the dependence of HF power on respiration-related parasympathetic outflow has repeatedly been confirmed, there are indications that LF power is not a measure of sympathetic outflow. Some investigators have found that LF is a reflection of baroreflex function instead of cardiac sympathetic innervation.38
It is known that after a cardiovascular event, individuals with lowered HRV have an increased risk of cardiovascular morbidity and mortality compared with subjects with high HRV.3–7,39,40 These results indicate that a less adaptive autonomic nervous system is a marker of cardiovascular risk. Furthermore, it shows that the autonomic nervous system becomes less sensitive for minor haemodynamic changes after a first cardiac event, which might be a direct cause of a secondary cardiovascular event. Our meta-analysis shows that HRV is also associated with cardiovascular morbidity and mortality in the general population. This suggests that less fluctuations in heart rate, caused by inadequate autonomic nervous system circulatory control, is also a sign of less favourable health in otherwise healthy individuals. Furthermore, our results seem to show effect modification of the association between HRV and CVD by duration of the measurement. This finding might indicate that a decrease in long-term fluctuations in heart rate is more important for the risk of CVD than short-term fluctuations. However, since the numbers of our stratified analyses are very small, this result must be interpreted with caution.
A possible mechanism underlying our findings is low-grade inflammation. It has been suggested that autonomic imbalance could activate inflammation by influencing the bone marrow and lymphoreticular system.41 Increased inflammation is associated with higher risk of CVD. Another possible explanation for the association between HRV and a first cardiovascular event is that individuals with low HRV already suffer from subclinical or silent CVD. These individuals are expected to have both a lower HRV and a higher risk of a following CVD event.
Heart rate variability measurement is inexpensive, easy to assess, and non-invasive. It is potentially a useful predictor of CVD in both healthy and diseased individuals. Improved identification of individuals at risk for the development of CVD may result in more targeted and adequate prevention strategies. Future research should focus on the clinical applicability of the existing knowledge about HRV, for example by aiming to find cut-off points and determine the value of HRV in addition to established risk factors. When investigating HRV for risk stratification in clinical practice, the possible influence of respiration and mean heart rate should be taken into account.
Conclusion
In conclusion, our meta-analysis shows that individuals with a low HRV have 32–45% increased risk of CVD compared with individuals with a high HRV. Our study is the first meta-analysis to show that low HRV is also associated with a first cardiovascular event in a population without known CVD. It therefore supports the hypothesis that cardiac autonomic dysfunction is associated with a higher risk of CVD. Whether HRV might be clinically useful in individual risk identification should be assessed in future research.
Conflict of interest: none declared.


