


Abstract
Implantable cardioverter defibrillator (ICD) therapy, which includes the risk of shocks, is considered the primary culprit of reductions in patient reported outcomes (PROs; e.g. health status and distress), thereby negating the role of underlying disease severity. We examined the relative influence of living with an ICD vs. congestive heart failure (CHF) on PROs and compared (i) ICD patients without CHF (ICD only), (ii) CHF patients without an ICD (CHF-only), and (iii) CHF patients with an ICD (ICD + CHF).
Separate cohorts of ICD and CHF patients (N = 435; 75% men) completed PROs at baseline, 6 and 12 months. Groups differed on physical health status only at baseline (F(2,415) = 7.15, P = 0.001) and on anxiety at 12 months (F(2,415) = 4.04, P = 0.01); ICD + CHF patients had the most impaired physical health status but the lowest anxiety level followed by the ICD only and CHF only patients. Congestive heart failure only patients had the most impaired mental health status and reported the highest level of anxiety as compared to the ICD only (P < 0.001) and ICD + CHF groups (P = 0.009), while the two latter groups did not differ. The effect sizes ranged from very small (0.03) to moderate-large (0.69). Groups did not differ in depression scores.
Congestive heart failure patients reported worse PROs as compared to ICD patients, although the magnitude of the differences was relatively small. This suggests that the well being of patients is not necessarily negatively influenced by the implantation of an ICD, and that underlying heart disease may have at least an equal if not greater influence on PROs.
Introduction
The implantable cardioverter defibrillator (ICD) comprises a unique treatment option for patients at risk of sudden cardiac death that is not paralleled by any other treatment for heart disease. Besides dealing with their life-threatening condition, ICD patients have to live with the risk of procedural and device-related complications.1 These issues may have a negative impact on the physical, social, and emotional functioning of patients.2 However, ICD treatment seems to be well tolerated by the majority of patients and ICD shocks only explain a marginal proportion of the variance in patient reported outcomes (PROs) and changes in PROs.3–5 Moreover, the prevalence of symptoms of anxiety and depression (5–63%) in ICD patients6 mirrors that found in patients with congestive heart failure (CHF).7 This begs the question whether it is the ICD placement in combination with fear of ICD shocks or the underlying heart disease that influences PROs.
Except for the large-scale primary and secondary prevention trials, e.g. the Defibrillators in Non-ischaemic Cardiomyopathy Treatment Evaluation (DEFINITE), the Canadian Implantable Defibrillator Study (CIDS), and the Sudden Cardiac Death in Heart Failure Trial (SCD-HeFT),4,8,9 a paucity of studies have examined the impact of ICD placement on PROs in order to attempt to disentangle the impact of living with a device vs. the impact of the underlying heart disease.10–12 However, patients included in randomized controlled trials do not necessarily represent patients seen in ‘real world’ clinical practice.13 The few available observational studies have been based on relatively small sample sizes, with the number of ICD patients ranging from 24 to 100, while the number of patients in the comparison groups range from 25 to 50.10–12
For physicians having to discuss the pros and cons of ICD implantation with patients, it is important to have a true picture of the impact of living with an ICD relative to heart disease on PROs. Hence, in the current study, we compared three groups (i) a cohort of ICD patients without CHF (ICD only), (ii) a cohort of CHF patients without an ICD (CHF only), and (iii) a cohort of ICD patients with CHF (ICD + CHF) on health status and symptoms of anxiety and depression in an attempt to elucidate the influence of the ICD vs. underlying heart disease on PROs, using a prospective study design with a 12-month follow-up.
Methods
Study design and participants
The sample comprised consecutive CHF outpatients and/or ICD patients recruited between August 2003 and September 2009 from the Twee Steden Hospital (Tilburg and Waalwijk), St Elisabeth Hospital (Tilburg), Amphia Hospital (Breda), ZorgSaam Ziekenhuis (Zeeuws-Vlaanderen), and the Erasmus Medical Center (Rotterdam), the Netherlands. The current study is based on two different cohorts, one of ICD patients and the other of CHF patients. These cohorts were derived from two separate prospective studies, one focusing on ICD patients and the other on CHF patients, and were merged to test our post hoc retrospective hypothesis about potential group differences. The CHF study recruited patients between 2006 and 2009, while the patients for the MIDAS (Mood and personality as precipitants of arrhythmia in patients with an Implantable cardioverter Defibrillator: A prospective Study) (ICD) were recruited between 2003 and 2009. Patients included in the Erasmus Medical Center (recruited at the time of implantation) were all consecutive patients implanted with a first-time ICD and participating in the ongoing MIDAS study.14 All ICD patients were included around the time of implantation ranging between 1 day prior to implant to 10 days post implant. Inclusion criteria for the CHF-cohort15 outpatients were (i) left ventricular ejection fraction (LVEF) ≤40%, (ii) age ≤80 years, (iii) New York Heart Association (NYHA) functional class I–III, (iv) no hospital admissions in the month prior to inclusion, and (v) stable on oral medication during at least 1 month. Patients were excluded in case of other life-threatening comorbidities (e.g. cancer), presence of evident cognitive impairments, psychiatric comorbidity (except for mood disorders), and/or insufficient understanding of the Dutch language. Exclusion criteria for ICD patients were a life expectancy <1 year, a history of psychiatric illness other than affective/anxiety disorders, on the waiting list for heart transplantation, or with insufficient knowledge of the Dutch language. The study was conducted according to the Helsinki Declaration and the protocols were approved by the medical ethics committee of the participating hospitals. All patients received written and oral information about the study and signed an informed consent form prior to study participation.
Measures
Socio-demographic and clinical variables
Information on socio-demographic variables were obtained either via purpose-designed questions in the questionnaire or via the patients' medical records. Demographic variables included gender, age, marital status, and educational level. Clinical variables included aetiology (ischaemic vs. non-ischaemic), ICD indication (primary vs. secondary), NYHA functional class, LVEF, atrial fibrillation, diabetes mellitus, and cardiac [i.e. diuretics, angiotensin-converting enzyme (ACE) inhibitors, beta-blockers, and statins] and psychotropic medications.
Patient reported outcomes
Health status
The Dutch version of the Short-Form Health Survey 12 (SF-12) was administered at inclusion, and at 6 and 12 months to assess generic health status.16,17 The SF-12 measures overall physical and mental health status, as indicated by the Physical Component Summary (PCS) and the Mental Component Summary (MCS) scores, respectively.18 All scale scores were standardized (score range 0–100), with higher scores indicating better functioning.19 The SF-12 has been shown to be a reliable and valid instrument.16
Symptoms of anxiety and depression
All patients completed the 14-item Hospital Anxiety and Depression Scale (HADS) to assess symptoms of anxiety and depression at inclusion and at 12 months follow-up.20,21 Items are answered on a 4-point scale from 0 to 3, with a high score indicating more symptoms of anxiety and depression, respectively. The dimensional structure and reliability of HADS has been confirmed in cardiac patients.22 A predefined cut-off score of ≥8 on both subscales is used to indicate the presence of probable clinical levels of symptoms of anxiety and depression, respectively.20
Statistical analyses
Prior to statistical analyses, missing items on questionnaires (1.1%) were imputed using two-way imputation.23 To examine between-group differences, the χ2 test (Fisher's exact test when appropriate) was used for dichotomous variables and Student's t-test for independent samples for continuous variables. Multivariable analysis of variance (MANOVA) for repeated measures was performed to examine potential differences in mean scores between the three patient groups: (i) ICD only, (ii) CHF only, and (iii) ICD + CHF (patients with CHF and an ICD) on health status, and symptoms of anxiety and depression, respectively. Patients with a CRT-D were excluded from analyses because we wanted to rule out the potential confounding effect of CRT-D on the chosen outcomes, given that CRT-D patients can further be divided into responders and non-responders, which might impact on the results. If a significant time by group interaction (change over time differs for groups) was observed, analysis of variance (ANOVA) was performed to compare the mean scores of the groups at each time point. To adjust for potential confounders, we used multivariable analysis of covariance (MANCOVA) for repeated measures. If the time by group interaction was significant we used analysis of covariance (ANCOVA) to compare the mean scores of the groups at each time point. For every comparison the effect size has been calculated (Cohen's d) in order to evaluate the clinical relevance of the magnitude of the differences (0.2 small, 0.5 medium, 0.8 large) in PROs between groups and not only the statistical significance. A priori based on the literature, we had decided to include age, gender, education, marital status, LVEF, NYHA functional class, aetiology, diabetes, atrial fibrillation, diuretics, statins, beta-blockers, ACE-inhibitors, and use of psychotropic medication as covariates in multivariable analyses. Left ventricular ejection fraction was added to the model in secondary analyses because of the number of missing values on this variable. Statistical analyses were performed using SPSS for Windows 17.0 (SPSS Inc., Chicago, IL, USA). All tests were two-tailed, and α<0.05 was used to indicate statistical significance. To reduce the chance of Type 1 error (i.e. finding a significant result when in fact there is none), we applied the Bonferroni correction to the (M)AN(C)OVA's by dividing the alpha by the number of performed tests 0.05/4. Hence, a significance level of 0.01 was used to indicate statistical significance for these analyses.
Results
Patient characteristics
Of 737 patients who were eligible to participate in the study, 162 patients refused (response rate = 78%), 35 (4.7%) patients died between baseline and 12 months follow-up, 51 (6.9%) were lost to follow-up, and 54 (7.3%) patients had missing data on self-report measures or clinical variables. Final analyses were based on 435 patients, divided into three groups: (i) ICD only patients (n = 188; 43.2%), (ii) CHF only (n = 208; 47.8%), and (iii) ICD + CHF (n = 39; 9%). Patients who were excluded from analyses did not differ systematically on baseline characteristics from included patients (all Ps > 0.05; data not shown). The mean age of the total sample was 61.73 ± 11.72 years with 348 patients (80%) being men. Patient baseline characteristics for the total sample and stratified by group are shown in Table 1. Group differences were observed in age, marital status, working status, LVEF, NYHA class, diabetes, use of diuretics, statins, beta-blockers, and psychotropic medication.
Patient baseline characteristics for the total sample and stratified by groupa
| Total (N = 435) | ICD only (N = 188) | CHF only (N = 208) | ICD + CHF (N = 39) | P | |
|---|---|---|---|---|---|
| Demographics | |||||
| Age | 61.7 ± 11.7 | 57.5 ± 12.5 | 66.8 ± 8.4 | 54.9 ± 11.9 | 0.0011 |
| Gender (male) | 348 (80.0) | 150 (79.8) | 165 (79.3) | 33 (84.6) | 0.75 |
| Education (low) | 305 (70.1) | 52 (27.7) | 68 (32.7) | 10 (25.6) | 0.46 |
| Marital status (partner) | 371 (85.3) | 175 (94.6) | 159 (76.4) | 37 (94.9) | <0.0012 |
| Working status (working) | 128 (29.4) | 85 (42.5) | 34 (16.3) | 9 (23.1) | <0.0013 |
| Clinical variables | |||||
| Secondary indication | 98 (22.5) | 92 (48.9) | – | 6 (15.4) | – |
| LVEF<35%b | 232 (53.3) | 89 (73.6) | 115 (55.3) | 28 (90.3) | <0.0014 |
| NYHA class III/IV | 43 (9.9) | 4 (2.1) | 14 (6.8) | 25 (61.4) | <0.0015 |
| CAD | 268 (61.6) | 116 (61.7) | 129 (62.0) | 23 (59.0) | 0.94 |
| Diabetes | 86 (19.8) | 24 (13.3) | 57 (20.4) | 4 (10.3) | 0.0016 |
| Atrial fibrillation | 99 (22.8) | 38 (20.2) | 52 (25.0) | 9 (23.1) | 0.53 |
| Medication | |||||
| Diuretics | 224 (51.5) | 67 (35.6) | 126 (60.6) | 31 (79.5) | <0.0017 |
| Statins | 276 (63.4) | 108 (57.4) | 146 (70.2) | 22 (56.4) | 0.028 |
| Beta-blockers | 319 (73.3) | 142 (75.5) | 143 (68.8) | 34 (87.2) | 0.049 |
| ACE-inhibitors | 275 (63.2) | 115 (61.2) | 130 (62.5) | 30 (76.9) | 0.17 |
| Psychotropic medication | 73 (16.8) | 28 (15.0) | 33 (15.9) | 12 (30.8) | 0.04910 |
aResults are presented as numbers (percentages) unless otherwise indicated.
bInformation on LVEF was only available in a subset of patients (n = 360).
1–10Post hoc analyses (Tukey's HSD test), significant differences observed: 1between ICD vs. CHF (P < 0.001) and CHF vs. ICD + CHF (P < 0.001); 2between ICD vs. CHF (P < 0.001) and CHF vs. ICD + CHF (P = 0.005); 3between ICD vs. CHF (P < 0.001) and ICD vs. ICD + CHF (P = 0.011); 4between ICD vs. CHF (P = 0.002) and CHF vs. ICD + CHF (P < 0.001); 5between ICD vs. ICD + CHF (P < 0.001) and CHF vs. ICD + CHF (P < 0.001); 6between ICD vs. CHF (P = 0.001) and CHF vs. ICD + CHF (P = 0.034); 7between ICD vs. CHF (P < 0.001) and ICD vs. ICD + CHF (P < 0.001); 8between ICD vs. CHF (P = 0.023); 9between CHF vs. ICD + CHF (P = 0.044); 10between ICD vs. ICD + CHF (P = 0.043)
Health status
Unadjusted analyses
Multivariable analysis of variance for repeated measures showed a significant time by group interaction for physical health status (i.e. PCS) (F(2,432) = 12.27, P ≤ 0.001) but not for mental health status (i.e. MCS) (F(2,432) = 1.71, P = 0.15). The significant time by group interaction for physical health status indicates that the mean score evolved differently for the three groups during the 12-month follow-up period. Due to the significant interaction, we performed simple effects ANOVA, which showed that groups differed significantly on physical health status at baseline (F(2,432) = 15.92, P < 0.001), at 6 months (F(2,432) = 11.82, P < 0.001), and at 12 months follow-up (F(2,432) = 11.63, P < 0.001). At baseline, the CHF only patients had the highest score followed by the ICD only and the ICD + CHF patients. However, at 6 and 12 months, the ICD only patients had the highest score followed by the CHF patients only, while the ICD + CHF patients reported the poorest physical health status. For mental health status, the non-significant time by group (F(2,432) = 1.71, P = 0.15) interaction indicated that group exerted a stable effect over time, with the CHF only patients generally having the lowest score followed by the ICD + CHF patients, and the ICD only patients reporting the best mental health status (F(2,432) = 16.83, P < .001). In general, mental health status improved over time, as indicated by a significant main effect for time (F(2,432) = 17.51, P < 0.001).
Adjusted analyses
In adjusted analysis, a significant time by group interaction was still observed for physical health status (F(2,415) = 7.63, P < 0.001) but not for mental health status (F(2,415) = 0.76, P = 0.55). Due to the significant time by group interaction, simple effects ANCOVA was performed for physical health status, which showed that the groups had significantly different scores only at baseline (F(2,415) = 7.15, P = 0.001), with the ICD + CHF patients having the lowest scores followed by the ICD only and CHF only patients. These differences were neither observed at 6 (F(2,415) = 1.07, P = 0.35) nor at 12 months (F(2,415) = 0.97, P = 0.38) (Figure 1A). With respect to mental health status, MANCOVA for repeated measures showed that the CHF only patients scored significantly lower than the ICD only (P < 0.001), and the ICD + CHF patients (P = 0.009) at all time points. No significant difference was observed between the ICD only and ICD + CHF only patients. In general, mental health status tended to improve over time in all groups, however, not significantly as indicated by a non-significant main effect for time (F(2,415) = 2.07, P = 0.07) (Figure 1B). Results did not change after additional adjustment for LVEF (results not shown).
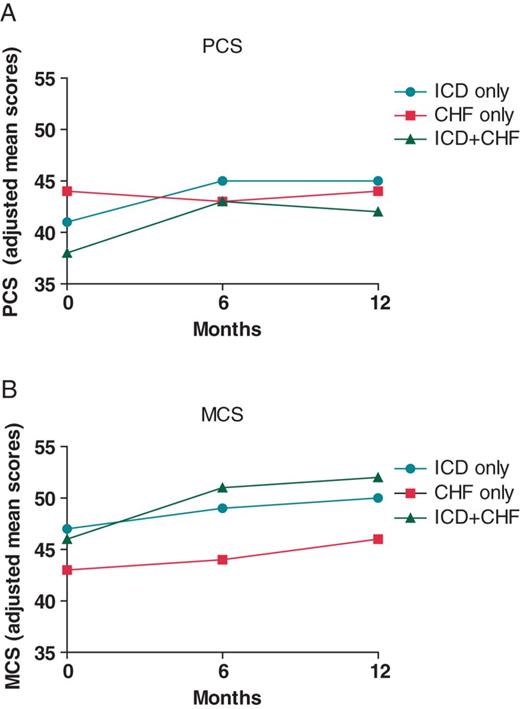
(A) Mean scores on the PCS stratified by group (adjusted analysis). Scores can range between 0 and 100 (higher scores indicating better functioning). (B) Mean scores on the MCS score stratified by group (adjusted analysis). Scores can range between 0 and 100 (higher scores indicating better functioning).
Anxiety and depressive symptoms
Unadjusted analyses
Anxiety and depressive symptoms were assessed at the time of inclusion and at 12 months follow-up. Multivariable analysis of variance for repeated measures showed a significant time by group interaction for anxiety (F(2,432) = 7.23, P = 0.001) but not for depression (F(2,432) = 3.25, P = 0.04), indicating that anxiety levels across the three groups had a different evolution. Therefore, we performed a simple effects ANOVA, which showed neither significant differences between groups on anxiety at baseline (F(2,432) = 1.07, P = 0.34) nor at 12 months (F(2,432) = 1.98, P = 0.14). With respect to depression, no significant differences between groups were observed (F(2,432) = 3.39, P = 0.02), with depression decreasing in all groups as indicated by a significant time main effect (F(2,432) = 7.19, P = 0.008).
Adjusted analyses
In adjusted analysis, MANCOVA for repeated measures still showed a significant time by group interaction for anxiety (F(2,415) = 8.22, P < 0.001) but not for depression (F(1,415) = 3.49, P = 0.03). Focusing on anxiety, simple effects ANCOVA showed no significant difference between groups at baseline (F(2,415) = 0.34, P = 0.72). However, at 12 months follow-up scores did differ between groups (F(2,415)= 4.04, P = 0.01), with the CHF only patients having the highest anxiety levels followed by the ICD only patients. The ICD + CHF patients reported the lowest anxiety levels (Figure 2A). No significant differences in depression levels were observed between groups (F(2,415) = 0.41, P = 0.67) (Figure 2B). Depression did not change significantly over time, as indicated by the non-significant time effect (F(2,415) = 0.33, P = 0.56). Adding LVEF as a covariate to these analyses did not alter the results (results not shown).

(A) Mean anxiety scores, stratified by group (adjusted analysis). Scores can range between 0 and 42 with a cut-off score of ≥8 indicating clinically elevated anxiety. (B) Mean depression scores, stratified by group (adjusted analysis). Scores can range between 0 and 42 with a cut-off score of ≥8 indicating clinically elevated depression.
Effect size
In Table 2, the effect sizes for differences between groups are displayed. The effect size is a measure of the magnitude of the differences between groups. The effect sizes ranged from very small (0.03) to moderate-large (0.69). As shown in Table 2, the differences were generally most prominent between the CHF and ICD + CHF groups, showing higher MCS scores and lower anxiety levels in the ICD + CHF group as compared to the CHF only group. In adjusted analyses, the ICD-CHF group scored on average 5 points higher on the MCS than the CHF group and 1 point lower on anxiety. Although there are no prespecified cut-off scores to indicate severity (or clinically relevant difference between groups) on the health status measures, the effect sizes that were found in this study are in line with our expectations and indicate that the implantation of an ICD after CHF diagnosis does not necessarily have a negative influence on PROs. Concerning symptoms of anxiety and depression, all groups scored on average below the clinical cut-off of 8 at all time points. Although there were some differences in scores between groups, this indicates that none of the groups were particularly more at risk for clinical levels of distress than others.
Effect size (Cohen's d)
| ICD vs. CHF | ICD vs. ICD + CHF | CHF vs. ICD + CHF | |
|---|---|---|---|
| PCS | |||
| Baseline* | 0.31 | 0.33 | 0.69 |
| 6 months | 0.15 | 0.17 | 0.03 |
| 12 months | 0.10 | 0.24 | 0.14 |
| MCS | |||
| Baseline* | 0.40 | 0.03 | 0.37 |
| 6 months* | 0.50 | 0.16 | 0.61 |
| 12 months* | 0.36 | 0.18 | 0.51 |
| Anxiety | |||
| Baseline | 0.09 | 0.03 | 0.06 |
| 12 months* | 0.21 | 0.33 | 0.53 |
| Depression | |||
| Baseline | 0.02 | 0.23 | 0.20 |
| 12 months | 0.15 | 0.05 | 0.19 |
Effect size: 0.2 = small; 0.5 = medium; 0.8 = large.
*P < 0.05.
Discussion
The objective of the current study was to compare health status and the level of anxiety and depressive symptomatology in patients with an ICD only vs. CHF only and ICD + CHF in order to elucidate the influence of the ICD placement vs. underlying heart disease on PROs. Focusing on physical health status, significant differences between groups were observed only at baseline, with the CHF only group reporting the best health status followed by the ICD only and ICD + CHF groups. With respect to mental health status, differences were observed at baseline, 6, and 12 months, with the CHF only group reporting significantly worse mental health status as compared to the ICD only and ICD + CHF groups. Statistically significant differences were observed in anxiety only at 12 months follow-up. The CHF only group reported the highest level of anxiety followed by the ICD only and ICD + CHF groups. No significant differences were observed between groups on depression.
The results of the current study show that there are differences in health status and anxiety between groups at some but not all time points. These differences were statistically significant, but the magnitude of the differences was relatively small, and as such the results do not warrant changes to clinical practice. Overall, the results suggest that patients with an ICD are not necessarily worse off in terms of their well being and health status than patients with CHF, despite the challenges of living with a device which include ICD shocks and the risk of complications. Rather the findings indicate that psychological distress and poor health status are perhaps more related to disease severity than to living with an ICD. These findings are in line with previous studies in ICD patients, suggesting that patients are generally well able to cope with their device, shock(s) and device advisory notifications.5,24 In contrast, symptomatic CHF, as indicated by NYHA functional class III–IV, seems to have a greater influence on PROs than device-related factors.25,26 This is likely due to CHF symptoms having a significant influence on daily living incurring limitations in both physical and social activities in addition to patients with CHF having to adhere to a strict treatment regimen that includes a combination of dietary restrictions, daily weighing and the prescription of multiple drugs. The results of the current study also suggest that the psychological well-being of CHF patients is not necessarily negatively affected with the implantation of an ICD, as ICD + CHF patients reported the lowest anxiety level and the best mental health status as compared to CHF only patients. Although ICD patients can experience more distress at the time of implantation or shortly thereafter, due to restrictions concerning physical exercise and driving, over time their well being seems to improve and exceeds that of CHF patients. However, again mean differences between groups were small, and the CHF and ICD + CHF patients differed on CHF severity at baseline.
For clinicians it is important to be aware of the negative influence of symptomatic heart disease on PROs, given that distress and poor health status have been identified as risk markers for both morbidity and mortality across different cardiac populations.27–29 Clinicians should be careful not to overestimate the impact of living with a device and being faced with ICD therapies on PROs, as other factors such as symptomatic heart failure may play an equally important or greater role. Patients reporting poor PROs might benefit from additional support from medical staff or mental health providers. Cognitive behavioural therapy has also been shown to significantly reduce psychological distress and improve health status in ICD patients.30,31
A number of limitations of this study must be acknowledged. First, anxiety and depression were assessed using self-report questionnaires rather than clinical diagnostic interviews. However, interviews are burdensome to patients, and there is evidence to suggest that even minimal symptoms of depression predict poor prognosis in cardiac patients.29 Second, 22% of patients refused study participation, while another subset of patients were lost to attrition during follow-up. However, patients excluded from analyses did not differ systematically on any of the study variables from included patients, safeguarding the generalizability of the findings to the total sample. Third, due to the inherent nature of the study design we were not able to control for ICD shocks in multivariable analyses, as a subset of patients did not have an ICD. However, ICD shocks have been shown only to explain a marginal proportion of the variance in PROs and changes in PROs.3–5 Fourth, the majority of CHF patients had a NYHA functional class I or II indicating mild heart failure symptoms. This may have been the reason why we did not find large differences between groups. Fifth, patients in the CHF cohort were not included into the study at the time of diagnosis but at a later time point. However, by statistically controlling for NYHA class in multivariable analyses we sought to standardize for the potential effect that this might have on our results. In addition the ICD + CHF group was much smaller than the two other groups and the groups differed on several baseline measures, as displayed in Table 1. In adjusted analyses we have, however, controlled for these differences by including those variables as covariates in the model. Finally, a follow-up period of 12 months is relatively short and replication of our findings over a longer period is warranted. Replication of our findings in other countries is also warranted as the management and care of patients might differ across countries.
This study also has several strengths, including patients representing ‘real world’ patients, the use of a prospective study design, and the comparison of the relative influence of underlying heart disease and device placement on PROs.
In conclusion, the results of the current study show that patients with an ICD do not necessarily report worse health status and more symptoms of anxiety and depression as compared to cardiac patients without a device, suggesting that ICD treatment does not impact PROs more than symptomatic CHF (at 12 months follow-up). These results add to the current debate on the impact of living with a device on patient well being,2 with the results suggesting that living with symptomatic heart disease rather than with a device impinges on PROs. For physicians having to discuss the pros and cons of ICD implantation with patients, it is important to have a true picture of the impact of living with an ICD relative to heart disease on PROs.
Funding
This work was in part supported by the Netherlands Organisation for Scientific Research (NWO) [451-05-001 (VENI and VIDI grants) to S.S.P. and 453-04-004 (VICI grant) to J.D.] and the Netherlands Organisation for Health Research and Development (ZonMw) [91710393 to S.S.P.].
Acknowledgements
We thank Agnes Muskens-Heemskerk for inclusion of the MIDAS patients into the study and Simone Traa, Martha van den Berg, and Belinda de Lange for their help with data management.
Conflict of interest: none declared.
