


Abstract
The association between premature ovarian failure (POF) and cardiovascular diseases has been investigated in a few studies, but none have looked at ventricular repolarization abnormalities in these patients. In this study, we aimed to evaluate the ventricular repolarization by QT dynamicity in patients with POF.
We enrolled 26 female patients (mean age 37.5 ± 10.1 years) with primary POF and 31 healthy female subjects (mean age 37.5 ± 9.0 years). The linear regression slopes of the QT interval measured to the apex and to the end of the T-wave plotted against RR intervals (QTapex/RR and QTend/RR slopes, respectively) were calculated from 24 h Holter recordings using a standard algorithm. QTapex/RR and QTend/RR slopes were more steeper in the POF patients in contrary to healthy control subjects (QTapex/RR = 0.184 ± 0.022 vs. 0.131 ± 0.019, P < 0.001; QTend/RR = 0.164 ± 0.021 vs. 0.128 ± 0.018, P < 0.001). Pearson's correlation analyses revealed a stronger negative correlation between oestradiol (E2) and QTapex/RR (r = –0.715, P < 0.001). There was also a moderate negative correlation between E2 and QTend/RR (r = –0.537, P < 0.001). Serum follicle-stimulating hormone level was positively correlated with QTapex/RR (r = 0.681, P < 0.001) and QTend/RR (r = 0.531, P < 0.001).
Our study results suggest that QT dynamicity is impaired in patients with POF despite the absence of overt cardiovascular involvement. Further studies are needed to elucidate the prognostic significance and clinical implications of impaired ventricular repolarization in patients with POF.
The exact mechanism of sex hormone-induced changes in predilection for cardiac arrhythmia development is unclear.
QT dynamicity is an available and simple marker to evaluate ventricular repolarization properties.
Our study findings suggest that QT dynamicity is impaired in patients with premature ovarian failure (POF) despite the absence of overt cardiovascular involvement.
Negative correlation between oestradiol level and QT dynamicity indices (QTend/RR and Tpeak–Tend/RR) may explain the possible pathophysiological mechanism of abnormal ventricular repolarization in POF patients.
Introduction
Premature ovarian failure (POF) is defined as a deviation from normal ovarian function and diagnostic features comprise the presence of amenorrhoea, hypergonadotropinaemia and oestrogen deficiency before the age of 40 years.1 Previously reported epidemiological studies showed that women with a loss of ovarian function at early ages were at increased risk for cardiovascular diseases (CVDs).2
Sex hormones and sex-related differences have been reported to be associated with the occurrences of ventricular arrhythmias in several animal and human studies.3–7 The fact that women are at particular risk for ventricular arrhythmias suggests the possibility that the dominant female hormone oestrogen modulates arrhythmia vulnerability, e.g. prolongation of QT interval.8–10 But, to date, the exact mechanism of sex hormone (oestrogen, progesterone, and testosterone)-induced changes in predilection for cardiac arrhythmia development is not fully understood.
QT dynamicity, which represents the relationship of QT interval/RR interval, is an non-invasive marker to evaluate ventricular repolarization properties11 and has been shown to have a prognostic importance in many CVDs such as heart failure,12 ischaemic cardiomyopathy13 and ventricular fibrillation in the absence of structural heart disease.14 Abnormal QT dynamicity (steep QT/RR regression slope), which means abnormal rate adaptation of ventricular repolarization, has been considered to reflect the diminished cardiac autonomic functions.15,16
The association between POF and QT dynamicity has not been evaluated as yet. Therefore, the aim of the present cross-sectional study was to evaluate and compare the QT dynamicity in POF patients and age- and gender-matched healthy control subjects.
Methods
Study population
Between November 2010 and January 2011, all consecutive eligible outpatients of Obstetrics and Gynecology Clinics with clinical and biochemical evidence of POF (n = 26) and gender-, body mass index (BMI)-, and age-matched healthy control subjects (n = 31) were enrolled in the study. Healthy women were defined as normotensive, non-smoking patients without clinical evidence of organic disease in terms of medical history, physical examination, resting 12-lead electrocardiograms (ECGs), routine biochemistry panels, and complete blood count. Also, all healthy subjects had regular menstrual cycles (25–32 days) during the last 3 months and were neither pregnant nor taking hormonal contraceptives for at least 3 months.
Patients were excluded from the study if they (i) had acute or chronic infection; (ii) had diseases interfering with the autonomic nervous system; (iii) had CVDs including hypertension, ischaemic heart disease, congestive heart failure, valvular heart disease, cardiomyopathy and cardiac arrhythmia; (iv) had a family history of sudden death; (v) had concomitant use of any licit (including beta blockers or psychotropic medications) or illicit drug; (vi) had a personal history of syncope; or (vii) had neurological diseases.
Two patients, who displayed a nearly flat T-wave (0.25–0.30 mV) in lead II of the standard ECG,17 were excluded from the study.
In all subjects, a detailed cardiovascular and systemic examination was performed at the beginning of the study with demographic data and anthropometric measures including weight, height, and BMI. Biochemistry panel including fasting blood glucose, total cholesterol, low-density lipoprotein (LDL) cholesterol, high-density lipoprotein (HDL) cholesterol, and triglyceride was obtained from all the subjects. Also, serum follicle-stimulating hormone (FSH), luteinizing hormone (LH), oestradiol (E2) levels were measured in all patients at day-time.
Informed consent was taken from each patient before enrolment. The study was in compliance with the principles outlined in the Declaration of Helsinki and approved by local ethics committee.
Laboratory assays
Serum levels of 17β-E2 were measured using a chemiluminescent immunoassay (DPC). Plasma LH and FSH levels were obtained by radioimmunoassay methods [Architest FSH, Architest LH, Chemiluminescent Microparticle Immunoassay (Abbott Laboratories)]. Lipid profile and glucose levels were measured using commercially available kits (Hitachi P800). The intra-assay and inter-assay coefficients of variation were <10.0% for all the assays, respectively.
Transthoracic echocardiography
Standard imaging was performed in the left lateral decubitus position using a commercially available system (Vingmed System Five GE Ultrasound). Images were obtained using a 2.5–3.5 MHz transducer in the parasternal and apical views. Left ventricular end-diastolic diameter (LVEDD), left ventricular end-systolic diameter (LVESD), and left ventricular ejection fraction (LVEF) were determined with M-mode echocardiography under two-dimensional guidance in the parasternal long-axis view, according to the recommendations of the American Society of Echocardiography and European Association of Echocardiography.18
QT analysis
QT dynamicity parameters were obtained with a portable battery-operated three-channel analogue recorder (Elatec Holter systems, ELA Medical) and analysed using ELATEC Holter software (ELA Medical). The Holter ECG recordings from the two groups of patients and healthy individuals are stored with a sampling frequency of 200 Hz and an amplitude resolution of 10 μV. The recordings were performed using three orthogonal bipolar leads (3-OL) X, Y, and Z. The X lead (horizontal plane) was positioned at the fourth inter-costal space on the two mid-axillary lines; the Y lead (frontal plane) immediately under the right clavicle and on either the upper leg or left iliac crest; the Z lead (sagittal plane) at the fourth inter-costal space (V2 position) and posteriorly on the left side of the vertebral column. Positive electrodes were, respectively, left, inferior, and anterior. The ECGs were corrected for artefacts and templates adjusted if necessary. Recordings were eligible if they had >18 h of analysable data. All tapes were manually edited to eliminate artefacts and premature events. To verify the accuracy of the QT measurement, all recordings were checked in a large superimposed beat display, indicating the positions of the QT-measurement points for each beat. The verified digitized data were then processed using dedicated QT analysis software, which converted the 24 h recording into 2880 templates obtained at 30 s intervals. To improve the signal-to-noise ratio, one median complex was computed every 6 s from the consecutive sinus beats, and then the five median beats within each 30 s template were averaged in order to obtain a single representative P–QRS–T complex for each of the 2880 templates. For each template, the algorithm automatically measured the mean and standard deviation (SD) of the QTapex, the QTend, and the RR interval (in ms). The T-wave apex was determined by fitting a parabola through the peak of the T-wave, whereas the T-wave end was determined by the intersection of the tangent to the downslope of the T-wave with the isoelectric baseline. In each template, the QTapex measurement was performed only if the amplitude of the T-wave was >0.15 mV. For each template, the mean QTapex and QTend values were then plotted against the mean cycle length of the 30 s interval. The program automatically computed both linear regressions (QTapex/RR and QTend/RR) for the entire 24 h and provided the slope, the intersect, and the correlation coefficient of the linear regressions automatically (Figure 1). Additionally, Tpeak–Tend/RR slope was also calculated from those data as a marker of ventricular repolarization dynamics.19 In healthy participants, the normal range of QTapex and QTend/RR slope is 0.11–0.18 for 24 h20 and about 0.15 for day-time.21 QT dynamicity was analysed by a single operator (U.C.) and validated by another (K.M.G.).

QT/RR linear regression slopes recorded from a healthy control subject (A), and from a patient with POF (B).
Statistical analysis
Numerical variables with a normal distribution were presented as the mean ± standard deviation, numerical variables with a skewed distribution were presented as the median (minimum and maximum), and categorical variables were presented as percentages. For numerical variables, an independent sample t-test and Mann–Whitney U-test were used for inter-group comparisons. χ2 Test and Fischer's exact χ2 test were used for comparisons of categorical variables. Pearson's correlation analysis was performed to evaluate the association of various variables, such as age, resting heart rate, systolic and diastolic blood pressure (BP), LVEF, LVEDD, LVESD, and sex hormone levels with QT dynamicity indices. Multivariate linear regression analysis was performed to evaluate the effects of various variables, such as age, sex, baseline heart rate, systolic and diastolic BP, smoking status, LVEF, systolic and diastolic BP values, serum FSH, and E2 levels on QT dynamicity indices. Statistical analyses were performed using SPSS statistical software (version 20.0; SPSS Inc.). A two-tailed P < 0.05 was considered to be statistically significant.
Results
A total of 26 females (age 37.5 ± 10.1 years) with primary POF and 31 healthy females (age 37.5 ± 9.0 years) were enrolled. Baseline characteristics of the study population are shown in Table 1.
Baseline demographic characteristics and lipid profiles of the POF and control groups
| Parameters | POF (n = 26) | Control group (n = 31) | P value |
|---|---|---|---|
| Age (years) | 37.5 ± 10.1 | 37.5 ± 9.0 | 0.362 |
| BMI (kg/m2) | 25.0 ± 3.6 | 23.3 ± 1.3 | 0.074 |
| Systolic blood pressure (mmHg) | 128.6 ± 12.6 | 124.4 ± 16.6 | 0.089 |
| Diastolic blood pressure (mmHg) | 80.2 ± 14.4 | 78.4 ± 14.2 | 0.658 |
| Smoking (%) | 10 (38.4) | 11 (35.4%) | 0.745 |
| LVEF (%) | 62.4 ± 4.8 | 65.6 ± 5,8 | 0.132 |
| LVEDD (mm) | 48.1 ± 5.1 | 46.4 ± 4.0 | 0.344 |
| Total cholestrol (mg/dL) | 201.6 ± 34.7 | 200.9 ± 49.0 | 0.986 |
| Triglyceride (mg/dL) | 117.8 ± 53.3 | 114.5 ± 50.0 | 0.671 |
| HDL-cholestrol (mg/dL) | 52.4 ± 10.2 | 55.6 ± 8.9 | 0.223 |
| LDL-cholestrol (mg/dL) | 120.9 ± 32.3 | 123.0 ± 44.9 | 0.335 |
| FPG (mg/dL) | 80.2 ± 7.6 | 76.3 ± 4.4 | 0.462 |
| Serum creatinine (mg/dL) | 0.85 ± 0.45 | 0.79 ± 0.35 | 0.088 |
| Age at diagnosis (years) | 30.2 ± 11.6 | – | – |
| Oestradiol (pg/mL) | 25.0 ± 15.6 | 84.7 ± 63.9 | <0.001 |
| FSH (IU/L) | 47.9 ± 17.5 | 17.9 ± 11.5 | <0.001 |
| LH (IU/L) | 19.1 ± 11.1 | 5.7 ± 3.4 | <0.001 |
Data are given as number (%) or mean ± SD.
BMI, body mass index; FPG, fasting plasma glucose; FSH, follicle-stimulating hormone; HDL, high-density lipoprotein; LDL, low-density lipoprotein; LH, luteinizing hormone; LVEDD, left ventricle end-diastolic diameter; LVEF, left ventricle ejection fraction; POF, premature ovarian failure.
All patients and control-group participants were in sinus rhythm and had normal 12-lead ECG results at rest. All Holter recordings had a low level of artefacts, with an adequate number of QRST templates automatically computed by the pre-defined algorithm. In all recordings, the incidence of atrial premature beats were <0.5% and the number of ventricular premature beats were 90 ± 33 (34–165)/24 h for the POF group and 88 ± 38 (29–121)/24 h for the healthy control group (P > 0.05). All 24 h linear regressions (both QTend/RR and QTapex/RR) had a correlation coefficient >0.75.
The details of the 24 h Holter recording analysis are presented in Table 2. Mean heart rate and RR intervals were similar between POF patients and control group. Also both QTapex/RR and QTend/RR slopes were more steeper in POF patients compared with the healthy control group (P < 0.001). There were no correlation between QT dynamicity with age, BMI, smoking status, LVEF, LVEDD, and systolic and diastolic BP. However, we have found that there was positive correlation between serum FSH levels with QT dynamicity indices (P < 0.001) (Figure 2) and also negative correlation between serum E2 level with QT dynamicity indices (P < 0.001) (Figure 3).
Comparison of ventricular repolarization parameters between patients with POF and control subjects
| POF (n = 26) | Control group (n = 31) | P value | |
|---|---|---|---|
| Resting heart rate (bpm) | 85.0 ± 7.4 | 82.5 ± 9.6 | 0.076 |
| Mean RR, 24 h | 753 ± 78 | 759 ± 86 | 0.452 |
| Mean RR, day-time | 666 ± 65 | 675 ± 74 | 0.061 |
| Mean RR, night-time | 952 ± 81 | 963 ± 88 | 0.072 |
| Mean heart rate (bpm), 24 h | 79.3 ± 10.4 | 80.2 ± 9.2 | 0.854 |
| VPC, mean count/day (range) | 90 ± 33 (34–165) | 88 ± 38 (29–121) | 0.455 |
| Mean QTac | 376.0 ± 15.7 | 338.3 ± 15.3 | 0.006 |
| Mean QTa | 328.5 ± 16.9 | 296.0 ± 17.6 | 0.001 |
| Mean QTec | 439.9 ± 20.0 | 416.9 ± 16.9 | 0.002 |
| Mean QTe | 383.4 ± 24.3 | 365.6 ± 17.4 | 0.002 |
| QTa/RR slope, 24 h | 0.184 ± 0.022 | 0.131 ± 0.019 | <0.001 |
| QTa/RR slope, day-time | 0.153 ± 0.014 | 0.115 ± 0.012 | <0.001 |
| QTa/RR slope, night-time | 0.105 ± 0.008 | 0.089 ± 0.007 | 0.002 |
| QTe/RR slope, 24 h | 0.164 ± 0.021 | 0.128 ± 0.018 | <0.001 |
| QTe/RR slope, day-time | 0.143 ± 0.011 | 0.110 ± 0.012 | 0.003 |
| QTe/RR slope, night-time | 0.087 ± 0.004 | 0.076 ± 0.009 | 0.001 |
| Intercept QTa/RR, 24 h (ms) | 134 ± 64 | 155 ± 63 | 0.002 |
| Intercept QTe/RR, 24 h (ms) | 196 ± 86 | 216 ± 89 | 0.04 |
| QTa/RR correlation (r) | 0.85 ± 0.07 | 0.79 ± 0.06 | 0.045 |
| QTe/RR correlation (r) | 0.77 ± 0.04 | 0.76 ± 0.03 | 0.654 |
Numerical variables with a normal distribution were presented as the mean ± standard deviation.
bpm, Beats per minute; POF, premature ovarian failure; VPC, ventricular premature complex.
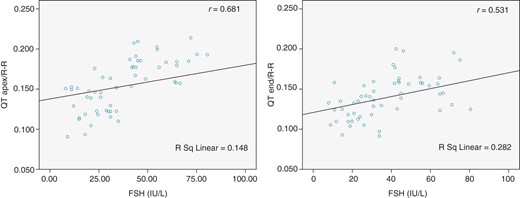
Correlations for QT dynamicity indices (QTapex/RR and QTend/RR slopes) with serum FSH levels in all the study population (r indicates the correlation coefficient).

Correlations for QT dynamicity indices (QTapex/RR and QTend/RR slopes) with serum E2 levels in all the study population (r indicates the correlation coefficient).
The effects of age, BMI, smoking, LVEF, baseline heart rate, systolic and diastolic BP values, and serum FSH and E2 levels on QTapex/RR and QTend/RR were examined in a multivariate linear regression analysis, and it was determined that the FSH and E2 levels were independent predictors of QTapex/RR and QTend/RR (Table 3). In this model, the influence of the E2 level on QTapex/RR (P = 0.002, β = –0.56) and QTend/RR (P = 0.001, β = –0.65) was found to be more prominent than the other factors.
Results of multivariate linear regression analysis for the independent predictors influencing QT dynamicity indices
| Parameters | QTa/RR | QTe/RR | ||
|---|---|---|---|---|
| β value | P value | β value | P value | |
| Age (years) | −0.88 | 0.453 | −0.72 | 0.474 |
| BMI (kg/m2) | −0.75 | 0.565 | −0.67 | 0.554 |
| Resting heart rate (bpm) | 0.45 | 0.662 | 0.54 | 0.575 |
| Systolic BP (mmHg) | 0.32 | 0.976 | 0.74 | 0.690 |
| Diastolic BP (mmHg) | 0.37 | 0.445 | 0.40 | 0.238 |
| Smoking (%) | 0.67 | 0.072 | 0.82 | 0.084 |
| LVEF (%) | 0.43 | 0.541 | 0.55 | 0.874 |
| Oestradiol (pg/mL) | −0.56 | 0.002 | −0.65 | 0.001 |
| FSH (IU/L) | 0.78 | 0.004 | 0.59 | 0.008 |
BMI, body mass index; BP, blood pressure; bpm, beats per minute; FSH, follicle-stimulating hormone; LVEF, left ventricle ejection fraction.
In addition, we compared the Tpeak–Tend (78.51 ± 12.3 ms for POF and 61.15 ± 9.9 ms for the healthy control group; P = 0.001) and Tpeak–Tend/RR slopes (0.0299 ± 0.030 for POF and 0.008 ± 0.023 for the healthy control group; P = 0.004) in both POF patients and healthy control groups. While there was non-significant positive correlation between serum FSH level and Tpeak–Tend/RR slope (r = 0.055, P = 0.689); serum E2 level has significant negative correlation with Tpeak–Tend/RR slope (r = −0.410, P = 0.002). So, this finding also supports the results of multiple linear regression analysis regarding the effects of serum E2 levels on ventricular repolarization.
Discussion
To the best of our knowledge, our study is the first to evaluate the relationship between POF and QT dynamicity. We have found that POF patients had impaired QT dynamicity which was represented as more steeper QTapex/RR, QTend/RR, and Tpeak–Tend/RR slopes. Besides, the QT dynamicity indices were found to be negatively correlated with E2 levels.
Premature ovarian failure may have important clinical implications since the early attenuation of sex steroids have been associated with CVDs such as myocardial infarction and stroke.22,23 However, despite the large number of studies investigating the effects of menopause on cardiovascular outcomes and ventricular repolarization, currently, little is known about the cardiovascular and electrophysiological effects of POF in young women.
Parameters measuring ventricular repolarization such as QT dispersion,24 QT dynamics,25 and QT interval/RR have been studied in several diseases to stratify patients who have increased risk of ventricular arrhythmia and sudden cardiac death.24 Abnormal rate adaptation of ventricular repolarization, known as QT dynamicity (measured by the slope of linear regression of QT/RR), may serve as such a marker. Abnormal QT dynamicity has been described in patients who are prone to ventricular arrhythmias.26–30 The QT/RR relationship can be measured with commercially available software but has never been investigated as a risk marker in POF patients.
In the last decades, both animal and human studies related with the impact of gender and sex steroids on cardiac arrhythmias were increased like drug-induced Torsades de Pointes (TdP) more frequent in women than in men31; female gender is an independent risk factor for syncope and sudden death in the congenital long QT syndrome32,33; and the higher propensity toward arrhythmia in normal females is associated with basic differences in repolarization such that QTc intervals are longer in females than in males.34,35 Philp et al.36 showed that 17β-E2 could exert an anti-arrhythmic effect by inhibiting Ca2+ channel that is greater in female rats than in male rats, indicating that the reduction of 17β-E2 level may exert a proarrhythmic effect and could lead to the activation of Ca2+ channel. However, in this study serum E2 levels of the rats were much higher than the physiological range, so cardioprotective effect of the E2 may be lost in normal hormone levels. Recently, Hu et al.37 reported that serum E2 levels were lower in post-menauposal patients with idiopathic outflow tract ventricular arrhythmia compared with that in the control post-menauposal group and oestrogen replacement therapy could inhibit significantly the count of ventricular arrhythmias in those patients. Also, Chen et al.38 demonstrated that 17β-E2 could decrease vulnerability to ventricular arrhythmias in infracted rats, indicating that oestrogen could exert an anti-arrhythmic effect under pathological conditions. These results suggested that ‘lower E2 level’ may be an important ‘modulating factor’ for the mechanism of ventricular arrhythmias in specific pathological conditions. Our study results were also compatible with this hypothesis and showed impaired QT dynamics in POF patients in whom the E2 level negatively correlated with QT dynamicity indices.
However, although our results suggested that E2 deficiency may be associated with abnormal QT dynamics, there were several studies in the literature which had evaluated the effects of hormone replacement therapy (HRT) on post-menopausal women conflicting with our findings.39–41 A study conducted by Larsen et al.41 reported that E2, alone or in combination with progestins, had no significant effects on heart rate, QT interval, or QTc interval in post-menopausal women without structural heart disease. But in another study, Yildirir et al.42 showed that HRT significantly decreased the QTd and QTcd in healthy postmenopausal women independent of the addition of progestin to the regimen. Even though sex steroid effects in ventricular repolarization have gained wide recognition, the underlying mechanisms are not completely understood. Also, mechanisms may be differed under different age groups (normal or early menopause) and different conditions (physiological or pathological conditions).
Our study should be evaluated with some limitations. This is a case–control study in a small number of patients. Although performing a large-scale study in this rare group of patients is difficult, larger sample sizes provide more accurate information. Also, we did not intervene on the hormonal status of the patients. Studies with hormonal replacement in POF patients may explain the further mechanisms.
In conclusion, our study findings suggest that QT dynamicity is impaired in patients with POF despite the absence of overt cardiovascular involvement. These results may highlight the oestrogen actions on ventricular repolarization. Further studies are warranted to elucidate the prognostic significance and clinical implications of impaired ventricular repolarization in patients with POF.
Conflict of interest: None declared.
Funding
None declared.
Acknowledgements
None declared.
