


Abstract
Actual rates of lead vegetations (LVs) in cardiovascular device infections (CDI) are debated in this study. The aim of this study is to characterize prevalence and risk factors of LV in patients with CDI treated with lead extraction (LE).
Between 2003 and 2011, 293 leads were extracted from 136 patients (age 70.5 ± 14.5 years, 109 male) with infective indications: 39.2% chronic draining sinus, 20.9% pocket infections, and 28.8% systemic infections/sepsis. All patients underwent transesophageal echocardiography (TEE) before LE. Lead vegetation prevalence was 40.4%: 62.2% in systemic infection, but noteworthy in local infection/chronic draining sinus (21.9/36.4%). Younger age, renal disease, ad dialysis were associated with systemic infection. Fever after last intervention, revision, previous reparative procedure, infection at wound/device site and infection >6 months were associated with local infection/chronic draining sinus. Cardiac resynchronization therapy device, fever after last intervention, infection <6 months, renal disease, dialysis, abnormal chest X-ray, fever at admission, pulmonary symptoms, white blood cell (WBC) count, erythrocyte sedimentation rate, C-reactive protein increase and positive blood samples were related to LV. Risk of vegetations was reduced by antibiotic prophylaxis. Multivariate analysis indicated that renal failure and increased WBC count were related to LV.
Lead vegetations were frequently observed in patients with only local symptoms. Therefore, TEE should be mandatory in all patients undergoing LE for infective indications.
• Prevalence of intracardiac lead vegetations in patients treated with lead extraction may be higher than previously suspected, >40% in our population, when transesophageal echocardiography is extensively performed in all patients with infective indications.
• Vegetations are, as expected, mainly observed in sepsis/systemic infection. However, more interestingly, they are also found in local infections and chronic draining sinus (approximately in one-third of the cases), where they represent an ‘unexpected’ finding according to traditional knowledge. Vegetation occurrence plays a key role in stratifying the risk of the extraction procedure and in driving further therapeutic decisions. Consequently, vegetations must be accurately investigated before extraction in any case showing infective indications, as well as in patients with only local signs or symptoms.
Introduction
The use of cardiac implantable electronic devices (CIEDs) such as pacemakers (PMs) and implantable cardioverter defibrillators (ICD) has extended the lifespan of patients. However, their recent implementation in clinical practice has also resulted in an increase in local and systemic infections. Although infections are relatively rare compared with the number of devices implanted,1,2 some infections can be severe and potentially life-threatening.3 Fortunately, PM-related infections are mostly restricted to the PM pocket, whereas lead endocarditis, which is a more serious condition, accounts for <10% of these complications,4 with an incidence rate ranging from 0.06%5 to 0.6%.6 In contrast, the rate of ICD-related infections varies between 0.8% and 3.2%,7 and these infections are becoming less common as the pectoral approach replaces abdominal procedures.8
Clinical presentation of cardiac device-related infection (CDI) may be local, systemic, or both. Local manifestations are more common,9 and include signs and symptoms of inflammation at the device placement site,10 possibly accompanied by fever. A chronic open skin lesion, with negative local bacteriological analyses (so-called ‘chronic draining sinus’), may often be the only sign in the absence of evident infection.
The intravascular segment of the lead is frequently involved in these infections.11–13
Occurrence of lead vegetations (LVs) is described,14–16 often as anecdotal cases,17,18 and mainly with reference to feasibility, safety, and clinical outcomes of lead extraction (LE).14,16,19 The prevalence of vegetations has been debated, but actual figures are not available. The reported prevalence of LV may change widely, due to the imaging technique involved and the phase of the illness. Transesophageal echocardiography (TEE) plays an unquestionable diagnostic role, with some concerns about reliability during the acute phase, whereas intracardiac echocardiography has been reserved for selected cases.20,21 The accurate definition of LV also confirms the diagnosis of lead endocarditis according to Duke criteria,22 strongly supporting the decision for extracting leads19 and guiding towards transcutaneous or surgical approaches.23–26
Aims
The aims of this study were to describe the prevalence of LV in patients with CDI (i.e. chronic draining sinus, local and systemic infection) in a selected population of patients referred for PM or ICD LE, to identify risk factors for vegetation occurrence, to define an effective diagnostic evaluation protocol prior to LE, and to guide further therapeutic strategies.
Materials and methods
Study population and data collection
The study population consisted of all consecutive patients referred to our University Department for LE between April 2003 and November 2011. Data concerning past medical history, clinical, microbiological, and previous transthoracic echocardiography (TTE) features were collected after hospital admission.
Definitions
Chronic draining sinus
Clinically, this refers to a local cutaneous lesion, with solution of continuity of the skin (fistula, ulcer, decubitus, skin erosion, wound dehiscence), with or without serous or purulent discharge, but with negative local bacteriological specimens and without symptoms and signs of systemic infection.
Suspected or proven local infection
This refers to (i) a local cutaneous lesion, with local signs at the generator pocket (erythema, tenderness, fluctuance, warmth), recurrence despite repeated antibiotic courses, and negative local transcutaneous bacteriological assessment (suspected infection) or (ii) a closed or open lesion with positive local specimens (proven infection) but without symptoms or signs—either laboratory or clinical—of systemic involvement. A moderate increase (within two-fold of the upper normal limits) in erythrocyte sedimentation rate (ESR) and C-reactive protein (CRP) may occur.
Systemic infection
Systemic infection accounts for
Bacteraemia, persistent or recurrent: This condition implies positive blood cultures, essentially without symptoms.
Sepsis: Positive blood cultures and symptoms [systemic symptoms and signs clinically related to a device infection, such as fever and increased white blood cell (WBC) count].
Endocarditis (cardiac device-related infective endocarditis, CDRIE): Vegetations present, blood cultures positive or negative. Requires the presence of LVs detected by TEE, concomitant with clinical evidence of systemic infection.
Antibiotic treatment before lead extraction
All patients with infective indications were on long-term antimicrobial suppressive therapy as recommended by the referring physician. After hospital admission and prior to extraction, the route of administration was always changed from an oral to an intravenous one. The antibiotic treatment was based on advice from an infectologist and our previous epidemiological experience.27
Transthoracic–transesophageal echocardiography protocol
According to our protocol, all consecutive patients with infective indications were evaluated by TTE and TEE the day before or the same morning of the LE procedure. TTE and TEE were performed to identify the presence of vegetations, to examine their relationship to the endocardium, and to measure them. TTE and TEE were performed according to standard protocols.
A vegetation was defined as an intracardiac mass detected in at least two different echocardiographic planes. For each vegetation, we described the occurrence on leads, valves or mural endocardium, the shape (filamentous-like, sessile, pedunculate) and the consistency (soft, dense). The location was on the tricuspid valve, aortic valve, right ventricular and right atrial segment of lead, and superior vena cava–right atrial junction. Vegetations were divided into single and multiple forms. For single vegetations, we also reported major and minor diameter and surface area, with measurements performed in different planes; in cases of multiple vegetations, these measurements were performed on the largest one.
Extraction protocol
Lead extraction was performed under local anaesthesia in the Electrophysiology Lab, with a cardiac surgery team on active duty and with support of an anaesthesiologist and with working anaesthesia equipment in the room. We used manual traction with conventional and locking stylets, and dilation with polypropylene sheaths (Cook Vascular Inc., Leechburg, PA, USA). The size of the sheaths, all provided with bevelled ends, ranged from 7 to 14 F. We used the single-sheath technique described by Bongiorni.28
Indications for transvenous or surgical extraction
Our centre is a referring centre for the treatment of CDI, and all CDI patients were directly referred to our institution for evaluation. The first choice indication for cardiac surgery was the concomitant need for myocardial revascularization, a severe tricuspid regurgitation, or left-sided concomitant endocarditis. If the detected vegetations exceeded 2 cm in diameter, the transvenous LE was postponed and the patient underwent specific antibiotic treatment. Our protocol requires that we wait for the absence of fever for three weeks before reassessing the characteristics of vegetations. The possibility of resorting to transvenous extraction was reconsidered only in patients where the size of the vegetations had decreased to <20 mm in diameter. Patients with LV >20 mm in diameter also underwent transvenous extraction when the expected surgical operative risk was considered too high. In cases of PM dependency, a variable approach was used, mainly depending on the patient's co-morbidities: (i) surgical extraction and concomitant epicardial lead placement, or (ii) transvenous LE, concomitant with percutaneous implantation of a conventional screw-in lead connected to an external device to bridge to the subsequent definitive implant.
Microbiological assessment
Blood cultures were carried out for at least 2 consecutive days. Bacteriological swabs from the pocket were also collected preoperatively in cases of local infection or chronic draining sinus. During the LE procedure, after removal of the generator, a swab was obtained from the deep portion of the pocket. A tissue specimen (generally a piece of the fibrotic capsule) was also excised. After the extraction of each lead, the tip and the pin were cut. Every swab, all tissue specimens and every fragment of the lead pin and tip were immediately collected into a sterile dry container and stored in a refrigerator for later delivery to the microbiology laboratory for analysis.
Reimplantation and antibiotic therapy after lead extraction
In the absence of vegetations, patients were reimplanted after 24–48 h provided no systemic involvement was apparent.23 If vegetations were pre-operatively detected, time-to-reimplantation was postponed. Reimplantation was performed in absence of systemic involvement, when blood cultures drawn 24 and 48 h after CIED system removal remained negative for at least 72 h. Consequently, reimplantation was deferred for at least 4–5 days and longer. Post-extraction antibiotic therapy, in cases of LVs pre-operatively detected, or when bacteriological analysis from lead fragments were positive, included a long-term (at least 3–4 weeks) administration of intravenous antibiotics (or sometimes oral antibiotics depending on the microbiological isolate, antibiotic sensitivities, and clinical scenario).23
Outcomes
Clinical outcomes were reported. With reference to the timing, outcomes were defined as ‘intra-perioperative’ (any event occurring during the procedure or becoming evident during the 24 h period following the procedure); ‘in-hospital’ (any event becoming evident during hospital stay); and ‘long-term’ (any event occurring after discharge from the target hospital stay) outcomes. Hospital stay refers to hospitalization at our institution, referring hospital or rehabilitative structure before home discharge.
Patients were followed up in the outpatient office after extraction. When patients were referred back to their primary institution, the primary cardiologist (or internist or family practitioner) was contacted for information regarding the patient's medical status.
Statistical analysis
Continuous variables were expressed as mean ± standard deviation and categorical variables as counts and percentages of the respective strata. The continuous variables were analysed by independent-samples t-tests and one-way analysis of variance when degrees of freedom were greater than one (Bonferroni test for multiple comparisons). Nominal variables were compared using the χ2 test or, for multiway tables, the Pearson χ2, the likelihood-ratio χ2, and contingency coefficient. Hazard ratios were presented with 95% confidence interval.
All tests of significance were two-tailed, and a P value of <0.05 was considered significant. Multivariate logistic regression was performed. Variables found statistically significant in univariate analysis were used for multivariate analysis in the ‘enter’ mode (stepwise logistic regression). Data were analysed using the Statistical Package for Social Sciences (SPSS, version 18.0.0; SPSS Inc, Chicago, IL, USA).
All included patients gave written informed consent for participation in the study, which was approved by the institutional ethic committee and was performed according to the principles of the Declaration of Helsinki.
Results
Population features
During the study period, 154 patients with 318 leads underwent LE. Descriptive characteristics and clinical indications requiring LE, techniques employed and results are summarized in Table 1. Infective indications for LE recurred in 136 patients (88%), and vegetations were found in 55 of these patients (40.4%).
Patient populationa
| Mean ± SD | |
|---|---|
| Patients, n | 154 |
| Male patients | 122 (78.7) |
| Leads extracted, n | 318 |
| Age (years) | 69.9 ± 14.2 |
| Number of leads extracted per patient | 2.2 ± 0.7 |
| Dwelling time (months) | 43.2 ± 43.1 (range 4–312) |
| Number of previous conservative treatments | 1.6 ± 1.5 |
| Infective indications | 136 (88) |
| Dwelling time (months) | 41.5 ± 41.7 (range 6–212) |
| Chronic draining sinus | 60 (39) |
| Local infection | 32 (21) |
| Systemic infection | 44 (28) |
| Recent (<3 months) | 42 (31) |
| Chronic (>3 months) | 94 (69) |
| Non-infective indications | 18 (12) |
aDescriptive characteristics, clinical indications of lead extraction, techniques employed and results for the 154 patients and 318 leads treated during the study period. Data are presented as mean ± standard deviation (SD) and counts (and percentages).
Vegetation characteristics
Characteristics of vegetations are shown in Table 2.
Vegetation characteristicsa
| Patients, n | 136 |
| Patients with vegetations, n | 55 (40.4) |
| Vegetations, location | |
| Lead | 43 (78.2) |
| Valves | 1 (1.8) |
| Lead and valves | 7 (12.7) |
| A | 31 (56.4) |
| V | 29 (52.7) |
| AV | 1 (1.8) |
| TV | 8 (14.5) |
| SVC-RA J | 4 (7.3) |
| Vegetations, consistency | |
| Dense | 26 (47.3) |
| Soft | 29 (52.7) |
| Vegetations, shape | |
| Filamentous-like | 41 (74.5) |
| Pedunculate | 10 (18.2) |
| Sessile | 4 ((7.3) |
| Vegetations, mobility | |
| Mobile | 41 (74.6) |
| Fixed | 14 ((25.4) |
| Vegetations, single or multiple | |
| Single | 22 (40) |
| Multiple | 33 (60) |
| Max Ø largest vegetation, mm | 11.9 ± 6.9 |
| Range, mm | 3–40 |
| Min Ø largest vegetation, mm | 4.1 ± 3.2 |
| Range, mm | 1–12 |
| Surface area, largest vegetation, mm2 | 55.0 ± 53.9 |
| Range, mm2 | 3–120 |
| Surface area, all vegetations, mm2 | 63.2 ± 76.9 |
| Range, mm2 | 5–320 |
aData are presented as mean ± standard deviation and counts (and percentages).
A, atrial segment of leads; V, ventricular segment of leads; AV, aortic valve; TV, tricuspid valve; SVC-RA J, superior vena cava-right atrial junction.
Microbiology
The prevalence of the bacterial strains identified in cultural examination of the 293 leads extracted in 136 patients with infective indications is reported in Figure 1.
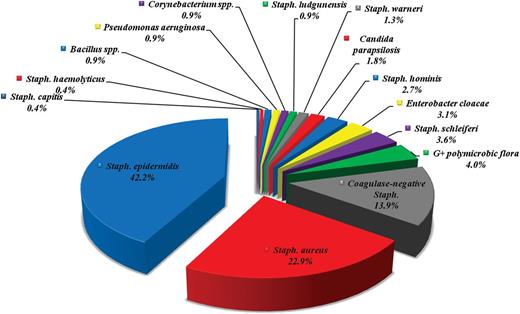
Prevalence (in percentages) of the bacterial strains identified from culture examinations of the 293 leads extracted with infective indications.
Clinical, laboratory, and procedural data for three groups with local and systemic infective indications
Clinical, laboratory, and procedural data, stratified by infective indications for extraction (sepsis/CDRIE, local infections, and chronic draining sinus) are reported in Table 3. Local infection and chronic draining sinus were significantly associated with older age (P= 0.04), revision (P= 0.001), previous reparative procedures (P= 0.001), fever as a complication of last PM/ICD intervention (P=0.000), infection lasting >6 months (P = 0.031), local symptoms, ongoing (P= 0.000) or recurrent (P= 0.001), positive tissue samples (P= 0.000), and Coagulase-negative Staphylococcus from leads (P= 0.026).
Clinical, laboratory, and procedural data for three groups with infective indicationsa
| Systemic infection/CDRIE | Local infection | Chronic draining sinus | P value | |
|---|---|---|---|---|
| Age, years | 65.8 ± 19.5 | 73.3 ± 9.7 | 72.1 ± 11.6 | 0.04 |
| Dwelling time, months | 37.6 ± 45.2 | 35.1 ± 37.4 | 47.7 ± 40.9 | NS |
| CIED data, operation | ||||
| First implantation | 28/43 (65.1) | 18/32 (56.3) | 36/59 (61.0) | NS |
| Replacement | 15/43 (34.9) | 12/32 (37.5) | 23/59 (39.0) | |
| Upgrading | 0 | 2/32 (6.3) | 0 | |
| Revision | 12/44 (27.3) | 19/32 (59.4) | 37/59 (62.7) | 0.001 |
| Previous reparative procedures | 0.45 ± 0.7 | 0.94 ± 0.9 | 1.2 ± 1.1 | 0.001 |
| CIED type of device | ||||
| Pacemaker | 24/45 (53.3) | 16/32 (50) | 35/59 (59.3) | NS |
| ICD | 21/45 (46.7) | 16/32 (50) | 24/59 (40.7) | NS |
| CRT | 13/45 (28.9) | 9/45 (28.1) | 11/59 (18.6) | NS |
| Last PM/ICD intervention, complications | ||||
| Fever | 12/45 (26.6) | 0 | 1/59 (1.7) | 0.000 |
| Co-morbidities | ||||
| Diabetes | 13/45 (28.9) | 9/32 (28.1) | 10/59 (16.9) | NS |
| Renal disease | 22/45 (48.9) | 15/32 (46.9) | 15/59 (25.4) | 0.024 |
| End-stage renal disease, dialysis | 5/45 (11.1) | 3/32 (9.4) | 0 | 0.037 |
| COPD | 11/45 (24.4) | 10/32 (31.3) | 10/59 (16.9) | NS |
| Stroke/TIA | 8/45 (17.8) | 6/32 (18.8) | 5/59 (8.5) | NS |
| Peripheral vascular disease | 8/45 (17.8) | 4/32 (12.5) | 9/59 (15.3) | NS |
| Liver disease | 2/45 (4.4) | 2/32 (6.3) | 1/59 (1.7) | NS |
| CAD | 15/45 (33.3) | 13/32 (40.6) | 20/59 (33.9) | NS |
| Heart failure | 19/45 (42.2) | 17/35 (53.1) | 23/59 (39.0) | NS |
| Cardiomyopathy | 29/45 (64.4) | 22/32 (68.8) | 29/59 (49.2) | NS |
| Moderate-to severe cardiac valve disease | 10/45 (22.2) | 9/35 (28.1) | 12/59 (38.7) | NS |
| Cardiac valve prosthesis | 5/45 (11.1) | 6/32 (18.8) | 6/59 (10.2) | NS |
| Source of infection | ||||
| Wound/device site | 34/43 (79.1) | 25/32 (80.6) | 58/58 (100) | 0.001 |
| Intravascular catheters | 3/43 (7) | 0 | 0 | |
| Skin/soft tissue infections | 0 | 2/32 (6.5) | 0 | |
| Thrombophlebitis | 0 | 3/32 (6.5) | 0 | |
| Lung infections | 1/43 (2.3) | 0 | 0 | |
| Others | 3/43 (7.0) | 1 (3.2) | 0 | |
| Not identified | 2/43 (4.7) | 0 | 0 | |
| Infection duration, months | 8.6 ± 16.9 | 12.4 ± 14.9 | 4.0 ± 5.1 | 0.047 |
| Infection >6 months | 12 (26.7) | 18 (56.3) | 25 (42.4) | 0.031 |
| At admission before LE | ||||
| Fever | 40/45 (95.2) | 2/32 (6.3) | 0 | 0.000 |
| Local symptoms, active | 27/45 (60) | 32/32 (100) | 59/59 (100) | 0.000 |
| Local symptoms, recurrent | 20/45 (44.4) | 26/32 (81.3) | 43/59 (72.9) | 0.001 |
| Pulmonary symptoms | 13/45 (28.9) | 2/32 (6.3) | 1/59 (1.7) | 0.000 |
| WBC increase | 22/45 (48.9) | 1/32 (3.1) | 1/59 (1.7) | 0.000 |
| ESR increase | 38/45 (84.4) | 6/32 (18.7) | 6/59 (10.2 | 0.000 |
| C-reactive protein increase | 40/45 (88.9) | 9/32 (28.1) | 17/59 (28.8) | 0.000 |
| Immunological phenomena | 4/45 (8.9) | 0 | 0 | 0.016 |
| Abnormal chest X-rayb | 10/44 (22.7) | 3/31 (9.7) | 5/58 (8.6) | NS |
| Antibiotic therapy before hospital admission | ||||
| IV ‘long-term’ antibiotic therapy | 35/45 (77.8) | 14/32 (43.8) | 20/59 (33.9) | 0.000 |
| IV ‘short-term’ antibiotic therapy | 7/45 (15.6) | 13/32 (40.6) | 32/59 (54.2) | 0.000 |
| Oral antibiotic therapy | 7/45 (15.6) | 9/32 (28.1) | 14/59 (23.7) | NS |
| Vegetations at TEE before LE | ||||
| Patient no. | 28/45 (62.2) | 7/32 (21.9) | 20/59 (36.4) | 0.001 |
| Max Ø largest vegetation, mm | 26 ± 24 | 6 ± 31.5 | 19 ± 10 | NS |
| Min Ø largest vegetation, mm | 8 ± 5 | 5 ± 5 | 9 ± 3 | NS |
| Surface area largest vegetation, mm2 | 67.4 ± 81.1 | 69 ± 86.7 | 22.4 ± 27.3 | NS |
| Results | ||||
| Procedural success | 42 (93.3) | 32 (100) | 57 (96.6) | NS |
| Clinical success | 44/45 (97.8) | 32/32 (100) | 59/59 (100) | NS |
| Manual traction, effective | 22/45 (48.9) | 12/32 (37.5) | 21/59 (35.6) | NS |
| Temporary PM during LE | 39 (86.7) | 31 (96.9) | 58 (98.3) | 0.033 |
| Temporary PM after LE | 29 (64.4) | 28 (87.5) | 47 (79.7) | 0.047 |
| Peri- and intra-operative bacteriological analysis | ||||
| Blood samples, positive | 34 (75.5) | 4 (12.5) | 3 (5.1) | 0.000 |
| Tissue samples, positive | 32 (71.1) | 31 (96.9) | 20 (33.9) | 0.000 |
| Lead samples, positive | 37 (82.2) | 28 (87.5.) | 48 (81.4) | NS |
| Staphylococcus aureus from leads | 14 (37.8) | 8/28 (28.6) | 5/48 (10.4) | 0.011 |
| Coagulase-negative staphylococci from leads | 18/37 (48.7) | 13/28 (46.4) | 35/48 (72.9) | 0.026 |
aClinical, laboratory and procedural characteristics of the three groups of patients with infective indications: sepsis/CDRIE, local infection, and chronic draining sinus. Data are presented as mean ± standard deviation and counts (and percentages); P values are calculated by analysis of variance and χ2 tests (Bonferroni post hoc analysis).
bAbnormal findings consistent with infectious disease, like pleural effusion, pneumonia parenchyma involvement, lung infiltrates, or abscesses.
COPD, chronic obstructive pulmonary disease; CAD, coronary artery disease; IV, intravenous; NS, not significant.
Cardiac device-related infective endocarditis/systemic infection was related to renal disease (P= 0.024), dialysis (P= 0.037), fever at admission (P= 0.000), pulmonary symptoms (P= 0.000), WBC count (P= 0.000), ESR (P= 0.000), CRP increase (P= 0.000), occurrence of immunological phenomena (P= 0.016), positive blood samples (P= 0.000) and Staphylococcus aureus culture from leads (P= 0.011).
Potential vegetation predictors in the overall population
Univariate analysis (Table 4) revealed that vegetations were significantly associated with longer dwelling time (P= 0.01), cardiac resynchronization therapy (CRT) device (P= 0.05), fever as complication of last PM/ICD intervention (P= 0.05) and absence of antibiotic prophylaxis (P= 0.023). Factors related to infection were infection length (P= 0.037), and infection lasting >6 months (P= 0.006), while renal disease (P= 0.004) and dialysis (P= 0.012) were statistically significant co-morbidities. Clinical factors significantly associated with vegetations were fever before LE (P= 0.002), ongoing (P= 0.015) or relapsing (P= 0.025) local symptoms, pulmonary symptoms (P= 0.025), abnormal chest X-ray (abnormal findings consistent with infectious disease, like pleural effusion, pneumonia parenchyma involvement, lung infiltrates, or abscesses: P= 0.002); WBC count (P= 0.001), ESR (P= 0.002), CRP increase (P= 0.000), and positive blood samples (P= 0.000).
Predictors for vegetations and perioperative data: univariate analysisa
| Vegetations | No vegetations | OR | 95% CI | P value | |
|---|---|---|---|---|---|
| Demographics | |||||
| Male sex | 45/55 (81.8) | 64/81 (79.0) | 1.11 | 0.50–2.85 | NS |
| Dwelling time, months | 52.3 ± 47.8 | 34.1 ± 35.4 | 0.01 | ||
| CIED, type of device | |||||
| Pacemaker | 27/55 (49.1) | 48/81 (59.3) | 0.78 | 0.52–1.18 | NS |
| ICD | 28/55 (50.9) | 33/81 (40.7) | NS | ||
| CRT | 18/55 (32.7) | 15/81 (18.5) | 1.51 | 1.01–2.27 | 0.05 |
| CIED, type of last intervention | |||||
| First implantation | 30/55 (54.5) | 54/81 (66.7) | NS | ||
| Replacement | 25/55 (45.5) | 25/81 (30.9) | |||
| Upgrading | 0 | 2/81 (2.5) | |||
| Revision | 26/55 (47.3) | 42/81 (51.9) | 0.9 | 0.6–1.35 | NS |
| Previous reparative procedures | 0.87 ± 0.95 | 1.17 ± 1.12 | NS | ||
| Last PM/ICD intervention, complications | |||||
| Fever | 11/51 (20) | 6/81 (7.4) | 1.81 | 1.08–3.02 | 0.05 |
| Antibiotic prophylaxis | 23/55 (41.8) | 68/81 (83.9) | 0.49 | 0.26–0.92 | 0.023 |
| Supposed route of infection | |||||
| IV therapy | 2/55 (3.6) | 2/81 (2.5) | 1.24 | 0.45–3.39 | NS |
| Central venous catheters | 2/55 (3.6) | 1/81 (1.2) | 1.67 | 0.73–3.82 | NS |
| Hemodialysis fistula | 2/55 (3.6) | 0 | 1.65 | 2.53–3.12 | NS |
| Hospital-acquired infection | 5/55 (9.1) | 4/81 (4.9) | 1.41 | 0.49–7.52 | NS |
| Wound/device site | 46/55 (83.8) | 72/81 (92.3) | NS | ||
| Intravascular catheters | 3/55 (5.5) | 0 | |||
| Source of infection | |||||
| Skin/soft tissue infections | 0 | 2/81 (2.6) | NS | ||
| Thrombophlebitis | 1/51 (1.8) | 2/81 (2.6) | |||
| Lung infections | 1/51 (1.8) | 0 | |||
| Others | 2/55 (3.6) | 2/81 (2.6) | |||
| Not identified | 2/55 (3.6) | 0 | |||
| Infection duration, months | 5.39 ± 6.17 | 10.1 ± 15.6 | 0.037 | ||
| Infection >6 months | 25/55 (45.5) | 56/81 (69.1) | 1.78 | 1.32–5.47 | 0.006 |
| Co-morbidities | |||||
| Diabetes | 16/55 (29.1%) | 16/81 (19.8) | 2.74 | 1.33–2.04 | NS |
| Insulin therapy | 6/55 (10.9) | 7/81 (8.6) | 1.16 | 0.62–2.17 | NS |
| Renal disease | 29/55 (52.7) | 23/81 (28.4) | 1.80 | 1.21–2.69 | 0.004 |
| End-stage renal disease, dialysis | 6/55 (10.9) | 1/81 (1.2) | 2.26 | 1.55–3.13 | 0.012 |
| COPD | 14/55 (25.5) | 17/81 (21) | 3.75 | 0.73–1.82 | NS |
| Previous stroke/TIA | 7/55 (12.7) | 12/81 (14.8) | 0.90 | 0.48–1.68 | NS |
| Peripheral vascular disease | 11/55 (20) | 10/81 (12.3) | 1.40 | 0.86–2.19 | NS |
| Cancer, active | 1/55 (1.8) | 0 (0%) | 2.50 | 2.03–3.07 | NS |
| CAD | 18/55 (37.5) | 30/81 (37.0) | 0.89 | 0.57–1.38 | NS |
| Cardiac valve disease, severe | 9/55 (16.4) | 22/81 (27.2) | 0.66 | 0.37–1.2 | NS |
| Cardiac valve prosthesis | 5/55 (9.1) | 12/81 (14.8) | 0.70 | 0.32–1.51 | NS |
| Heart failure | 24/55 (43.6) | 35/81 (43.2) | 1.01 | 0.67–1.52 | NS |
| Atrial fibrillation | 22/55 (40) | 36/81 (44.4) | 0.90 | 0.59–1.36 | NS |
| Abnormal chest X-rayb | 22/55 (40) | 13/81 (16.0) | 1.81 | 1.15–2.85 | 0.002 |
| At hospital admission, before LE | |||||
| Fever | 25/55 (45.5) | 17/81 (21.0) | 1.86 | 1.27–2.75 | 0.002 |
| Local symptoms, active | 43/55 (78.2) | 75/81 (92.6) | 0.55 | 0.36–0.82 | 0.015 |
| Local symptoms, relapsing | 30/55 (54.5) | 59/81 (72.8) | 0.63 | 0.43–0.94 | 0.028 |
| Pulmonary symptoms | 17/55 (30.9) | 12/81 (14.8) | 2.57 | 1.11–5.95 | 0.025 |
| WBC increase | 17/55 (30.9) | 7/81 (8.6) | 2.09 | 1.45–3.01 | 0.001 |
| ESR increase | 31/55 (56.4) | 21/81 (25.9) | 2.21 | 1.32–3.69 | 0.002 |
| C-reactive protein increase | 38/55 (69.1) | 28/81 (34.6) | 2.37 | 1.49–3.77 | 0.000 |
| Antibiotics before hospital admission | |||||
| IV ‘long-term’ antibiotic therapy | 37/55 (67.3) | 32/81 (39.5) | 1.99 | 1.27–3.14 | 0.001 |
| IV ‘short-term’ antibiotic therapy | 16/55 (29.1) | 36/81 (44.4) | 1.29 | 0.99–1.69 | NS |
| Oral antibiotic therapy | 8/55 (14.5) | 22/81 (27.2) | 1.32 | 1.00–1.73 | NS |
| Results | |||||
| Procedural success | 52/55 (94.5) | 79/81 (97.5) | 0.66 | 0.31–1.39 | NS |
| Clinical success | 54/55 (98.2) | 81/81 (100) | 0.88 | 0.47–1.11 | NS |
| Manual traction, effective | 18/55 (32.7) | 37/81 (45.7) | 0.72 | 0.46–1.12 | NS |
| Peri- and intra-operative bacteriological analysis | |||||
| Blood samples | 27 (49.1) | 14 (17.3) | 1.51 | 1.08–2.34 | 0.000 |
| Staphylococcus aureus from blood | 16/27 (59.3) | 5/14 (35.7) | 1.32 | 0.75–2.32 | NS |
| Coagulase-negative staphylococci from blood | 9/27 (33.3) | 9/14 (64.3) | 1.41 | 0.54–3.68 | NS |
| Tissue samples | 31 (56.4) | 52 (62.2) | 0.80 | 0.41–1.59 | NS |
| Staphylococcus aureus from pocket | 12/31 (38.7) | 21/52 (40.4) | 0.92 | 0.72–1.47 | NS |
| Coagulase-negative staphylococci from pocket | 19/31 (61.3) | 26/52 (50) | 1.41 | 0.54–3.68 | NS |
| Lead samples | 42 (76.4) | 71 (87.6) | 1.51 | 0.90–2.53 | NS |
| Staphylococcus aureus from leads | 9/42 (21.4) | 18/71 (25.3) | 0.88 | 0.46–1.68 | NS |
| Coagulase-negative staphylococci from leads | 30/42 (71.4) | 36/71 (50.7) | 1.64 | 1.01–2.95 | 0.05 |
aClinical, laboratory, and procedural characteristics stratified by presence/absence of vegetations. Data are presented as mean ± standard deviation and counts (and percentages). Univariate analysis and P values, respectively, are calculated by analysis of variance and χ2 test (Bonferroni post hoc analysis). Odds ratios (OR) and 95% confidence index (95% CI) are reported.
bAbnormal findings consistent with infectious disease, like pleural effusion, pneumonia parenchyma involvement, lung infiltrates, or abscesses.
COPD, chronic obstructive pulmonary disease; CAD, coronary artery disease; IV, intravenous; NS, not significant.
Predictors of LVs identified at univariate analysis (Table 4) were weighted by multivariate analysis (Table 5), which revealed two features significantly related with LVs: renal disease (P= 0.048) and WBC increase (P= 0.003).
Predictors for vegetations: multivariate analysisa
| Score | df | Significance | |||
|---|---|---|---|---|---|
| Variables analysed | |||||
| Step 0 | |||||
| Variables | CIED-type of device, CRT | 2.286 | 1 | 0.131 | |
| Last PM/ICD intervention, Fever | 1.070 | 2 | 0.586 | ||
| Last PM/ICD intervention, fever (1) | 0.006 | 1 | 0.940 | ||
| Last PM/ICD intervention, fever (2) | 0.855 | 1 | 0.355 | ||
| Last PM/ICD intervention, antibiotic prophylaxis | 3.699 | 2 | 0.157 | ||
| Last PM/ICD intervention, antibiotic prophylaxis (1) | 0.195 | 1 | 0.659 | ||
| Last PM/ICD intervention, antibiotic prophylaxis (2) | 3.584 | 1 | 0.058 | ||
| Infection duration >6 months (1) | 3.141 | 1 | 0.076 | ||
| Renal disease (1) | 4.349 | 1 | 0.037 | ||
| Dialysis (1) | 6.128 | 1 | 0.013 | ||
| Chest X-ray, abnormal (1) | 9.635 | 1 | 0.002 | ||
| Fever (1) | 8.049 | 1 | 0.005 | ||
| Local symptoms. Active (1) | 8.734 | 1 | 0.003 | ||
| Local symptoms, recurrent (1) | 4.936 | 1 | 0.026 | ||
| Pulmonary symptoms (1) | 7.771 | 1 | 0.005 | ||
| WBC increase (1) | 12.354 | 1 | 0.000 | ||
| ESR increase (1) | 9.447 | 1 | 0.002 | ||
| CRP increase (1) | 8.013 | 1 | 0.005 | ||
| Global statistics | 27.429 | 16 | 0.037 | ||
| Variables in equations | |||||
| B | SE | Wald | df | Significance | |
| Step 1 | |||||
| WBC increase (1) | −1.732 | 0.522 | 11.014 | 1 | 0.001 |
| Constant | 0.969 | 0.250 | 14.989 | 1 | 0.000 |
| Step 2 | |||||
| Renal disease (1) | −0.903 | 0.463 | 3.803 | 1 | 0.048 |
| WBC increase (1) | −1.612 | 0.533 | 9.136 | 1 | 0.003 |
| Constant | 1.264 | 0.306 | 17.128 | 1 | 0.000 |
aVariables found statistically significant at univariate analysis are inserted. Methods: logistic regression, stepwise, and forward. df = degree of freedom; SE = standard error.
Outcomes
Follow-up was available for all 136 patients. The average follow-up was 45 months (45.3 ± 27.0 months, range 4–108) (Table 1). Procedural success, clinical success,23 and effectiveness of manual traction alone, were reported, in cases of infective indications (Table 3). Time before reimplantation (4.4 ± 1.6 vs. 1.7 ± 0.6 days, P= 0.000) (Table 6), and length of in-hospital stay (21.6 ± 8.2 vs. 6.8 ± 1.8 days, P= 0.000) were significantly longer in patients with vegetations. No intra-perioperative deaths occurred in our population, but two patients died during the in-hospital period. One patient died on the fourth postoperative day due to disseminate intravascular coagulation. The second patient was a 43-year old, HIV-infected patient, who died 72 h after the procedure because of acute respiratory failure due to multiple lung abscesses/infiltrates, pre-existing to LE. This septic patient was extracted as an extreme attempt because our surgeons judged him inoperable. The extraction was performed contrarily to our protocol that excludes LE in cases of acute septic state.
Perioperative management and outcomesa
| Whole population | Vegetations | No vegetations | P value | |
|---|---|---|---|---|
| N = 136 | N = 55 | N = 81 | ||
| Time before reimplantation (days) | 2.6 ± 1.8 (0–8) | 4.4 ± 1.6 (1–8) | 1.7 ± 0.6 (0–4) | 0.000 |
| Duration of hospital stay (days) | 12.8 ± 9.1 (6–45) | 21.6 ± 8.2 (6–45) | 6.8 ± 1.8 (6–14) | 0.000 |
| Follow-up, months | 45.3 ± 27.0 (4–108) | 37.725.2 (4–104) | 50.627.1 (6–108) | 0.006 |
| Antibiotic therapy, months | 0.99 ± 1.01 (0.33–9) | 1.6 ± 1.4 (0.5–9) | 0.6 ± 0.2 (0.33–2) | 0.000 |
| Deaths | ||||
| Intra-perioperative | 0 | 0 | 0 | |
| In-hospital | 2 (1.5) | 2 (3.6) | 0 | NS |
| DIC | 1 | 1 | ||
| Acute Respiratory failure | 1 | 1 | ||
| Long-term | 23 (16.9) | 10 (18.2) | 13 (16.1) | 0.05 |
| Infection relapse | 1 (0.7) | 1 (1.8) | 0 | NS |
| Neoplasm | 6 (4.4) | 3 (5.4) | 3 (3.7) | NS |
| AMI | 7 (5.2) | 3 (5.4) | 4 (4.9) | NS |
| CHF | 7 (5.2) | 3 (5.4) | 4 (4.9) | NS |
| Cerebrovascular disease | 3 (2.2) | 1 (1.8) | 2 (2.5) | NS |
aClinical, laboratory, and procedural characteristics stratified by presence/absence of vegetations. Data are presented as mean ± standard deviation (range) and counts (and percentages). Univariate analysis and P values, respectively, are calculated by analysis of variance and χ2 test (Bonferroni post hoc analysis), when appropriate.
DIC, disseminate intravascular coagulation; AMI, acute myocardial infarction; CHF, congestive heart failure.
Long-term mortality was slightly higher in patients with vegetations. Interestingly, only one case was observed of relapsing ongoing sepsis, in a patient with vegetations prior to LE. This was a 75-year-old patient with dilated idiopathic cardiomyopathy, diabetes, mild-to-moderate renal diseases, and recurrent urinary tract infections. This patient underwent LE on October 2006, and discontinued antibiotics 6 months later, with clinical healing. He was reimplanted only on September 2007, with a dual chamber ICD that was upgraded to a biventricular device on July 2010, by surgical implantation of an epicardial lead. On May 2011, he suffered from ongoing sepsis, with demonstration of vegetations on leads, tricuspid and aortic valves, with subsequent multi-organ failure and death.
Discussion
Prevalence of lead vegetations
Recent studies report a prevalence of LVs in ∼10%16 to 23%29 of patients with CDI. However, these figures may fluctuate widely according to the presence/absence of systemic involvement, and may be higher in patients with CDRIE/systemic infection30,31 when compared with populations that also contain patients with pocket infections.32
Prevalence data are also affected by the imaging technique employed, and TEE has unambiguously become the standard technique for evaluating and disclosing LVs. Abnormal TTE images on leads may be observed in 67%,30 80%19 and up to 90–96% of cases. Intracardiac echocardiography has sometimes been advocated in particular instances and for particular purposes.20,21 The prevalence of intracardiac lead masses may also vary according to the institution's referral characteristics, the time from onset of infection and previous local reparative attempts.
The prevalence of vegetations in our population was quite high—approaching 40%—probably because an extraction referral centre such as ours indiscriminately collects patients who were previously conservatively managed by treatment with long-term antimicrobial therapy and, consequently, had a long-standing infectious illness (Tables 1 and 4).
Prevalence of vegetations in local infection/chronic draining sinus
In our population, vegetations were observed (and obviously at higher percentages) in systemic infections, but more interestingly, were also apparent in chronic draining sinus (approximately one-third of the cases). This may deserve further reflection. Local symptoms are well known to prevail, sometimes exclusively, at the device pocket.33 Likewise, infection is clearly not restricted to the pocket, but involves the whole stimulation system, as confirmed by the clinical inefficacy of local repair attempts and the high rate of retrieval of bacterial isolates from the intravascular segments of the leads (approaching 88–90%), even in cases of chronic draining sinus.12,13 These findings support the consensus that, even in cases of erosion, conservative treatment is not optimal and when device erosion and chronic draining sinus occur, even without clinical evidence of involvement of the transvenous portion of the lead system, removal of all leads is mandatory to eradicate infection.23
A recent paper34 indicated that ∼60% of patients with CDI presented with pocket infection/erosion (21% with positive blood cultures); however, although only 23% underwent TEE, 50% of them disclosed vegetations. Therefore, the real incidence of vegetations may be underestimated when TEE is performed on a limited number of patients who present with only localized pocket signs. Our results are noteworthy as TEE was performed on all consecutive patients with all infective indications (pocket infection/erosion and sepsis/endocarditis). Our findings indicate that the performance of TEE should be mandatory prior to LE in all patients with local or systemic involvement.
Limitations of Duke criteria for diagnosis of cardiovascular device infection
In TEEs performed for indications other than to rule out endocarditis, lead masses were seen in 535 and up to 10% of the PM patients,36 and mobile thrombus on device leads was reported by intracardiac echocardiography in 30% of patients undergoing ablation, but only in 1.2% by TTE.37 Thus, masses attached to a device lead should be interpreted in the overall clinical context and, in the absence of concomitant clinical evidence of infection, should not mandate device and lead removal. Therefore, LV must be interpreted in the context of modified Duke's criteria. However, according to Duke's modified criteria22 the identification of a LV alone is consistent with the category of ‘possible IE’ with consequent important diagnostic and therapeutic decisions.
Therefore, our assessment is that modified Duke criteria—mainly validated in left-sided endocarditis and more often with native or prosthetic valve involvement—are not uniformly applicable and reliable for diagnosis of CDI. Sensitivity of Duke's criteria may be low for diagnosis of CDI. In fact, a normal TEE cannot exclude the possibility of CDI, particularly if CDI is confined to the pulse generator (S. aureus isolates were obtained from pocket samples in up to 17% of patients with negative TEEs).38 In addition, typical vascular phenomena, according to Duke's definition, were never observed in our study population, whereas immunological phenomena were noted in two patients with vegetations (3.6%), in two patients without vegetations (2.5%) and in 2 of 105 patients with positive lead bacteriological analyses (1.9%), but also in 2 of 21 with negative lead bacteriology (9.5%). An important clinical suspicion may rise when LVs are associated with local recurrent, pulmonary, and/or systemic signs. As in the present cases, the importance of local symptoms at the generator pocket has been noted for diagnosis of CDI in other studies.10 In agreement with our data,39 local recurrent symptoms and pulmonary symptoms or abnormal chest X-rays increased the diagnostic sensitivity of the Duke criteria.
Risk factors for lead vegetations
Our work confirms the importance of factors previously associated with infections, according to literature data: replacement,2,40–42 revision,40 previous reparative procedures, renal failure, dialysis, CRT devices,42,43 absence of antibiotic prophylaxis,2,40 and long-standing infection are associated with vegetations. The multivariate analysis indicated that increased WBC count and dialysis had their own importance as independent risk factors for vegetations. Renal failure was also a well-recognized predisposing factor to infection,44 carrying an incremental mortality risk in septic patients undergoing LE.45
Microbiology
Our microbiological data confirmed the importance of Staphylococcus strains as causative pathogens. In selected populations of patients referred for PM or ICD LE, about two out of three infections are due to bacterial members of the Staphylococcus family.29,33,46 Previous epidemiological studies describing infective endocarditis in PM recipients have reported staphylococci as the most frequent causative organisms, identifying involvement of these bacteria in up to 82% of the cases.5
In further support of the present findings, Staphylococcusepidermis has been reported as the single most commonly involved bacteria. A broad study of a French registry of CDI indicated that 66.0% were caused by Staphylococcusepidermidis.12 According to our results, S. aureus seems to play a major role in acute bloodstream infections, despite contradictory reports47 In our experience, coagulase-negative staphylococci from leads are involved in chronic infections, particularly skin lesions. Occurrence of vegetations also seems to be associated with coagulase-negative staphylococci from leads and from infections of shorter duration, probably because of a higher virulence/aggressiveness of the coagulase-negative strains involved.
Reimplantation and antibiotic therapy after lead extraction
Our data show that detection of LVs is not only a diagnostic curiosity, but is a milestone in driving further therapeutic decisions. No clinical trials have yet tested the minimal duration of antibiotic therapy or when it is appropriate to switch from intravenous to oral antibiotics, but over 20 years of experience exists for the use of guidelines similar to that used for non-CIED-related endocarditis.23 Therefore, our protocol (driven by presence of vegetations and/or positive bacteriological analyses on lead fragments) requiring a long-term post-extraction antibiotic course (2–6 weeks of intravenous or sometimes oral antibiotics, depending on the microbiological isolate, antibiotic sensitivities, and clinical scenario) seemed to be effective.
Outcomes
Our in-hospital mortality was lower than that reported in the literature data (1.5% during target hospitalization compared with ∼10%),48,49 and was completely due to overwhelming sepsis. In-hospital mortality of 2.7% for sepsis has been reported by others.16 Our results are even more impressive because one of the deaths in our population occurred in a septic patient who had been refused by cardiac surgeon due to a prohibitive surgical risk, and who underwent LE as an extreme attempt. In the long-term period, only one death occurred due to CDRIE, with concomitant multiple valvular involvement, in a patient who had clinically recovered from initial infection and discontinued antibiotics for a long time. The new overwhelming sepsis most likely has to be viewed as a new infective process, rather than as a relapse of the previous illness. In fact, this patient was at high risk of developing infections (diabetic, with moderate-to-severe renal disease, and recurrent urinary tract infections).
Our follow-up data compare very favourably to those reported previously16,48,49 and our better outcomes may be related to the use of a longer antibiotic course before LE, and because patients with acute active infections are—generally—excluded from LE.
Interestingly, all patients who died of sepsis had vegetations detected before LE, thus confirming previous observations that the presence of LV identifies a high-risk subset of patients.16
Conclusion
The prevalence of vegetations is high in patients with infective indications who are referred for LE, and vegetations can be observed in systemic infection and in patients with local infection, as well as—interestingly—in cases of erosion and chronic draining sinus.
Some device data, clinical features, and laboratory parameters show statistically significant correlations with LVs in patients with device infections. Vegetation detection can therefore play a key role in the diagnosis and therapeutic decisions in patients with CDI. We consider that TEE should be mandatory in cases of lead-related vegetations in every patient with infective indications, as well as in cases of suspected local infection and local skin lesions, even in the absence of fever, systemic symptoms, and pathological laboratory findings.
Conflicts of interest: The authors have declared that no conflict of interest exists.
