


Abstract
A left bundle-branch block (LBBB) electrocardiogram (ECG) type may be caused by either a block in the left branch of the ventricular conduction system or by uncoupling in the working myocardium. We used a realistic large-scale computer model to evaluate the effects of uncoupling with and without left-sided block and in combination with biventricular pacing.
Action potential propagation was simulated using a reaction-diffusion model of the human ventricles. Electrocardiograms and cardiac electrograms were computed from the simulated action potentials by solving the bidomain equations. In all situations, diffuse uncoupling reduced QRS amplitude, prolonged QRS duration, and rotated the QRS axis leftward. Uncoupling by 50% increased QRS duration from 90 to 120 ms with a normal conduction system and from 140 to 190 ms when the left bundle branch was blocked. Biventricular pacing did not change QRS duration but reduced total ventricular activation time.
Uncoupling in the working myocardium can mimic left-sided block in the ventricular conduction system and can explain an LBBB ECG pattern with relatively low amplitude. Biventricular pacing improves ventricular activation in true LBBB with or without uncoupling but not in case of 50% uncoupling alone.
Introduction
An electrocardiographic pattern of left bundle-branch block (LBBB) is frequently observed in patients diagnosed with heart failure (HF). An LBBB-like electrocardiogram (ECG) can be caused by conduction block in the left branch of the ventricular conduction system or by diffuse electrical uncoupling in the left ventricular (LV) working myocardium.1–4 Diffuse uncoupling may arise due to reduced expression or misalignment of connexins during LV hypertrophy1, which is frequently present in hearts of patients with an LBBB ECG.
The question whether an LBBB ECG pattern in an individual patient is caused by conduction block in the left bundle branch or by a different cause is highly relevant in patient selection for cardiac resynchronization therapy (CRT), because patients with LBBB clearly benefit from this therapy, whereas CRT may even be detrimental in more disperse conduction abnormalities.1,5 It is not clear whether the presence of cellular uncoupling in LBBB hearts affects the benefit of CRT.
To improve insight in LBBB- and uncoupling-related ECG changes, we used a realistic computer model of the human heart and torso to evaluate the effect of diffuse uncoupling in combination with LBBB and CRT.
Methods
Because it is crucial for this study that the effect of tissue conductivity on action potential propagation and on volume conduction is accurately represented, we used a reaction-diffusion model of the human ventricles coupled to a detailed human torso model. This combination of models has been used in several previous studies3,4,6 so we will describe it only briefly. Tissue conductivity parameters and fibre orientation were identical in the two models. The torso model included intracavitary blood, lungs, and a skeletal muscle layer. A list of conductivity values in the heart and torso was published previously.7 Propagating activation was simulated based on ionic transmembrane currents by a monodomain reaction-diffusion equation8 at 0.25 mm resolution. Membrane ionic currents at each of the 25 million points that represented the ventricular myocardium were computed with a specific membrane model for human ventricular myocytes.9 This model distinguishes subendocardial, mid-myocardial, and subepicardial cell types. In addition, we implemented differences between LV and right-ventricular cells as published previously,10 but with the maximum conductivity of the slow delayed rectifier current set to 0.5 nS/pF in LV subepicardial cells to obtain concordant T-waves in the simulated ECGs. There were no apicobasal or posterior–anterior gradients in repolarization characteristics implemented in our model.
Computed transmembrane currents were injected in a bidomain model of a human torso at 1 mm resolution.7 This model was solved to obtain potentials throughout the torso, from which the 12-lead ECG and unipolar electrograms were extracted. Wilson's central terminal was used as the reference for electrograms and precordial ECG leads.
All simulations were performed using propag-5, a cardiac simulation package suitable for large-scale parallel computers.7,8,11,12
Normal ventricular activation was simulated using ∼1000 stimulation sites previously determined by Lorange and Gulrajani13 to mimic the early activation sites observed by Durrer et al.14 in the normal human heart. LBBB was simulated by removing the LV sites from this set. CRT was simulated using a stimulation site in the right-ventricular apex and another on the left-ventricular epicardium, to mimic a typical biventricular pacing situation. These two sites were activated simultaneously. Assuming a short atrioventricular delay, we omitted all other activation sites in the CRT simulations.
Reduced coupling was simulated by reducing the ‘intracellular’ component of the bidomain conductivities.15 This is equivalent to the compound electrical conductivity of the cytoplasm and the gap junctions.16 Longitudinal and transverse conductivity, i.e. the conductivity along and across the dominant myocyte orientation, were reduced proportionally. The ‘extracellular’ conductivity, which represents the conductivity of the interstitium and non-myocardial tissue components, was left unmodified.
Results
Simulated activation patterns for normal ventricular activation, LBBB, and biventricular pacing are shown in Figure 1. The normal activation pattern (panel A) resembles the pattern observed in normal human hearts.14 In the LBBB simulation the right-ventricular myocardium, including approximately one-third of the interventricular septum, was activated normally, while the LV was activated in a circumferential pattern along the inferior and lateral walls and along the LV apex. In the CRT simulation (panel C) the right-ventricular activation was quite different with activation proceeding predominantly from apex to base. The bases of the right ventricle and of the interventricular septum were activated later than in the LBBB simulation.

Activation sequence in the ventricles for normal activation (A), left bundle-branch block (B), cardiac resynchronization therapy (C), 50% uncoupling (D), left bundle-branch block with 50% uncoupling (E), and cardiac resynchronization therapy with 50% uncoupling (F). The colour scale ranges from 0 to 200 ms with 10 ms intervals.
Introduction of 50% uncoupling in these three cases led to a slowing of conduction with only minor changes in the pattern. In the CRT case, the left ventricular free wall was excited simultaneously with the septum, but parts of the left ventricular base in both the anterior and inferior walls were now activated later than in the LBBB simulation.
For a better perception of the swiftness of ventricular activation, panel A of Figure 2 shows the amount of activated tissue as a function of time for all six simulations shown in Figure 1. As expected, activation in LBBB and CRT was slower than in the normal heart. Paced activation initially spread more slowly than in LBBB, but it overtook after 70–100 ms and ended up to 20 ms earlier. Panel B of Figure 2 summarizes the time interval between the instants of 10 and 90% ventricular activation in each case. Although biventricular pacing did not reduce QRS duration compared with LBBB, it did activate the majority of the ventricular muscle more rapidly. The advantage was 35 ms in the 50% coupling case and 18 ms in the normally coupled ventricles.

(A) Degree of activation of the ventricles as a function of time. Blue traces, normal conductivity; red traces, 50% reduced conductivity. Dash-dotted lines, normal conduction system. Dashed lines, left bundle-branch block. Solid lines, biventricular pacing. (B) Time interval between the instants of 10 and 90% ventricular activation for each of the traces in panel A.
Figure 3 compares a simulated ECG with LBBB to one with 50% reduced coupling in the left ventricle and to a simulated normal ECG. Both LBBB and uncoupling caused a leftward shift in the frontal-plane QRS axis. However, there was a striking difference in wave amplitudes. LBBB produced S waves of 3–4 mV amplitude in the right precordial leads. In contrast, uncoupling left the amplitudes of these S-waves unaffected, while it reduced R-wave amplitude in the left precordial leads.
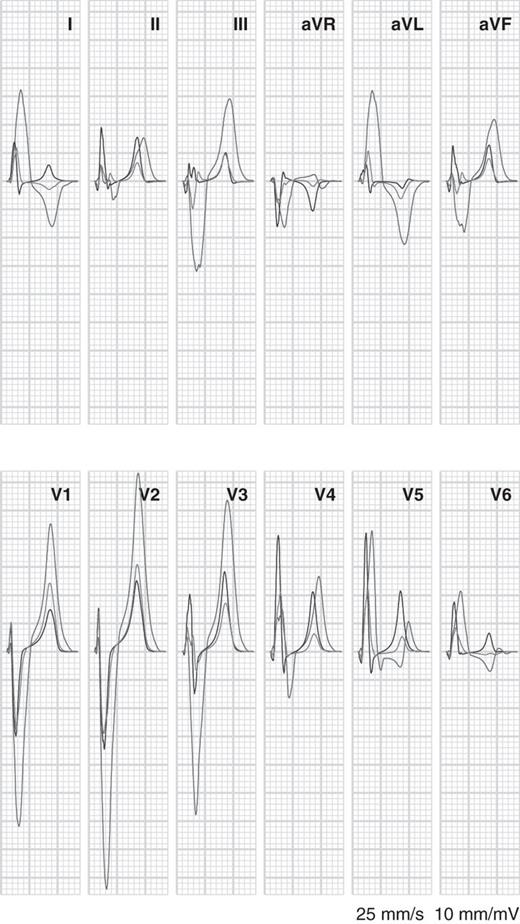
Simulated electrocardiograms for normal activation with normal conductivity (green), normal activation with 50% coupling in the left ventricular (blue), and left bundle-branch block with normal conductivity (red).
Both LBBB and uncoupling increased QRS duration, but LBBB did so more strongly than the 50% uncoupling case presented here. Normal QRS duration was 90 ms; with 50% uncoupling it was 120 ms, and with LBBB it was 140 ms.
The combination of LBBB and reduced coupling is illustrated in Figure 4. At 50% uncoupling, S-wave amplitudes were reduced by roughly 1 mV in the right precordial leads. In general, uncoupling reduced QRS and T-wave potentials. QRS duration increased from 140 ms for LBBB alone to 160 ms with 20% uncoupling and 190 ms with 50% uncoupling.
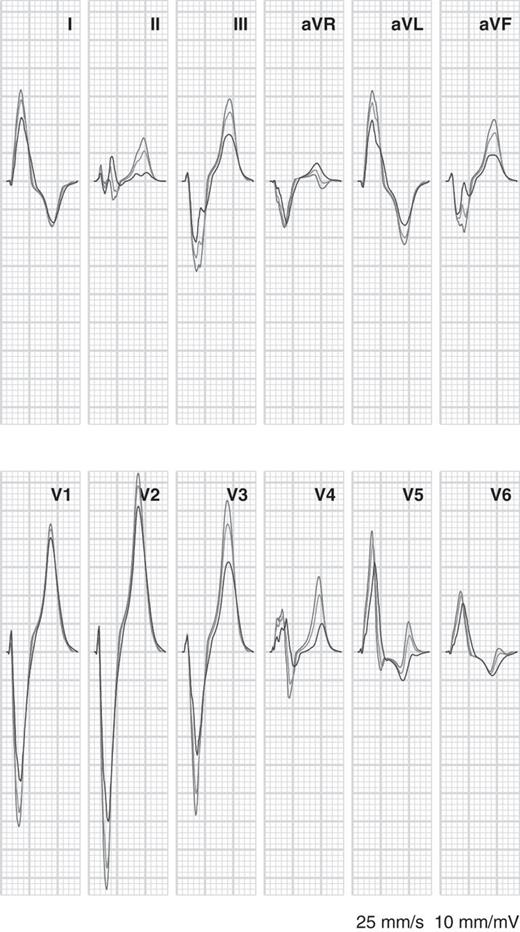
Simulated electrocardiograms for left bundle-branch block with normal tissue conductivity (red, same as red tracings in Figure 3), left bundle-branch block with 20% uncoupling in the left ventricular (blue), and left bundle-branch block with 50% uncoupling in the left ventricle (green).
Electrocardiograms simulated with a combination of CRT and uncoupling are illustrated in Figure 5. With normal coupling the QRS duration was 180 ms. Introduction of 50% conductivity reduction led to an increase in QRS duration to 190 ms and increased T-wave discordance in most leads. Compared with the LBBB simulation, the amplitude of the R, S, and T-waves was greatly reduced by the application of biventricular pacing, which led to two wavefronts moving in opposite directions in the LV. In leads I, aVR, V5, and V6 the polarity of the QRS complex was reversed with respect to the LBBB simulation. QRS duration was not markedly reduced.
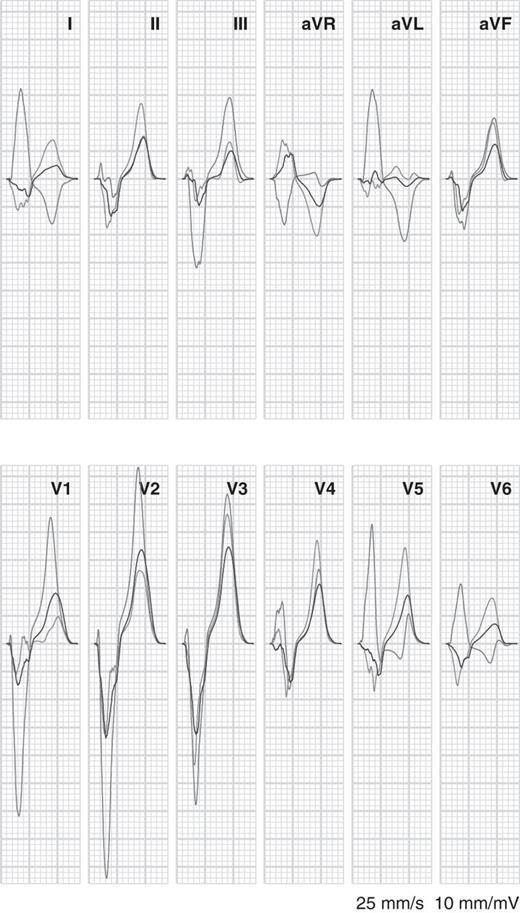
Simulated electrocardiograms for left bundle-branch block with normal tissue conductivity (red, same as red tracings in the previous figures), cardiac resynchronization therapy (blue), and cardiac resynchronization therapy with 50% uncoupling in the left ventricle (green).
Unipolar electrograms from the LV cavity are shown in Figure 6. Five positions were chosen: one in the middle of the cavity and four on the endocardium in a plane that crossed the papillary muscles. Signals are shown for LBBB (red) and for 50% uncoupling without LBBB (blue). The differences are obvious: when only myocardial uncoupling was present and the specific conduction system was intact, subendocardial activation occurred much earlier. The cavity potential was also different. In the uncoupling case it showed the smooth negative complex that is observed in the normal heart,17,18 whereas in LBBB it was biphasic: first positive and then negative.
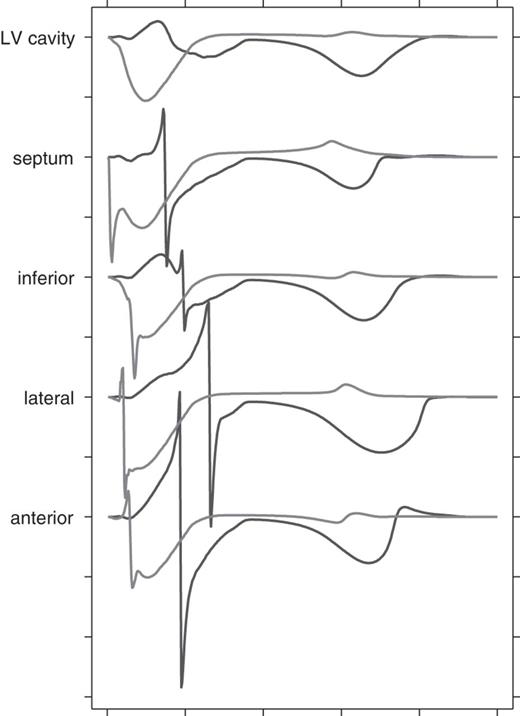
Simulated unipolar endocardial electrograms from the left ventricular at the level of the papillary muscles. Red Black: left bundle-branch block; blue: 50% uncoupling without left bundle-branch block. Tick marks along the vertical axis are 10 mV apart; those along the horizontal axis 100 ms. Wilson's central terminal was used as the reference.
Discussion
The present study demonstrates that diffuse LV electrical uncoupling and LBBB both create a prolonged QRS duration on the ECG and left axis deviation, but that the amplitudes are considerably larger during LBBB. Furthermore, uncoupling, whether in the normal or LBBB heart, reduces amplitudes of QRS complex and T-wave. The sequence of electrical activation, as predicted by the model, was quite similar to those measured in patients2 and in dogs with LBBB.19 Moreover, the surface ECG in the model showed many similarities with those clinically recognized. In agreement with published criteria,20 the LBBB ECG showed broad R-waves in leads I, aVL, V5, and V6; absent Q-waves in leads I, V5, and V6; R peak occurring at 80 ms in V6; and T-wave discordance in all leads except for V5. The ECG simulated with 50% uncoupling showed signs of incomplete LBBB, such as a QRS duration of 120 ms, left axis deviation, and R peak occurring near 60 ms in V4–V6, but not absence of Q-waves in V5 and V6, while a Q-wave was already absent in lead I in the normal simulation.
The QRS duration of 140 ms in the LBBB simulation was in the range (146 ± 15 ms) of values reported for asymptomatic LBBB patients and the value of 190 ms in LBBB with 50% uncoupling in the range (164 ± 35 ms) of symptomatic heart failure (HF)/LBBB patients.21 Total ventricular activation times were considerably larger than the QRS durations, consistent with the small amounts of tissue that were depolarized during the first and last 10 ms of ventricular activation (Figure 2).
By convention, an ECG with leftward axis rotation and a QRS duration exceeding 120 ms is called an LBBB pattern.20 Whether these criteria actually indicate a conduction block in the left bundle branch is uncertain. Auricchio et al.2 found normal transseptal activation times in several patients with LBBB ECGs who received a biventricular pacemaker for CRT, indicating that at least part of their LV conduction system was intact and conduction delay occurred in the working myocardium. Strauss et al.1 have argued that a true LBBB should result in a QRS duration of at least 140 ms. Previous computer simulation studies of LBBB support this criterion.4,22 These studies also demonstrated very large QRS amplitudes. However, the majority of patients with LBBB ECGs do not have such large amplitudes, even if their QRS duration exceeds 140 ms.
Other criteria proposed by Strauss et al.1 are QS or rS configuration in leads V1 and V2 and mid-QRS notching or slurring in at least two of leads V1, V2, V5, V6, I, and aVL. Our simulated LBBB ECG fulfills these criteria, although notching was very subtle. In contrast, the 50% uncoupling simulation had a QRS duration of only 120 ms, rS configuration in V1 and V2 that was not different from normal, and notching only in leads II, aVR, and V3. Thus, our simulated ECGs are correctly classified according to their criteria. Figure 2 shows that the implication for CRT is also correct: biventricular pacing only improved ventricular activation when true LBBB was present.
In a previous study, Bacharova et al.23 simulated the effect of reduced propagation velocity in the LV on the ECG. In our more physiologically detailed model wavefront propagation is an emergent phenomenon and its velocity cannot be changed at will. However, as expected, propagation velocity decreased in our model when tissue conductivity was reduced. Combining the results of Bacharova et al.23 with ours, we can see that reduced velocity by itself increases QRS amplitude, but reduced conductivity reduces both velocity and QRS amplitude. The electrical forces generated by a wavefront are proportional to the conductivity, whereas velocity is proportional to its square root.24 Analogous to what we previously found in non-LBBB ECG simulations,3 the net effect of uncoupling is therefore QRS prolongation with reduced amplitude. In true LBBB, on the other hand, there is presumably no change in conductivity but only a lack of cancellation of electrical forces in the LV. This leads to larger than normal amplitudes.
Uncoupling by 50% in LBBB simulations reduced the increased QRS amplitudes by about one third, while increasing QRS duration from 140 to 190 ms. In HF patients, QRS durations exceeding 160 ms in combination with nearly normal amplitudes are not uncommon. Gap-junctional remodelling, an important modifier of electric coupling, has been associated with several cardiac pathologies, including HF25 and hypertension.26 Coupling is also reduced with age, due to loss of myocytes and replacement fibrosis.27 It is therefore plausible that reduced coupling affects the QRS pattern in HF patients with an LBBB ECG.
The ability to diagnose conduction disorders in the working myocardium separately from those in the specialized conduction system may be important when biventricular pacemaker implantation for CRT is considered. Reduced coupling increases susceptibility to arrhythmia.27,28 On the other hand, CRT would not improve ventricular activation if only 50% uncoupling were present (Figure 2), whereas in the case of true LBBB, with or without uncoupling, it improved ventricular activation time by 35 and 18 ms, respectively. The increase in QRS duration caused by uncoupling during CRT was less than in LBBB. This is expected because the distances that the wave fronts travel during CRT are shorter.
According to our model, it should be straightforward to distinguish between uncoupling of the working myocardium and block in the conduction system based on unipolar electrograms measured in the LV cavity. Measured with respect to Wilson's central terminal, the cavity potential would be negative in the former case, and biphasic in the latter. The monophasic negative complex in the uncoupling case is, like in the normal heart,17,18 due to transmural conduction from endocardium to epicardium. In the case of a block in the left-bundle branch, activation first approaches the LV cavity, causing a positive wave. This is followed by a negative wave when activation reaches the lateral wall.
Limitations
A limitation of any model is that it may differ in important ways from the actual patient. A clear shortcoming of our model is that it produces tall peaked T-waves even in the normal case. Dispersion in repolarization properties in this model was partly based on studies in canine hearts and tissue preparations, and may not be applicable to human or even to the physiological situation in canine.29,30 Therefore our interpretation focuses on the characteristics of the QRS complex.
Our simulated ECGs, especially those with LBBB, showed peaked QRS complexes in lead V6. In the majority of LBBB patients this complex has a clear, possibly notched plateau. This difference may be caused by a lack of early activation sites in the basal right-ventricular side of the septum in our model. The presence of more activation sites there could cause a more rapid upstroke of V6 and allow a plateau phase. In the studies of Durrer et al.14 in the normal human heart, some hearts had early activation in this area and others did not.
Studies in canine hearts have demonstrated a thin endocardial muscle layer, in which conduction velocity along the fibre orientation is intermediate between those of the Purkinje network and of deeper myocardium.19,31 Our model does not include such a layer. If it is present in human hearts, its contribution during normal ventricular activation is likely included in the early activation sites that we used. However, its possible role in LBBB and during ventricular pacing was not represented in our model.
The ECG in HF patients could be modified also by remodelling of other ion channels than connexins,32 dilatation, fibre disarray, and hypertrophy. However, our purpose was not to mimic all possible disease states in detail, but primarily to study the roles of cellular uncoupling, bundle branch block, and the combination of the two.
Conclusion
Diffuse LV electrical uncoupling and LBBB both create a prolonged QRS duration and left axis deviation on the ECG, but the amplitudes are considerably larger during LBBB. In sinus rhythm, in LBBB, and during CRT, uncoupling increases QRS duration and reduces amplitudes of QRS complex and T-wave. These findings may help to better diagnose conduction abnormalities in patients with HF, especially those who are candidates for CRT.
Conflict of interest: A.A. has received research grants from Medtronic Inc, Boston Scientific Corp, St Jude Medical, and Biotronic and is advisor to EBR Systems, Medtronic Inc, and Sorin. F.W.P. has received research grants from Medtronic Inc, Boston Scientific Corp, and EBR Systems and is advisor to Medtronic Inc.
Funding
This work was supported by a grant from the Swiss National supercomputing Centre (CSCS) under project ID 268 and by the project ‘A High Performance Approach to Cardiac Resynchronization Therapy’ within the context of the ‘Iniziativa Ticino in Rete’ and the ‘Swiss High Performance and Productivity Computing’ (HP2C) Initiative. M.P. was financially supported by a grant from the Fondazione Cardiocentro Ticino. L.B. was partly supported by grant APVV-0134-11, Slovak Republic.
