


Abstract
The objective is to assess electrocardiographic characteristics predicting the precise location of ventricular arrhythmia (VA) origin within the right ventricle (RV) close to the His bundle (HB) region.
Twenty-five patients (14 men, age 65 ± 14 years) underwent successful catheter ablation of para-Hisian VA. Ventricular arrhythmias were considered to arise in the vicinity of the HB region based on the criteria that mapping exhibited the earliest RV activation before QRS onset in the HB region. Surface 12-lead electrocardiogram during the para-Hisian VAs was analysed. Of the 25 patients, 8 originated from the RV antero-septum just above the HB region, and 17 arose from the RV mid-septum just below the HB region. There was no significant difference in precedence of the local ventricular electrogram of the HB region from the onset of surface QRS during VAs. Surface electrocardiographic findings were characterized according to R-wave amplitude in lead I (0.43 ± 0.18 vs. 0.67 ± 0.19 mV, P = 0.005), mean R-wave amplitude in inferior leads (1.12 ± 0.32 vs. 0.71 ± 0.24 mV, P = 0.002), R-wave amplitude ratio of leads III/II (0.77 ± 0.10 vs. 0.50 ± 0.23, P = 0.005), incidence of S-wave in lead III [1/8 (13%) vs. 16/17 (94%), P < 0.001], and QS morphology in lead V1 [3/8 (38%) vs. 17/17 (100%), P = 0.001].
Despite their adjacent locations, para-Hisian VAs could be classified into two subgroups with distinctive electrocardiographic characteristics according to origin either above or below the HB region. The present findings can be helpful for planning catheter ablation of para-Hisian VAs, and can reduce the risk of inadvertent atrioventricular block.
Introduction
Radiofrequency (RF) catheter ablation is widely accepted as a safe and reliable therapy of idiopathic ventricular arrhythmia (VA) originating from the ventricular outflow tract.1–6 It has been reported that idiopathic VAs can arise from the right ventricular (RV) septum in the vicinity of the His bundle (HB),7–15 and the incidence of para-Hisian VA is not neglegible.7,8 Radiofrequency catheter ablation of the para-Hisian VAs has the potential risk of inadvertent damage to the atrioventricular conduction system. As previously described, knowledge of electrocardiographic characteristics of para-Hisian VAs can be helpful for differentiation from VAs originating from the RV outflow tract.8 However, little is known about detailed characteristics of electrocardiographic morphology that can predict the precise localization of VA origin within para-Hisian areas. The present study was undertaken to clarify these points.
Methods
Study population
This retrospective study included 262 consecutive patients (128 men and 134 women, mean age 57 ± 16 years old) who underwent successful endocardial RF ablation of idiopathic VAs with a left bundle branch block morphology and inferior-axis deviation. No structural heart disease was apparent by physical examination, echocardiography, or coronary angiography. At least once before the ablation procedure, 24-h ambulatory Holter monitoring was performed. All antiarrhythmic drugs (AADs) except for amiodarone were discontinued for at least five half-lives before the procedure. Amiodarone was stopped at least 1 month before the procedure. All patients gave their written informed consent prior to the procedure.
Electrophysiological study
Two 5-French quadripolar catheter were introduced from the right femoral vein and placed at the RV apex and HB region, respectively. If few VAs were observed at the beginning of the procedure, burst pacing from the RV apex was performed with addition of intravenous isoproterenol (0.5–3.0 µg/min) infusion to provoke the clinical arrhythmia. A systematic anticoagulation with heparin was maintained during the procedure. The surface 12-lead electrocardiogram (ECG) and intracardiac electrograms were continuously monitored at a speed of 100 mm/s and stored on a computer-based digital amplifier (Labsystem Pro, Bard Electrophysiology, MA, USA).
Mapping and radiofrequency catheter ablation
Mapping and ablation were performed using a 7-French 4 mm tip non-irrigated catheter (Fantasista, Japan Lifeline, Tokyo, Japan) introduced from the right femoral vein for the RV or from the right femoral artery for the aortic sinus cusps. The origin of clinical VA was searched by activation and pace mapping. If the ventricular activation from the HB region were the earliest of the entire RV mapping site, we mapped the aortic sinus cusps. Pace mapping was performed at a pacing cycle length of 500 ms at a current just greater than diastolic threshold by using the distal bipolar electrodes. Radiofrequency energy was applied at the site where the earliest ventricular activation was recorded or where a matching pace map was obtained. A matching pace map was defined as a pace map that matched the QRS complex of a target VA in at least 10 of 12 leads. Radiofrequency energy was applied in a temperature-controlled manner at a temperature setting of 50–55°C and maximum power output of 50 W up to 120 s at the presumed ablation site. If any acceleration or reduction of the clinical VAs was not observed during the first 15 s of the RF application, the RF delivery was terminated and the catheter was repositioned. If the target VAs were affected within the first 15 s of RF application, RF delivery was continued. If the earliest ventricular activation and best pace mapping was observed at the RV septum in the vicinity of the HB region, RF energy was delivered starting with an initial power setting of 20 W by using a long sheath (SL0, St Jude Medical, St Paul, MN, USA) in order to assure the stability of the ablation catheter. If an accelerated junctional rhythm was present during RF energy delivery, the RF current was immediately discontinued. Thereafter, if no effect on the atrioventricular conduction system was confirmed, we re-started it during right atrial pacing at a rate slightly faster than the junctional beats. When a reduction in the para-Hisian VA was observed without any effect on the atrioventricular conduction system, the RF energy was gradually titrated up to the target output under continuous bilateral fluoroscopic guidance. If the site demonstrating the earliest activation during VA and perfect pace map was where an apparent HB potential of >0.1 mV was recorded, we forwent the elimination of the VA by ablation to avoid complete atrioventricular nodal block.
Definition of His bundle location for origin of ventricular arrhythmia
The HB region was determined as the site where the largest HB potential was recorded under the guidance of the right and left anterior oblique fluoroscopic views. The VA were considered to arise from the RV septum in the vicinity of the HB region based on the criteria that mapping exhibited the ventricular activation recorded in the RV septum close to the HB region preceded the onset of surface QRS during the VA. The anatomical relation between the effective ablation site of para-Hisian VA and the site recording the largest HB potential was assessed under the bilateral fluoroscopic guidance.
Electrocardiographic analysis
The analysis of surface 12-lead ECG during the clinical VA focused on the following characteristics: (i) the duration of the total QRS complex; (ii) the morphology of the QRS complex in leads I, II, III, aVR, aVL, aVF, and V1; (iii) the magnitude of the R-wave in leads II, III, and aVF; (iv) the R-wave amplitude ratio of lead II and III, which was calculated as a percentage by dividing the R-wave amplitude in lead III by that in lead II; and (v) the site of R-wave transition in the precordial leads. Capital letters (Q, R, and S) are used here to refer to waves of relatively high amplitude (>0.5 mV), and lowercase letters (q, r, and s) refer to waves of relatively low amplitude (<0.5 mV).
Follow-up
All AADs were discontinued after the procedure in all patients. After the ablation procedure, ECG monitoring was performed for 48 h in all patients. After hospital discharge, the patients underwent follow-up consisting of a clinical interview, 12-lead ECG, and 24 h Holter monitoring 1 month later and then every 3–6 months at our cardiology clinic. If the patients had any rhythm-related symptoms, a 12-lead ECG and 24 h Holter monitoring were recorded to document the cause of the symptoms. Successful ablation was defined as the following: the absence of spontaneous or induced clinical VAs during an isoproterenol infusion and burst RV pacing at the end of the procedure; the absence of these VAs after 48 h of continuous electrocardiographic monitoring after ablation without AADs; and no recurrence of the target VAs in the absence of AADs during follow-up.
Statistical analysis
Continuous values are expressed as mean ± standard deviation and were compared using unpaired Student's t-test. Categorical variables are reported as number and percentages, and were compared using Fisher's exact test. The sensitivity, specificity, and positive and negative predictive accuracies of the electrocardiographic variables were calculated for predicting the preferential location of para-Hisian VA origin within para-Hisian areas. The diagnostic accuracies of continuous electrocardiographic variables for predicting it were assessed using receiver-operating characteristic (ROC) curves and expressed by the area under the curve (AUC) with 95% confidence interval (CI). A cut-off value was determined tentatively as the point on the ROC curve closest to the upper left corner. A value of P < 0.05 was considered statistically significant.
Results
Among the total 262 patients, the successful ablation site was located at the RV outflow tract in 193, the RV septum close to the His-bundle region in 25, aortic cusp in 39, and the left ventricular outflow tract in 5 patients. We assessed the electrocardiographic and electrophysiological characteristics in the 25 patients (14 men, age 65 ± 14 years old) who underwent successful RF ablation of para-Hisian VA. All the 25 patients had a normal ECG during sinus rhythm, and no structural heart disease was apparent by physical examination, echocardiography, or coronary angiography. Mean left ventricular ejection fraction was 66.7 ± 6.2%. These 25 patients were classified into two subgroups according to location of the successful ablation site: Group-A (n = 8), RV antero-septum just above the site where the largest HB potential was recorded, and Group-B (n = 17), RV mid-septum just below the HB region (Figure 1).
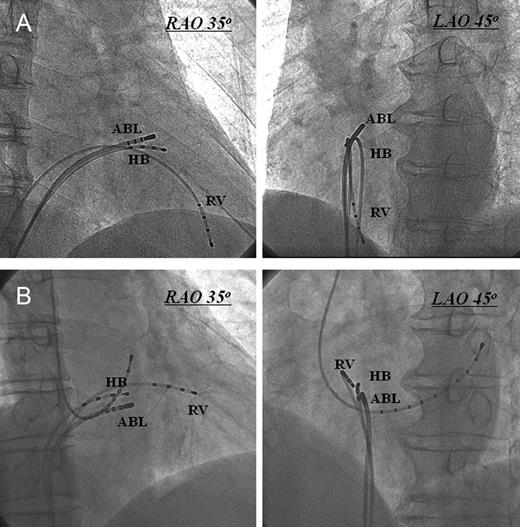
Right anterior oblique and LAO radiographic views of the ablation catheter at the typical sites of successful ablation. (A) Ablation catheter at the right ventricular antero-septum just above the His bundle region. (B) Ablation catheter at the right ventricular mid-septum just below the His bundle region. ABL, ablation catheter; HB, His bundle; LAO, left anterior oblique; RAO, right anterior oblique; RV, right ventricle.
Clinical and electrophysiologic findings
Monomorphic ventricular tachycardia, defined as three or more consecutive ventricular premature contractions, was present in 7 patients (Group-A: 3 and Group-B: 4), and the remaining 18 patients had monomorphic ventricular premature contractions (Group-A: 5 and Group-B: 13). Group-B patients was significantly older than Group-A patients (Group-A: 54 ± 18 years old vs. Group-B: 70 ± 9 years old, P = 0.027). There was no difference in gender. There was no significant difference in the number of ventricular ectopic beats per 24 h between the groups (Group-A: 13 967 ± 7018 vs. Group-B: 16 851 ± 9530, P = 0.45). No statistically significant difference was observed in the precedence of the local ventricular electrogram of the HB from the onset of the surface QRS during VAs (Group-A: 21.9 ± 4.2 ms vs. Group-B: 23.0 ± 4.3 ms, P = 0.54).
Ablation results of para-Hisian ventricular arrhythmia
During the procedure, the clinical arrhythmia was observed spontaneously in 23 patients, and induction of arrhythmias by burst pacing or an isoproterenol infusion was needed in 2 patients. In all the 25 patients, clinical VAs were successfully eliminated by ablation without any serious complications except for a transient right bundle branch block in 1 patient. During follow-up, all the 25 patients were free from arrhythmias without any AADs after a single ablation procedure.
There was no significant difference in the mean number of ablation attempts (Group-A: 3.6 ± 2.1 vs. Group-B: 3.3 ± 2.5, P = 0.75), the mean duration of the RF energy applications (Group-A: 3.3 ± 2.0 min vs. Group-B: 2.9 ± 1.8 min, P = 0.64). The precedence of the local ventricular activation of the ablation site was also similar between the groups (Group-A: 28.6 ± 4.3 ms vs. Group-B: 28.1 ± 4.4 ms, P = 0.77). The incidence of an HB potential of <0.1 mV at successful ablation site was higher in Group-B [5/17 (29%)] than in Group-A [1/8 (12%)]. Of important, an accelerated junctional rhythm was present during the RF application in 6 of 17 (35%) Group-B patients, whereas it was never observed in Group-A patients, suggesting the high risk of complication of atrioventricular conduction block during ablation on the RV mid-septum just below the HB region. In the Group-B, 15 of 17 (88%) patients had high-frequency potentials with fragmentation in the distal bipolar electrograms on the site demonstrating the earliest activation during VAs and excellent pace map (Figure 2), whereas in the Group-A, only 2 of 8 (25%) had fragmented potentials on the presumed ablation site and the remaining 6 had a single R-wave without any fragmentation.
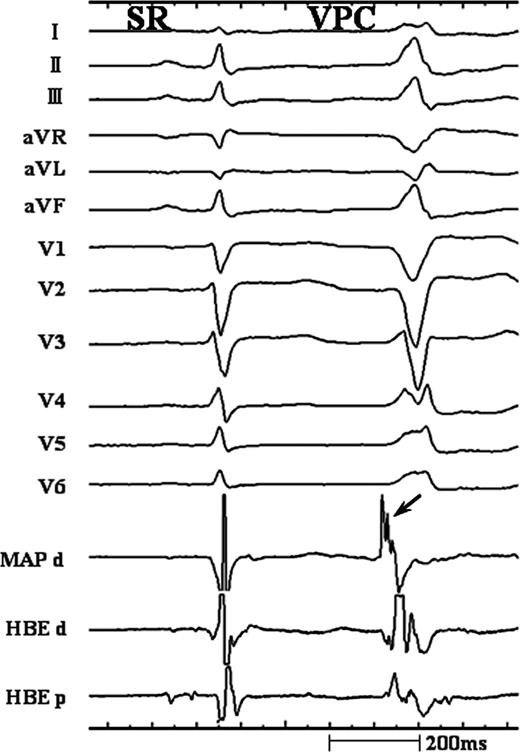
Intracardiac recordings at the successful ablation site of ventricular arrhythmia originating from the right ventricular mid-septum just inferior to the His bundle (HB). During the ventricular arrhythmia, the earliest ventricular activation recorded from the distal bipolar signal of mapping catheter (MAP d) and HB region preceded the onset of the QRS complex by 28 and 20 ms, respectively. Of note, high-frequency potential with fragmentation (arrow) was observed in the bipolar electrogram of MAP d.
Electrocardiographic findings
Representative 12-lead ECGs of para-Hisian VAs are shown in Figure 3. Electrocardiographic characteristics of these VAs are shown in Table 1, and the comparison of the characteristics between the groups was summarized in Table 2. In all patients, QRS complexes during VAs showed a left bundle branch block morphology and inferior-axis deviation. Precordial R-wave transition occurred between leads V2 and V3 in 4 of 8 (50%) Group-A patients and in 10 of 17 (59%) Group-B patients. There was no significant difference between groups in mean QRS duration in the inferior leads. A QS morphology in lead V1 was observed in three of eight (38%) Group-A patients, whereas all Group-B patients had a QS morphology in lead V1 (P = 0.001). A monophasic R- or r-wave in lead I was observed in all patients. A taller R-wave amplitude in lead I during para-Hisian VA than that during sinus rhythm was observed in 5 of 8 (63%) Group-A patients and in 14 of 17 (82%) Group-B patients (P = 0.34). An R-wave amplitude in lead I in Group-B was significantly higher than that in Group-A (Group-A: 0.43 ± 0.18 mV vs. Group-B: 0.67 ± 0.19 mV, P = 0.005). An R- or r-wave in lead aVL was observed in 6 of 8 (75%) Group-A patients and 16 of 17 (94%) Group-B patients (P = 0.23). An S- or s-wave in lead III was observed in 1 of 8 (13%) Group-A patients and in 16 of 17 (94%) Group-B patients (P < 0.001). Mean R-wave amplitude in the inferior leads in Group-B was significantly smaller than that in Group-A (Group-A: 1.12 ± 0.32 mV vs. Group-B: 0.71 ± 0.24 mV, P = 0.002). The R-wave amplitude ratio in leads II and III, which was calculated as a ratio by dividing the R-wave amplitude in lead III by that in lead II, was significantly greater in Group-A than in Group-B (Group-A: 0.77 ± 0.10 vs. 0.50 ± 0.23, P = 0.005). The optimal cut-off values and predictive accuracies of these electrocardiographic characteristics for VA of Group-B are summarized in Table 3. According to ROC curve analysis, the optimal cut-off value of R-wave amplitude in lead I, mean R-wave amplitude in the inferior leads, and R-wave amplitude ratio in leads II and III for predicting VA of Group-B was 0.45, 0.91, and 0.67 mV, respectively. ROC curve analysis represented that the AUC of R-wave amplitude in lead I, mean R-wave amplitude in the inferior leads, and R-wave amplitude ratio in leads II and III were calculated to be 0.842 (95% CI: 0.641–0.955, P < 0.001), 0.857 (95% CI: 0.659–0.962, P < 0.001), and 0.879 (95% CI: 0.686–0.973, P < 0.001), respectively.
Clinical, electrophysiological, and electrocardiographic characteristics
| QRS | |||||||||||||||
|---|---|---|---|---|---|---|---|---|---|---|---|---|---|---|---|
| Patients | Age (years) | Sex | Type | I | II | IIII | aVR | aVL | aVF | V1 | Transition | Duration (ms) | R amplitude (mV) | III/II ratio | V-QRS His (ms) |
| Group-A | |||||||||||||||
| 1 | 58 | F | NSVT | r | R | R | QS | qr | R | rS | V3–V4 | 119 | 1.54 | 0.86 | 30 |
| 2 | 76 | M | VPC | r | R | R | QS | qr | R | rS | V2–V3 | 124 | 1.44 | 0.88 | 25 |
| 3 | 60 | M | NSVT | r | R | R | QS | rs | R | rS | V3–V4 | 127 | 0.96 | 0.74 | 21 |
| 4 | 74 | F | VPC | R | R | Rs | QS | r | Rs | QS | V2–V3 | 121 | 0.6 | 0.58 | 24 |
| 5 | 43 | F | NSVT | R | R | R | QS | r | R | rS | V2–V3 | 132 | 0.89 | 0.70 | 17 |
| 6 | 23 | M | VPC | r | R | R | QS | qs | R | QS | V3–V4 | 128 | 1.14 | 0.87 | 20 |
| 7 | 39 | F | VPC | r | R | R | QS | qs | R | QS | V2–V3 | 125 | 1.37 | 0.80 | 19 |
| 8 | 57 | M | VPC | r | R | R | QS | rs | R | rS | V3–V4 | 136 | 1 | 0.74 | 19 |
| Group-B | |||||||||||||||
| 1 | 74 | M | NSVT | R | R | rs | QS | R | R | QS | V3–V4 | 125 | 0.61 | 0.43 | 26 |
| 2 | 62 | F | VPC | r | R | R | QS | qs | R | QS | V2–V3 | 133 | 0.90 | 0.80 | 20 |
| 3 | 64 | M | VPC | R | Rs | Rs | QS | qR | Rs | QS | V2–V3 | 120 | 0.97 | 0.67 | 18 |
| 4 | 53 | F | VPC | R | Rs | RS | QS | rsR | Rs | QS | V2–V3 | 123 | 0.87 | 0.59 | 30 |
| 5 | 64 | M | VPC | R | R | rs | QS | r | Rs | QS | V2–V3 | 122 | 0.63 | 0.51 | 24 |
| 6 | 68 | M | NSVT | R | Rs | RS | QS | qR | Rs | QS | V2–V3 | 119 | 0.90 | 0.50 | 26 |
| 7 | 76 | M | NSVT | R | R | RS | QS | qr | R | QS | V3–V4 | 128 | 0.70 | 0.66 | 20 |
| 8 | 62 | F | VPC | R | R | rS | QS | R | Rs | QS | V3–V4 | 125 | 0.65 | 0.28 | 22 |
| 9 | 71 | M | VPC | R | R | qrS | QS | R | qrS | QS | V3–V4 | 126 | 0.37 | 0.16 | 24 |
| 10 | 69 | M | VPC | r | R | Rs | QS | qr | R | QS | V3–V4 | 120 | 0.78 | 0.65 | 20 |
| 11 | 67 | F | VPC | R | R | Rs | QS | qR | Rs | QS | V2–V3 | 134 | 0.91 | 0.77 | 16 |
| 12 | 84 | M | VPC | R | R | QS | QS | R | QS | QS | V3–V4 | 122 | 0.12 | 0 | 18 |
| 13 | 79 | M | VPC | R | R | Rs | QS | rsr | Rs | QS | V2–V3 | 121 | 0.88 | 0.78 | 22 |
| 14 | 85 | M | VPC | R | R | qrS | QS | R | qrS | QS | V2–V3 | 129 | 0.33 | 0.17 | 20 |
| 15 | 82 | F | VPC | r | R | Rs | QS | qr | R | QS | V2–V3 | 119 | 0.89 | 0.5 | 28 |
| 16 | 64 | F | VPC | R | Rs | rS | QS | rsR | Rs | QS | V2–V3 | 118 | 0.83 | 0.53 | 29 |
| 17 | 72 | F | NSVT | R | R | rs | QS | R | R | QS | V3–V4 | 124 | 0.73 | 0.50 | 28 |
F, female; III/II ratio, the R-wave amplitude ratio in leads II and III; M, male; NSVT, non-sustained ventricular tachycardia; VPC, ventricular premature contraction; V-QRS His, the local ventricular activation time on the His bundle region relative to the surface QRS onset.
Comparison of the electrocardiographic characteristics
| Group-A (n = 8) | Group-B (n = 17) | P | |
|---|---|---|---|
| QRS duration (ms) | 127 ± 6 | 124 ± 5 | 0.23 |
| Precordial R-wave transition | |||
| V2–V3 | 4 | 10 | |
| V3–V4 | 4 | 7 | |
| Mean R-wave amplitude in inferior leads (mV) | 1.12 ± 0.32 | 0.71 ± 0.24 | 0.002 |
| Voltage ratio lead III/II | 0.77 ± 0.10 | 0.50 ± 0.23 | 0.005 |
| R-wave amplitude in lead I >0.5 mV | 2/8 (25%) | 14/17 (82%) | 0.010 |
| R-wave amplitude in lead I (mV) | 0.43 ± 0.18 | 0.67 ± 0.19 | 0.005 |
| R-wave in lead aVL | 6/8 (75%) | 16/17 (94%) | 0.23 |
| S-wave in lead III | 1/8 (13%) | 16/17 (94%) | <0.001 |
| QS in lead V1 | 3/8 (38%) | 17/17 (100%) | 0.001 |
Sensitivity, specificity, and positive and negative predictive accuracies for predicting para-Hisian ventricular arrhythmia arising from the right ventricular mid-septum just below the His bundle region
| Sensitivity (%) | Specificity (%) | Positive predictive value (%) | Negative predictive value (%) | |
|---|---|---|---|---|
| R-wave amplitude in lead I > 0.45 mV | 82 | 75 | 88 | 67 |
| R-wave amplitude in inferior leads <0.91 mV | 94 | 75 | 89 | 86 |
| Voltage ratio lead III/II < 0.67 | 82 | 88 | 93 | 70 |
| QS morphology in V1 | 100 | 63 | 85 | 100 |
| S-wave in lead III | 94 | 88 | 94 | 88 |
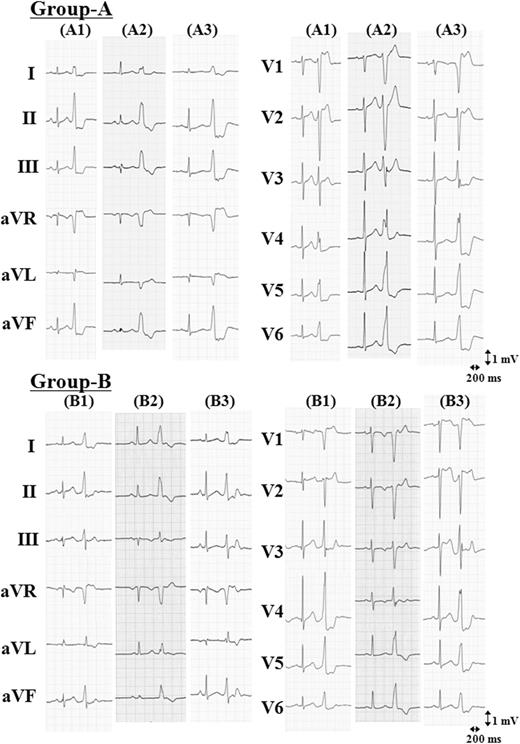
Representative 12-lead electrocardiograms of para-Hisian ventricular arrhythmiass. Ventricular arrhythmia originating from the right ventricular antero-septum above the His bundle region (Group-A). Ventricular arrhythmia originating from the right ventricular mid-septum below the His bundle region (Group-B).
Discussion
Electrocardiographic findings of para-Hisian ventricular arrhythmia and proposed mechanism
Prior study has reported the electrocardiographic characteristics of para-Hisian VA as the following: the monophasic R-wave in lead I, QS pattern in lead V1, relatively narrow QRS duration, relatively low R-wave amplitude in inferior leads, lower R-wave amplitude in lead III than in lead II, and an early precordial tranditional zone in lead V2–V3.8 Although these electrocardiographic characteristics of para-Hisian VAs were helpful for differentiation from the RV outflow tract, the electrocardiographic characteristics predicting the precise localization of VA origin within para-Hisian areas have not been studied. We found that despite their adjacent locations and no significant difference in the precedence of the local ventricular electrogram of the HB from the surface QRS onset during para-Hisian VAs, para-Hisian VAs were divided into two subgroups according to the anatomic site of origin, either above or below the site recording the largest HB potential. There were significant differences in the electrocardiographic characteristics between the groups. Of our findings in this study subjects, the electrocardiographic characteristics of the para-Hisian VA arising from the RV mid-septum just below the HB region are more consistent with the findings of the prior report.8 We found that an R-wave amplitude in lead I of >0.45 mV, a mean R-wave amplitude in the inferior leads of <0.91 mV, an R-wave amplitude ratio of lead III/II of <0.67, an S-wave in lead III, and a QS morphology in lead V1 have been developed to predict the site of para-Hisian VAs originating from the RV mid-septum just below the HB region. These electrocardiographic characteristics suggest that the breakthrough site of them have more posterior and rightward anatomic location than that of para-Hisian VAs arising from the RV antero-septum above the HB region.
Of note, we found that para-Hisian VAs arising from the RV mid-septum were mainly observed in elderly patients. The anatomy of the summit of the ventricular septum in the vicinity of the HB region and its structures are complex. Previous histopathologic study described that the summit of the ventricular septum close to the HB region in elderly patients tends to undergo mechanical stress derived from the friction between the sclerotic circular fibrous annulus and the ventricular septum.16 Another prior study has also shown that senile degeneration of collagenous tissue occasionally composes the central fibrous body and the interventricular component of the membranous septum.17 Although in the present study, the detailed histopathology of the para-Hisian VAs remains to be investigated, there seems to be the possibility of the relation between the senile degenerative changes in the tissue of RV mid-septum near the HB region and the mechanisms underlying this arrhythmias. In addition, we found that the local bipolar electrograms at the successful ablation site of the para-Hisian RV mid-septum VAs revealed high-frequency and fragmented potentials, as we reported recently.11 Whereas the signals recorded on a healthy tissue represent a high-amplitude single potential, fractionated signals are thought to result from non-uniform anistropic conduction through areas of myocardium where conduction is slowed down and interrupted by fibrosis.18–21 As the precise mechanisms cannot be clearly clarified with the present clinical methods, our findings can be speculatively explained by the hypothesis that the local ventricular electrogram at the successful ablation site might be derived from the local electrical activity arising from an underlying pathological tissue in the para-Hisian RV mid-septum. Interestingly, these characteristics of local electrograms were not common in the para-Hisian RV antero-septum VAs. These two forms of para-Hisian VAs might have not only different electrocardiographic characteristics but also different electrophysiological properties in regard to the causation of the arrhythmias. Further electrophysiological and histopathological studies are required to explore the precise mechanisms underlying para-Hisian VAs.
Clinical implications
When ablating the para-Hisian VA, the following technical practice can minimize procedural complications: (i) use of a long guiding sheath to assure the stability of the ablation catheter; (ii) use of cryoablation;22,23 (ii) mapping from both the right and left side;9 and (iv) knowledge of local electrogram characteristics at the successful ablation site.11 In addition to these techniques, the electrocardiographic findings of this study can be helpful for avoiding an ineffective ablation of para-Hisian VA. Radiofrequency energy application at the RV mid-septum just below the HB region carries a particularly high risk of inadvertent atrioventricular conduction block because of the very close anatomic relation of its location to the atrioventricular node. Furthermore, an accelerated junctional rhythm during ablation on the RV mid-septum was occasionally observed, whereas it did not occur during ablation on the RV antero-septum just above the HB region. This finding also underscores the high risk of complication of atrioventricular conduction block during ablation on the RV mid-septum just below the HB region. The present electrocardiographic findings can be helpful information to estimate the preferential localization of the origin of para-Hisian VA within the RV septum para-Hisian areas, leading to reduce the risk of inadvertent damage to the atrioventricular conduction system.
Study limitations
This study was a retrospective analysis of a small population of patients with para-Hisian VAs. At first, the differences in voltage between various leads should be ensured in a larger population, whereas the QS pattern in V1 and S-wave in lead III is reasonable to apply in clinical practice. Secondly, we determined the ablation site under fluoroscopic guidance, and did not use any of three-dimensional electroanatomical tools or intracardiac echocardiography. As the His-bundle signal was continuously confirmed during the mapping and ablation by using the quadripolar catheter, there was no doubt regarding whether the locations on the RV septum where we ablated was above or below the site recording the largest HB potential under continuous bilateral fluoroscopic guidance. However, the use of three-dimensional electroanatomical tools or intracardiac echocardiography might be helpful for assessing more precise anatomical relation between the ablation site and structure in the HB region. Further prospective studies in a larger study population are needed to ensure the accuracy of our findings and to evaluate more precise anatomical localization of mapping catheter within the para-Hisian region.
Two para-Hisian VAs failed to be ablated because of transient atrioventricular block during the ablation. In two patients, the sites demonstrating the earliest activation during VA and perfect pace map were RV mid-septum just inferior to the HB. One of them was successfully eliminated at the right coronary cusp. In this study, we excluded these patients, because the aim of the present study was to assess the electrocardiographic characteristics predicting the preferential location of VA origin within the RV septum near the HB region. As previously described, it should be emphasized that when the ventricular activation in the RV HB region preceded the QRS onset during VA, mapping from both the right side and left side should be performed to attenuate the risk of inadvertent atrioventricular block.9
Conclusions
Despite their adjacent locations, para-Hisian VAs could be classified into two subgroups with distinctive electrocardiographic characteristics according to site of origin, either above or below the HB region. The present electrocardiographic findings allows us to identify the preferential localization of VA origin within para-Hisian areas, and can be helpful for planning catheter ablation of para-Hisian VAs and minimizing the risk of inadvertent atrioventricular block.
Conflict of interest: none declared.
