


Abstract
Total cosine R-to-T (TCRT) measured from the standard 12-lead electrocardiogram (ECG) reflects the spatial relationship between depolarization and repolarization wavefronts and a low TCRT value is a marker of poor prognosis. We tested the hypothesis that measurement of TCRT or QRS/T angle from exercise ECG would provide even more powerful prognostic information.
The prognostic significances of TCRT and QRS/T angle were assessed from exercise ECG recordings in 1297 patients [age 56 ± 13 years (mean ± SD), 67% males] undergoing a clinically indicated bicycle stress-test and the subsequent follow-up. During an average follow-up of 45 ± 12 months, 74 patients died (5.7%); 34 (2.6%) were cardiac deaths, and 24 (1.9%) were sudden cardiac deaths. Total cosine R-to-T and QRS/T angle exhibited a correlation with the RR intervals in the total cohort, but the individual responses were variable, e.g. median correlation of TCRT-RR was 0.89 with an inter-quartile range from 0.55 to 0.98. A reduced correlation of TCRT-RR during the recovery phase of exercise ECG predicted cardiac death [adjusted heart rate (HR) 3.5, 95% confidence interval (CI): 1.8–6.8, P= 0.001] similarly as the baseline TCRT measured from ECG at rest (adjusted HR 3.4, 95% CI: 1.4–8.1, P= 0.01). The poor correlation between the TCRT-RR both during the exercise and recovery was specifically related to a risk of sudden cardiac death (adjusted HR 6.2, 95% CI: 2.1–17.8, P< 0.001).
Loss of rate-adaptation of the spatial relationship between depolarization and repolarization wavefronts is a strong predictor of cardiac death, especially of sudden cardiac death.
Introduction
Digital electrocardiography (ECG) has made it possible to analyse more complex ECG parameters, such as the descriptors of QRS and T-wave morphology.1,2 Recent studies have shown that these morphological variables analysed from digital ECG recordings are useful in prediction of cardiac mortality3 and sudden cardiac death.4 Until now, the analysis of these parameters has been mainly restricted to standard, supine 12-lead ECG,1,5,6 thus limiting the understanding of their dynamics. In our previous study, we described the dynamics of the QRS and T-wave morphology and the rate-dependence of these parameters during the standard exercise ECG.7 The study indicated that the total cosine R-to-T (TCRT) and QRS/T angle, which reflect the spatial difference between the depolarization and repolarization wavefronts, are significantly rate-dependent during both exercise and recovery periods.
In the present study, we have determined the rate-dependence of the QRS-T morphology in a large cohort of patients undergoing a clinically indicated exercise test and a subsequent follow-up. Our aim was to study whether impaired rate-dependence of QRS/T angle and the TCRT would convey an elevated risk for cardiac mortality or sudden cardiac death.
Methods
Patient population
The study protocol of Finnish Cardiovascular Study has been earlier described in detail.8 Briefly, all consecutive patients undergoing exercise stress-test at Tampere University Hospital and willing to participate in the study were recruited. A total of 1297 patients with technically acceptable exercise ECG were included in the study.
The main indications for the exercise test were diagnosis of coronary artery disease (CAD), an assessment of the vulnerability to arrhythmia during exercise, and evaluation of work capacity and adequacy of the CAD treatment, as well as the need to obtain an exercise test profile prior to an invasive procedure or after a myocardial infarction. The study protocol was approved by the Ethics Committee of the Tampere University Hospital District, Finland, and all patients gave informed consent prior to the interview and measurements.
Exercise electrocardiogram recordings
Symptom limited exercise tests were performed using a bicycle ergometer. The Mason-Likar modification with two additional leads was used in the 12-lead ECG recording. The exercise protocol consisted of an initial workload of 20–30 W with a gradual increase in load in steps of 10–30 W/min. Continuous digital ECG at 500 Hz was recorded throughout the test with CardioSoft exercise ECG system (Version 4.14, GE Medical Systems, Freiburg, Germany).
QRS-T morphology descriptors
The signal processing and the subsequent analysis were carried out with custom-made software written in Matlab (MathWorks, Inc., Natick, MA, USA). Powerline interference was reduced with a notch filter at 50 Hz. Baseline wander was removed with cubic spline interpolation through the PQ intervals. High frequency noise was suppressed with a 40 Hz lowpass filter. Ectopic and abnormally shaped beats were automatically removed from the analysis. Beats were considered to be ectopic if the preceding RR interval differed by >20% of the last valid RR interval. Beats with deviating morphology were identified with template matching; the initial template was constructed from the first 10 normal beats, and it was updated with each accepted beat. The threshold for acceptance was 95% match.
Samples consisting of 10 consecutive beats were extracted throughout the exercise and recovery periods at different heart rate (HR) levels (e.g. 80, 90, 100 bpm, etc.). In addition, one baseline sample and three time-fixed samples were taken from the recovery period at 30, 60, and 180 s after the maximum HR, which was considered to represent the peak exercise. Representative median beats of each independent ECG lead (I, II, V1–V6) were constructed from each accepted sample to further reduce the noise. Subsequently, QRS complex and T-wave offset were manually identified from each representative beat, after which the TCRT and QRS/T angle values were automatically calculated from the representative beat as described earlier.7 The QRS/T results were modified by taking the cosine of the values. This was done in order to obtain the same range of values for both the TCRT and QRS/T angle (i.e. values between −1 and 1).
The rate-dependency of TCRT and QRS/T angle during exercise and recovery were determined (in each individual) by calculating a correlation coefficient between the values measured at different sample-points (at different HR levels) and the corresponding RR intervals (TCRT-RR and QRST-RR, for TCRT and QRS/T angle, respectively). Spearman's correlation coefficient was used as it is a rank-based method and therefore does not require assumptions on the nature of the relationship between the parameter values and RR intervals. The correlation coefficient for the exercise period was calculated from the samples gathered between the beginning of the exercise and maximum HR. The correlation coefficient representing the recovery period was calculated from the samples gathered between the exercise peak and the 3 min recovery period, excluding the sample from the maximum HR. All exercise recordings were analysed blinded to the clinical and follow-up information.
Predefined risk variables
Prior to this study, we had conducted a pilot study with 20 CAD and 20 non-CAD patients from the same study population. We observed reduced rate-dependence and slower recovery of TCRT in the CAD group (data not shown). On the basis of these findings, we had a priori predefined the following variables for estimation of their prognostic value: TCRT and QRS/T angle measured at baseline and at the maximum HR, slope, and rate-dependency of TCRT and QRS/T angle (TCRT-RR and QRST-RR, respectively) during exercise and recovery periods. In addition, the values of maximum HR and heart rate recovery (HRR) after 1 min of recovery were determined as predefined risk variables.
Ejection fraction
Measurement of the left ventricular ejection fraction (LVEF) was not routinely measured in all patients referred to a clinical exercise test. Nevertheless, the LVEF was determined with either echocardiography or isotope techniques in 976 patients included in this study.
Follow-up
Death certificates were received from the Causes of Death Register, maintained by Statistics Finland. The certificates included causes of death based on the 10th revision of the International Classification of Diseases. Major endpoints of this study were all-cause mortality, cardiac mortality, and sudden cardiac death. Sudden cardiac death (cardiac death within 24 h after the onset of symptoms) was defined by an independent endpoint committee.
Statistical analysis
The data were analysed using the SPSS version 15 (SPSS, Inc., Chicago, IL, USA). Continuous, equally distributed values are reported as mean ± standard deviation (SD) and unequally distributed values are reported as median with lower and upper quartiles. Comparisons between patients with and without events were made using non-parametric U-test for unequally distributed data and independent samples t-test for data with a normal distribution. Distributions of categorical variables were compared with χ2 test. All continuous risk variables were dichotomized according to their optimal cut-off points obtained from the receiver-operating curves for the risk analysis with sensitivity at least 20% and cut-off value below median [above the median for age and body mass index (BMI)]. The dichotomization was done separately for cardiac and sudden cardiac deaths. The univariate and multivariate hazard ratios of the predefined risk variables for major endpoints were estimated with a Cox proportional hazards model. In the multivariate Cox regression analysis, a clinical model was constructed out of the clinical risk markers with a stepwise backward regression analysis. The clinical risk markers included age, usage of beta-blockers, BMI, CAD, diabetes, LVEF, baseline HR, maximum HR, HRR at 1 min post-exercise, metabolic equivalent (MET), previous myocardial infarction, sex, smoking, and ST-segment depression during baseline and maximum depression during the exercise test. The predefined risk variables were the entered into the final model and a P-value for the addition of each risk marker to the model was calculated. The proportional hazard assumption was verified for each risk marker by plotting Schoenfeld residuals against survival time transformed into natural logarithm. The statistical significance of the differences between the proportional probabilities in the Kaplan–Meier event-probability curves were compared with the log-rank test. All tests were two-sided and a value of P < 0.05 was considered statistically significant.
Results
The study population consisted of 1297 patients with exercise ECG recordings (872 men and 425 women). During an average follow-up of 44.7 ± 12 (mean ± SD) months, 74 patients had died (5.7% of the entire population). Of those, 35 (2.6%) were classified as cardiac deaths. Sudden cardiac death was the major endpoint in 24 cases (1.9%). The majority of the patients who died during the follow-up were men and generally older, had lower exercise capacity, and were more often medicated with beta-blockers as opposed to those who survived. Patient characteristics are listed in Table 1.
Characteristics of the study population
| Clinical features | Alive (n = 1223) | Dead (n = 74) | P-value |
|---|---|---|---|
| Age (years) | 55.9 ± 13.2 | 62.9 ± 10.8 | <0.001 |
| BMI (kg/m2) | 27.4 ± 4.5 | 26.8 ± 3.8 | 0.213 |
| LVEFa | 66.4 ± 13.6 | 62.6 ± 14.2 | 0.048 |
| HR at rest (bpm) | 71.9 ± 14.8 | 71.2 ± 16.7 | 0.700 |
| Maximum HR (bpm) | 139.9 ± 27.0 | 119.4 ± 27.1 | <0.001 |
| MET | 7.3 ± 3.0 | 5.5 ± 2.3 | <0.001 |
| Sex (Male) (%) | 817 (67) | 55 (74) | <0.001 |
| Previous infarction (%) | 273 (22) | 22 (30) | 0.145 |
| CHD (%) | 411 (34) | 29 (39) | 0.330 |
| Smoking (%) | 347 (28) | 28 (38) | 0.085 |
| Diabetes (%) | 150 (12) | 13 (18) | 0.241 |
| Beta-blockers (%) | 763 (62) | 62 (83) | <0.001 |
Data are presented as mean ± SD for continuous variables and n (%) for categorical variables. BMI, body mass index; bpm, beats per minute; CAD, Coronary artery disease; HR, heart rate; LVEF, left ventricular ejection fraction; MET, metabolic equivalent.
an(alive) = 920; n(dead) = 56.
Rate-adaptation of total cosine R-to-T and QRS/T angle
A significant rate-dependence of TCRT and QRS/T angle was observed in the total study population but with a relatively large inter-subject variability: i.e. median TCRT-RR during exercise was 0.89 with an inter-quartile range from 0.55 to 0.98, and during recovery 0.83 from 0.43 to 0.95; median QRST-RR during exercise was 0.72 (0.08–0.94), and during recovery 0.61 (0.01–0.88).
Risk markers and mortality
Table 2 shows the results of the univariate comparisons (Mann–Whitney U test) between patients who remained alive and those suffered all-cause, cardiac or sudden cardiac death during the follow-up period. Reduced and negative TCRT-RR and QRST-RR values during exercise and recovery, as well as TCRT and QRS/T angle at baseline resting ECG, were associated with poor clinical outcome with significantly larger values in the event-free group. Figure 1 illustrates the TCRT rate-relation observed in three different test-subjects: a subject who was alive after the follow-up, and two patients who both died suddenly during the follow up of this study.
Univariate analysis of the predefined risk variables
| Alive (n = 1223) | All-cause mortality (n = 74) | Cardiac death (n = 35) | Sudden cardiac death (n = 24) | |||||
|---|---|---|---|---|---|---|---|---|
| Median | Inter-quartiles | Median | Inter-quartiles | Median | Inter-quartiles | Median | Inter-quartiles | |
| TCRT-RREX | 0.89 | (0.60 0.98) | 0.68* | (−0.20 0.98) | 0.60** | (−0.40 0.93) | 0.63* | (−0.35 0.96) |
| TCRT-RRREC | 0.83 | (0.46 0.95) | 0.53** | (−0.40 0.95) | 0.20** | (−0.60 0.93) | 0.00** | (−0.60 0.95) |
| QRST-RREX | 0.74 | (0.11 0.94) | 0.46** | (−0.50 0.89) | −0.20** | (−0.57 0.89) | −0.34** | (−0.59 0.89) |
| QRST-RRREC | 0.62 | (0.04 0.88) | 0.34* | (−0.30 0.84) | 0.17* | (−0.50 0.83) | −0.06* | (−0.54 0.82) |
| Baseline TCRT | −0.04 | (−0.40 0.30) | −0.27** | (−0.62 0.14) | −0.35** | (−0.76-0.09) | −0.33* | (−0.75–0.04) |
| TCRT at max HR | −0.28 | (−0.62–0.03) | −0.29 | (−0.74–0.02) | −0.53* | (−0.86–0.13) | −0.42 | (−0.85–0.13) |
| Baseline QRS/T | 0.13 | (−0.75 0.69) | −0.31* | (−0.82 0.52) | −0.51** | (−0.92 0.10) | −0.44 | (−0.76 0.62) |
| QRS/T at max HR | −0.47 | (−0.95 0.51) | −0.65 | (−0.92 0.31) | −0.71 | (−0.92 0.15) | −0.59 | (−0.91 0.26) |
| slope TCRTEX (10−3/ms) | 0.42 | (0.04 0.99) | 0.08** | (−0.16 0.61) | 0.05** | (−0.23 0.41) | 0.07* | (−0.20 0.41) |
| slope TCRTREC (10−3/ms) | 0.55 | (0.05 1.25) | 0.09* | (−0.21 1.31) | 0.04** | (−0.23 0.70) | −0.08** | (−0.29 0.70) |
| slope QRSTEX (10−3/ms) | 0.20 | (−0.06 0.92) | 0.01* | (−0.30 0.72) | −0.05** | (−0.31 0.29) | −0.08* | (−0.30 0.59) |
| slope QRSTREC (10−3/ms) | 0.23 | (−0.08 1.07) | 0.05* | (−0.66 0.89) | 0.02* | (−0.92 0.36) | 0.01** | (−1.01 0.30) |
| HR max (bpm) | 141 | (119 160) | 121** | (100 139) | 114** | (93 131) | 118** | (96 134) |
| HRR (bpm/min) | 24 | (18 31) | 17** | (11 26) | 17** | (11 24) | 19** | (11 27) |
Values are presented as medians with corresponding inter-quartiles.
*P < 0.05.
**P < 0.01 compared with values of patients who survived; EX, exercise; REC, recovery; QRST-RR, correlation coefficient between QRS/T angle and RR interval; TCRT-RR, correlation coefficient between TCRT values and RR intervals; HR, heart rate; HRR, heart rate recovery at 1 min post-exercise.
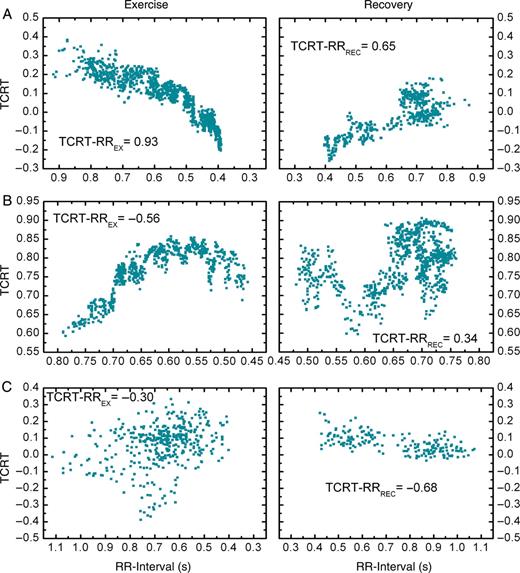
The beat-to-beat total cosine R-to-T-RR patterns of three different patients during exercise (left column) and recovery (right column). (A) illustrates a typical total cosine R-to-T-RR pattern in a patient who remained alive during the follow-up. (B) and (C) illustrate the total cosine R-to-T-RR patterns of two coronary artery disease patients who both suffered sudden cardiac death during the follow-up of the study. The total cosine R-to-T-RR relation in (B) is inverted from that of a normal healthy subject during exercise, and therefore the total cosine R-to-T-RR index is negative. In (C), the total cosine R-to-T-RR relation is negative during both exercise and recovery.
Table 3 shows the unadjusted and adjusted hazard ratios and their corresponding 95% confidence intervals (CIs) for the optimally dichotomized variables in the prediction of cardiac and sudden cardiac death. Reduced recovery TCRT-RR (unadjusted hazard ratio of 5.50; 95% CI: 2.83–10.69, P< 0.001) and exercise TCRT-RR (unadjusted hazard ratio of 4.25; 95% CI: 2.17–8.29, P< 0.001) values were strong predictors of cardiac death. A new categorical variable was constructed as a combination of these two variables (named COMBINED): patients were divided into three groups based on their exercise and recovery TCRT-RR values. Group COMBINED 0 consisted of patients with good rate-dependency indexes (good meaning TCRT-RREX and TCRT-RRREC values above the optimum cut-off points); COMBINED 1 consisted of patients with poor rate-dependence during exercise or recovery; and COMBINED 2 consisted of patients with poor rate-dependence during both exercise and recovery. The unadjusted risk of cardiac death in COMBINED 2 was 9.5 times higher (95% CI: 4.1–22.2; P< 0.001, Figure 2) than in COMBINED 0. For sudden cardiac death, the risk was 11.4 times higher in COMBINED 2 (95% CI: 4.1–32.0; P< 0.001, Figure 2) as opposed to COMBINED 0.
Electrocardiographic variables as predictors of cardiac and sudden cardiac death
| Unadjusted Cox regression | Adjusted Cox regression | |||||||
|---|---|---|---|---|---|---|---|---|
| Cut-off point | Patients at risk (n) | Hazard ratio | 95% CI | P-value | Hazard ratio | 95% CI | P-value | |
| Cardiac death | ||||||||
| TCRT-RREX | <0.00 | 171 | 4.25 | 2.17–8.29 | <0.001 | 2.24* | 1.12–4.49 | 0.022 |
| TCRT-RRREC | <0.55 | 153 | 5.50 | 2.83–10.69 | <0.001 | 3.48*** | 1.78–6.80 | 0.001 |
| QRST-RREX | ≤0.10 | 248 | 4.50 | 2.32–8.76 | <0.001 | 3.33*** | 1.70–6.54 | <0.001 |
| QRST-RRREC | <0.20 | 367 | 3.03 | 1.55–5.92 | 0.001 | 2.33* | 1.19–4.56 | 0.014 |
| COMBINED 1 | — | 196 | 4.54 | 2.10–9.80 | <0.001 | 2.55** | 1.16–5.70 | 0.020 |
| COMBINED 2 | — | 64 | 9.50 | 4.06–22.2 | <0.001 | 4.94*** | 2.07–11.77 | <0.001 |
| Baseline TCRT | <0.00 | 624 | 4.51 | 1.87–10.85 | 0.001 | 3.35** | 1.38–8.14 | 0.010 |
| Baseline QRS/T | ≤0.30 | 467 | 3.49 | 1.71–7.13 | 0.001 | 2.49** | 1.21–5.13 | 0.013 |
| Sudden cardiac death | ||||||||
| TCRT-RREX | <0.00 | 171 | 3.47 | 1.52–7.93 | 0.003 | 1.92 | 0.82–4.50 | 0.131 |
| TCRT-RRREC | ≤0.20 | 130 | 7.85 | 3.53–17.49 | <0.001 | 4.52*** | 1.99–10.28 | <0.001 |
| QRST-RREX | ≤0.30 | 205 | 6.61 | 2.94–14.88 | <0.001 | 4.49*** | 1.97–10.27 | <0.001 |
| QRST-RRREC | <0.00 | 279 | 3.85 | 1.73–8.60 | 0.001 | 2.86* | 1.27–6.44 | 0.011 |
| COMBINED 1 | — | 197 | 4.66 | 1.85–11.76 | 0.001 | 2.47** | 0.95–6.41 | 0.064 |
| COMBINED 2 | — | 52 | 11.40 | 4.06–32.03 | <0.001 | 6.16*** | 2.13–17.77 | <0.001 |
| Baseline TCRT | ≤0.30 | 665 | 4.07 | 1.39–11.91 | 0.010 | 3.12* | 1.06–9.20 | 0.039 |
| Baseline QRS/T | <0.00 | 466 | 2.24 | 0.99–5.04 | 0.052 | 1.70 | 0.75–3.89 | 0.205 |
CI, confidence interval; COMBINED 1, exercise TCRT-RR or recovery TCRT-RR below optimum cut-off point; COMBINED 2, both exercise TCRT-RR and recovery TCRT-RR below optimum cut-off point; EX, exercise period; QRST-RR, correlation coefficient between measured QRS/T angles and corresponding RR intervals; REC, recovery period; TCRT-RR, correlation coefficient between measured TCRT values and corresponding RR intervals. Asterisks (*) represent the P-value for the addition of each risk marker into the clinical model (*<0.05; **<0.01; ***<0.0001); the final clinical model to which the predefined risk variables were entered consisted of the following clinical covariates for cardiac death: metabolic equivalent (MET), sex, usage of beta-blockers, heart rate recovery at 1 min post-exercise (HRR) and baseline ST segment depression; for sudden cardiac death the model consisted of sex, HRR, maximum heart rate and baseline ST segment depression.
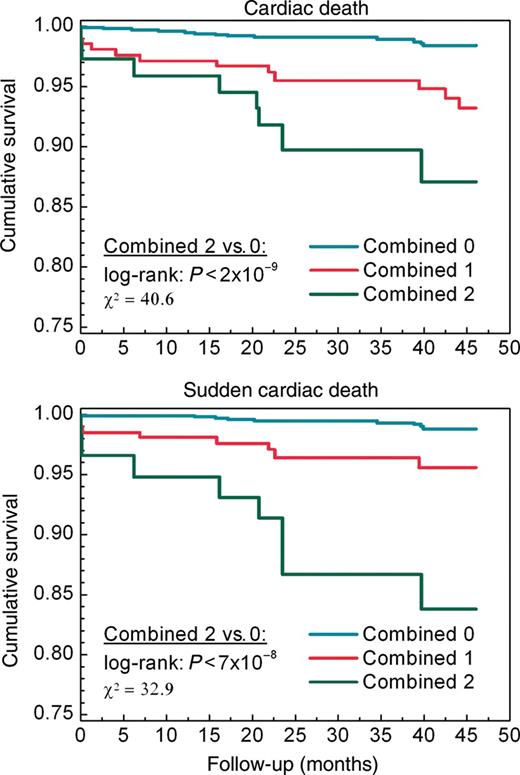
Kaplan–Meier curves for cardiac and sudden cardiac death in patients divided into three groups: Group COMBINED 0 consisted of patients with exercise and recovery total cosine R-to-T-RR above their optimum cut-off points; COMBINED 1 consisted of patients with exercise or recovery total cosine R-to-T-RR below the optimum cut-off point; COMBINED 2 consisted of patients with poor exercise and recovery rate-dependence of total cosine R-to-T.
After adjustment with the clinical risk variables in the Cox regression analysis, the lack of correlation during both exercise and recovery phases (COMBINED 2) was the strongest predictor of both cardiac (adjusted hazard ratio: 4.9; 95% CI: 2.1–11.8, P< 0.001) and sudden cardiac death (adjusted hazard ratio: 6.2; 95% CI: 2.1–17.8, P< 0.001). Male gender (P= 0.033), MET (P= 0.021), HRR (P= 0.006), usage of beta-blockers (P= 0.054), and baseline ST segment depression (P= 0.002) remained in the final clinical model. For sudden cardiac death, the model consisted of male gender (P= 0.041), maximum HR (P= 0.017), HRR (P= 0.037), and baseline ST segment depression (P= 0.014). The P-value for the addition of each new risk variable into the clinical model is presented in Table 3.
Associations between new descriptors and clinical risk markers
The TCRT-RR did not show any significant associations with sex, smoking, previous myocardial infarction or CAD. However, patients on beta-blocking medication had significantly lower TCRT-RR (P< 0.001) and QRST-RR (P< 0.01) values during recovery. Reduced recovery TCRT-RR values were also associated with diabetes (P< 0.05). Both TCRT-RR and QRS/T-RR had only weak to moderate correlations with other variables obtained from exercise ECG, e.g. ST-segment depression or maximal exercise capacity.
Discussion
The results show that the dynamics of the spatial relationship between QRS and T-wave loops, i.e. TCRT-RR and QRST-RR, measured during exercise and recovery do yield valuable prognostic information on cardiac mortality and sudden cardiac death, independently of clinical risk markers. In particular, the loss or reversal of rate-adaptation of TCRT during the recovery phase of the exercise test was associated with poor outcome. Those individuals who experienced cardiac death during the follow-up had delayed or inversed recovery of TCRT and QRS/T angle after the cessation of exercise, resulting in the loss or reversal of correlation between RR-intervals and these morphological descriptors. These variables measured from exercise ECG were stronger predictors than many previously described ECG risk markers, such as TCRT and QRS/T angle measures from baseline 12-lead ECG, or 1 min HRR measured from exercise ECG.
Physiology and pathophysiology of the new risk markers
Abnormal repolarization plays a significant role in the genesis of ventricular arrhythmias.9 Traditionally, cardiac repolarization abnormalities are assessed by measuring the duration of the QT interval and QT dispersion. However, methodological problems in the measurement of QT interval hinder the reliable assessment of repolarization abnormalities. Consequently, new descriptors, such as those describing the QRS and T-wave morphology,1,2 have been developed to overcome these methodological obstacles for more reliable risk assessment.
The TCRT has been one of the most promising electrocardiographic descriptors of depolarization and repolarization inhomogeneities. It reflects the spatial angle between the depolarization and repolarization wavefronts like QRS/T angle. However, as opposed to QRS/T angle, TCRT takes into account several vectors from the dominant parts of the QRS loop. It measures the vector deviation between depolarization and repolarization waves by calculating the average of the cosines of the angles between the dominant QRS loop vectors and the main T-wave loop vector.1 Therefore, it takes into account not only the spatial deviation between the depolarization and repolarization wavefronts, but also the QRS-loop morphology. Normally, the overall vectors of depolarization and repolarization are orientated in the same direction, and in that way, TCRT receives values which are close to 1. When the vectors are pointing in opposite directions, TCRT receives values close to −1. Negative TCRT values are commonly found in patients with cardiac disease and associated with a poor clinical outcome.3–5,10 Total cosine R-to-T also decreases with increasing HR.11 In our previous study,7 we observed that the TCRT and QRS/T values decrease towards negative values1,12 in healthy subjects during incremental exercise.
The behaviour of TCRT and QRS/T angle values during an exercise test might be partly attributable to the changes in the autonomic nervous system that may affect cardiac repolarization.13 Changes in autonomic regulation during exercise and recovery have been widely studied.14–19 It is generally agreed that the initial increase in HR during exercise is characterized by vagal withdrawal; whereas increasing sympathetic activity is responsible for further increase in HR at higher exercise intensity levels. During recovery, the effects are reversed with a rapid restoration of vagal tone after the cessation of exercise accompanied by a more gradual decrease in sympathetic activity. One plausible explanation for the observations of this study is that altered autonomic response to exercise and, particularly, during the recovery phase, is the main reason for the loss of rate-adaptation of depolarization/repolarization patterns, which, thereby, indicates an increased risk for mortality, especially due to fatal cardiac arrhythmia. This concept is supported by the observation of previous studies showing that blunted HRR after termination of exercise also indicates an increased risk of mortality.20,21 In the present study, the assessment of depolarization/repolarization patterns during the recovery phase appeared to be an even more powerful prognostic marker of cardiac mortality and sudden cardiac death than the HRR. Changes in depolarization/repolarization patterns may reflect the effects of autonomic nervous system at the ventricular level, where the fatal arrhythmias arise, while HRR after exercise reflects autonomic input at the level of sinus node, perhaps explaining the better prognostic value of TCRT than HRR after termination of exercise in prediction of sudden cardiac death.
Study limitations
A few methodological points deserve comments. First, the number of samples available for the analysis varied between subjects, depending on individual exercise capacity: participants with a lower exercise capacity had fewer sample-points than those with higher exercise capacity and, therefore, greater HR dynamics. However, more samples were acquired from the recovery period (three time-fixed recovery samples) than from exercise period at the corresponding HRs in patients with low exercise capacity. Thus, the correlation coefficients computed during recovery are more reliable due to the extra number of samples compared with those calculated during exercise among these patients.
The reliability of T-wave morphology analysis may sometimes be questionable due to the extensive noise present during the exercise test. However, the effects of noise can be effectively reduced using filtering and median beats. Our previous studies have shown that TCRT is inherently robust, since the phenomenon it describes is large and, thus, less affected by noise.22
The clinical covariates used in the multivariate Cox regression analyses lacked baseline ECG variables such as QT time and QRS-duration which might have provided prognostic information on mortality. Also, the lack of T-wave amplitude measures and visually assessed T-wave abnormalities limit the applicability of the results as low-amplitude, flat, or inverted T waves, seen in patients with chronic CAD or previous MI, carry prognostic information that might overlap with that of the studied parameters.
Finally, the present patient sample represents a relatively healthy cardiac population with well-preserved LVEF. Therefore, the number of endpoints, especially sudden cardiac deaths, was relatively low and limits the generalization of the results to other patient samples. Despite this limitation, the present results encourage studying the value of these methods in risk stratification of other patient samples. At present, there are relatively few reliable risk markers of sudden cardiac death for the population having low-to-intermediate risk of sudden cardiac death.23
Implications
The results of the present study indicate that the new descriptors of the dynamics of the spatial relationship between QRS and T-wave loops analysed from exercise ECG, i.e. TCRT-RR and QRST-RR, are associated with mortality, especially with cardiac mortality and sudden cardiac death. Future research should assess the predictive power of these indexes in other populations and focus on the mechanisms behind the altered behaviour of cardiac depolarization/repolarization patterns during exercise.
Conflict of interest: none of declared.
Funding
This study was supported in part by the Finnish Cultural Foundation, Helsinki, Finland; European project: Dynamic Analysis of Physiological Networks; the Tauno Tönning Foundation, Oulu, Finland; Sigrid Juselius Foundation, Helsinki, Finland; the Tampere University Hospital Medical Fund, Tampere, Finland; Tampere Tuberculosis Foundation, Tampere, Finland and the Finnish Funding Agency for Technology and Innovation, Helsinki, Finland.
