


Abstract
Anderson-Fabry disease (AFD) is an X-linked lysosomal storage disorder associated with bradyarrhythmias. We sought to examine the nature of conduction system abnormalities and the indications and determinants of anti-bradycardia pacing in patients with AFD.
We studied 204 patients with AFD (49% male, mean age 42 years) in an observational, longitudinal, retrospective cohort study. At baseline, 5 (2.5%) patients had pacemakers for the treatment of bradycardias [4/5 (80%) for atrioventricular disease; 1/5 (20%) for sinus node disease]. PR interval <120 ms was observed in 15 (7%); PR interval >200 ms in 6 (3%); QRS interval >120 ms 18 (9%); left QRS axis deviation in 16 (8%); and right-axis deviation in 2 (1%). Age was an independent determinant of prolonged PR interval, QRS duration and left QRS axis deviation. During follow-up (189 patients; 899 patient-years), 12 (6%) had a device implanted to treat spontaneously occurring bradyarrhythmias [5/12 (42%) for atrioventricular disease; 7/12 (58%) sinus node disease] with 8% 5-year cumulative incidence. Two independent predictors of future anti-bradycardia pacing were identified in a multivariable Cox model: QRS duration [hazard ratio (HR) 1.05, 95% confidence intervals (CI) 1.02–1.09, P= 0.001; receiver operating characteristic (ROC) curve c-statistic 0.726] and PR interval duration (HR 1.03, 95% CI 1.004–1.060, P= 0.023; ROC curve c-statistic 0.548). QRS duration ≥110 ms at baseline had a sensitivity of 64%, specificity of 84%, 49% positive predictive value, and 91% negative predictive value for identifying patients likely to require anti-bradycardia pacing.
In patients with AFD increasing age is associated with PR and QRS interval prolongation and left QRS axis deviation. Pacing for atrioventricular and sinus node disease is common and patients with QRS≥110 ms should be closely monitored for bradyarrhythmias.
Introduction
Anderson-Fabry disease (AFD) is an X-linked lysosomal storage disorder caused by α-galactosidase A enzyme deficiency (OMIM 301500). The intracellular accumulation of its glycosphingolipid substrate, globotriaosylceramide, leads to cellular dysfunction and eventually to life-threatening cardiac, renal, and cerebrovascular complications.1 Even though left ventricular (LV) hypertrophy is the most prominent cardiac manifestation, ventricular arrhythmias, bradyarrhythmias, and progressive atrioventricular node (AV) conduction disease are reported and may cause sudden cardiac death (SCD).2–11 However, the incidence and predictors of clinically important bradyarrhythmias are poorly characterized. We sought to examine the nature of conduction system abnormalities and the indications and determinants of anti-bradycardia device implantation in a large cohort of AFD patients.
Methods
Study design
An observational, longitudinal, retrospective cohort design was used. The study conforms to the principles of the Helsinki declaration. All patients provided written informed consent for implantation of cardiac devices. All authors have read and agreed to the manuscript as written. The authors had full access to the data and take responsibility for its integrity.
Study population
The cohort consisted of all patients with AFD who were consecutively evaluated at a dedicated cardiomyopathy clinic from 1st January 1988 until 1st March 2010. Patients were also followed at the Lysosomal Storage Disorders Unit at the Royal Free Hospital (London, UK) and the Charles Dent Metabolic Unit at The National Hospital for Neurology and Neurosurgery at Queen Square (London, UK) for non-cardiological care. The diagnosis of AFD was determined by measuring plasma and/or leucocyte α-galactosidase A enzyme activity and identifying mutations in the GLA gene. Patients <16 years of age at the time of their first evaluation were excluded.
Assessment at baseline
The Mainz Severity Score Index (MSSI) was used to assess the overall severity of AFD.12 All patients were evaluated using resting 12-lead electrocardiography (ECG) and echocardiography. Recorded ECG variables included: rhythm, PR interval duration, QRS axis and QRS complex duration. Recorded echocardiographic variables included: left atrial diameter, LV end-systolic dimension (LVesd), LV end-diastolic dimension (LVedd), posterior wall thickness in diastole (PWTd), and septal wall thickness in diastole (SWTd).13 Left ventricular outflow tract gradients were measured at rest and after provocation with the Valsalva manoeuvre; LV outflow tract obstruction (LVOTO) was defined as a gradient ≥30 mmHg. Maximum LV wall thickness (MWT) was defined as the greatest thickness in any single LV segment measured in the parasternal short-axis plane at the level of the mitral valve, papillary muscles, and apex. Left ventricular ejection fraction was calculated using LV volumes derived by Teichholz's method.14 The relative wall thickness (RWT) was calculated as (SWTd + PWTd)/LVedd and expressed as a percentage. Left ventricular mass (LVM) was calculated as 0.8 × {1.04 × [(LVedd + PWTd + SWTd)3 − (LVedd)3]} + 0.6 g and indexed to body surface area to obtain the left ventricular mass index (LVMI). Left ventricular hypertrophy was defined as LVMI >95 g/m2 for females and >115 g/m2 for males. Patients with normal LVMI were classified as having concentric remodelling in the presence of RWT >42% or normal LV geometry if the RWT ≤42%. Patients with increased LVMI were classified as having concentric hypertrophy if the RWT >42% or eccentric hypertrophy if the RWT ≤42%.13
Follow-up and endpoints
A clinical review was performed every 6–12 months or earlier if there was a clinical event until 1st November 2010. The indication for pacemaker implantation was determined by reviewing clinical notes blinded to the predictor variable profile of each patient. The endpoint was implantation of a cardiac device to treat spontaneously occurring bradycardias. Inappropriate sinus bradycardia, tachycardia-bradycardia syndrome, sinoatrial arrest, and sinoatrial exit block were classified as sinus node disease. First-, second-, and third-degree AV block and atrial fibrillation with slow AV conduction were classified as AV disease.
Statistical analysis
SPSS (v17.0) was used for all statistical analyses. Normally distributed continuous data are expressed as mean ± standard deviation (SD) and as median and interquartile range (IQR) for non-normally distributed data. The percentage of categorical data is shown in parentheses. Differences between means were compared using the Student's t-test and the Mann–Whitney U test for normally distributed and non-normally distributed continuous data respectively. The χ2 test and Fisher's exact test was used for comparison of categorical data. Least squares linear regression was used to assess relationships for continuous dependent variables. Time-to-event (survival) analysis was used to examine implantation of any cardiac device to treat spontaneously occurring bradycardias (endpoint). The follow-up period was calculated from the date of first evaluation at our unit to the time of reaching the endpoint. In patients not reaching the endpoint, the follow-up period extended to the most recent clinical evaluation available or censoring event. Implantation of cardiac devices exclusively for other indications (e.g. ICDs for the prevention of SCD, iatrogenic bradycardia, and treatment of outflow tract obstruction) was a censoring event. The annual event rate was calculated by dividing the number of patients reaching the outcome by the total follow-up period. The cumulative probability for requiring a device for the treatment of rhythm abnormalities was estimated using the Kaplan–Meier method. The relation of the outcome to pre-specified baseline clinical characteristics was assessed using the Cox proportional hazards model. Interactions between the final predictors were sought and the linearity assumption for continuous variables was tested using models with quadratic polynomial terms.15 The predictor variables were pre-specified on the basis of previously published studies. For linear regression and Cox proportional hazard models, the univariable analysis was followed by a multivariable model fitted using backward elimination with a significance level of 10%. The performance of predictors was examined using receiver operating characteristic (ROC) curves and calculating the area under the curve (c-statistic). The positive predictive value (PPV) of a predictor was calculated by dividing sensitivity × prevalence by sensitivity × prevalence + (1−specificity) × (1−prevalence) and expressed as a percentage. The negative predictive value (NPV) of a predictor was calculated by dividing specificity × (1−prevalence) by (1−sensitivity) × prevalence + specificity × (1−prevalence) and expressed as a percentage.16 Linear regression coefficients, R2, hazard ratios, 95% confidence intervals (CI) and P values are presented. A two-sided P value <0.05 was considered significant.
Results
Patient population and baseline clinical characteristics
Two hundred and four AFD patients were evaluated during the study period. The baseline clinical characteristics, stratified by sex are summarized in Table 1. Male patients had higher MSSI scores (P< 0.0001) and worse New York Heart Association (NYHA) functional class (P= 0.01) than female patients. Forty-six (23%) patients were already on enzyme replacement therapy (ERT) at the time of their first visit. The median ERT duration at baseline evaluation was 2.1 years (IQR 4 months to 2.9 years; range: 4 days to 9.7 years). Patients on ERT had an age similar to those not on ERT (mean 42.3 years and 43.7 years, respectively, P= 0.77), but a higher MSSI score (mean MSSI score 27 and 19 respectively, P< 0.0001), a higher prevalence of LV hypertrophy (67 and 49% respectively, P= 0.039) and a higher proportion was male (83 and 39% respectively, P< 0.0001). An additional 97 (48%) patients were started on ERT subsequent to their first evaluation at the Heart Hospital.
Baseline clinical characteristics
| All patients | Male | Female | |
|---|---|---|---|
| Number; n (%) | 204 | 99 (48.5%) | 105 (51.5%) |
| Clinical characteristics | |||
| Age at first evaluation (years) | 42 ± 15 | 44 ± 15 | 43 ± 15 |
| NYHA ≥ II | 53 (26%) | 34 (34%) | 19 (18%) |
| Chest pain | 54 (26%) | 31 (31%) | 23 (22%) |
| MSSI score | 21 ± 12 | 26 ± 12 | 17 ± 10 |
| Electrocardiogram | |||
| Sinus rhythm | 193 (95%) | 89 (90%) | 104 (99%) |
| Atrial fibrillation | 6 (3%) | 5 (5%) | 1 (1%) |
| Paced | 5 (2.5%)a | 5 (5%) | 0 |
| PR interval (ms) | 148 ± 24 | 149 ± 26 | 149 ± 22 |
| QRS duration (ms) | 98 ± 20 | 108 ± 22 | 89 ± 13 |
| QRS axis (°) | 35 ± 40 | 30 ± 45 | 40 ± 34 |
| Echocardiogram | |||
| Left atrial diameter (mm) | 38 ± 7 | 36 ± 6 | 40 ± 7 |
| LVedd (mm) | 47 ± 6 | 49 ± 6 | 46 ± 5 |
| LVedd indexed to BSA (mm/m2) | 26 ± 3 | 26 ± 4 | 27 ± 3 |
| LV ejection fraction (%) | 62 ± 9 | 61 ± 9 | 62 ± 8 |
| MWT (mm) | 12 (9–15) | 14 (12–18) | 10 (8–12) |
| LVOTO | 8 (4%) | 7 (7%) | 1 (1%) |
| LV mass (g) | 194 (142–256) | 248 (198–319) | 151 (113–187) |
| LVMI (g/m2) | 107 (82–140) | 130 (102–165) | 87 (68–112) |
| RWT (%) | 45 (36–57) | 53 (42–65) | 41 (34–49) |
| Normal LV mass and geometry | 73 (36%) | 22 (22%) | 51 (49%) |
| Concentric remodelling | 23 (11%) | 12 (12%) | 11 (10%) |
| Eccentric hypertrophy | 16 (8%) | 9 (9%) | 7 (7%) |
| Concentric hypertrophy | 92 (45%) | 56 (57%) | 36 (34%) |
Normally distributed continuous data are expressed as mean ± standard deviation (SD) and as median and interquartile range (IQR) for non-normally distributed data. The percentage of categorical data is shown in parentheses.
aNone of these patients was in atrial fibrillation.
Baseline electrocardiogram rhythm and devices
The ECG characteristics of the cohort are shown in Table 1. At baseline, 5 (2.5%) patients had pacemakers for the treatment of bradycardia: 4/5 (80%) for AV disease and 1/5 (20%) for sinus node disease. Anderson-Fabry disease patients with pacemakers for bradycardia indications were older (mean age 66.2 vs. 42.9 years, P= 0.002), had more hypertrophy (mean LVMI 169 vs. 113 g/m2, P= 0.008), more exercise limitation (80 vs. 25% in NYHA ≥ 2, P= 0.02), higher MSSI scores (34 vs. 21, P= 0.03) and were more likely to be male (100 vs. 47%, P= 0.007) than the rest of the cohort. All pacemakers were implanted prior to the diagnosis of AFD. In addition, a 72-year-old man had a cardiac resynchronization (CRT)-internal cardioverter–defibrillator (ICD) for the secondary prevention of SCD following symptomatic ventricular tachycardia in the presence of depressed LV function secondary to AFD.
Baseline PR interval
In the absence of atrial fibrillation or pacing, a short PR interval (<120 ms) was observed in 15 (7%) patients, while 6 (3%) patients had a long PR interval (>200 ms). The only independent predictor of PR duration was age at baseline evaluation, which was directly proportional to the PR interval (Figure 1A). The univariable and multivariable linear regression analyses are shown in Table 2.
The relation of PR interval, QRS duration, and QRS axis with baseline clinical characteristics (linear regression)
| Dependent variable | Independent variables | Univariable analysis | Multivariable models | ||||||
|---|---|---|---|---|---|---|---|---|---|
| Coefficient | 95%CI | P | R2 | Coefficient | 95% CI | P | R2 | ||
| PR interval (ms) | Age, years | 0.380 | 0.151 to 0.608 | 0.001 | 0.055 | 0.373 | 0.144 to 0.602 | 0.02 | 0.055 |
| Female sex | 0.796 | −6.094 to 7.687 | 0.820 | <0.001 | |||||
| MSSI score | 0.069 | −0.246 to 0.384 | 0.666 | 0.001 | |||||
| Left atrial diameter, (mm) | 0.057 | −0.499 to 0.613 | 0.839 | <0.001 | |||||
| QRS duration (ms) | Age, years | 0.425 | 0.266 to 0.585 | <0.0001 | 0.128 | 0.282 | 0.120 to 0.444 | 0.001 | 0.366 |
| Female sex | −17.399 | −21.856 to −12.943 | <0.0001 | 0.241 | −13.02 | −18.00 to −8.048 | <0.0001 | ||
| MSSI score | 0.674 | 0.470 to 0.877 | <0.0001 | 0.192 | |||||
| LVMI (g/m2) | 0.195 | 0.148 to 0.243 | <0.0001 | 0.265 | 0.082 | 0.022 to 0.142 | 0.008 | ||
| LVEF (%) | −0.169 | −0.470 to 0.132 | 0.269 | 0.07 | |||||
| QRS axis (°) | Age, years | −1.148 | −1.501 to −0.795 | <0.0001 | 0.183 | −1.148 | −1.51 to −0.786 | <0.0001 | 0.178 |
| Female sex | 10.637 | −0.919 to 22.193 | 0.071 | 0.018 | |||||
| MSSI score | −0.590 | −1.100 to −0.080 | 0.024 | 0.029 | |||||
| LVMI (g/m2) | −0.227 | −0.347 to −0.106 | <0.0001 | 0.264 | |||||
| LVEF (%) | 0.256 | −0.431 to 0.944 | 0.463 | 0.003 | |||||
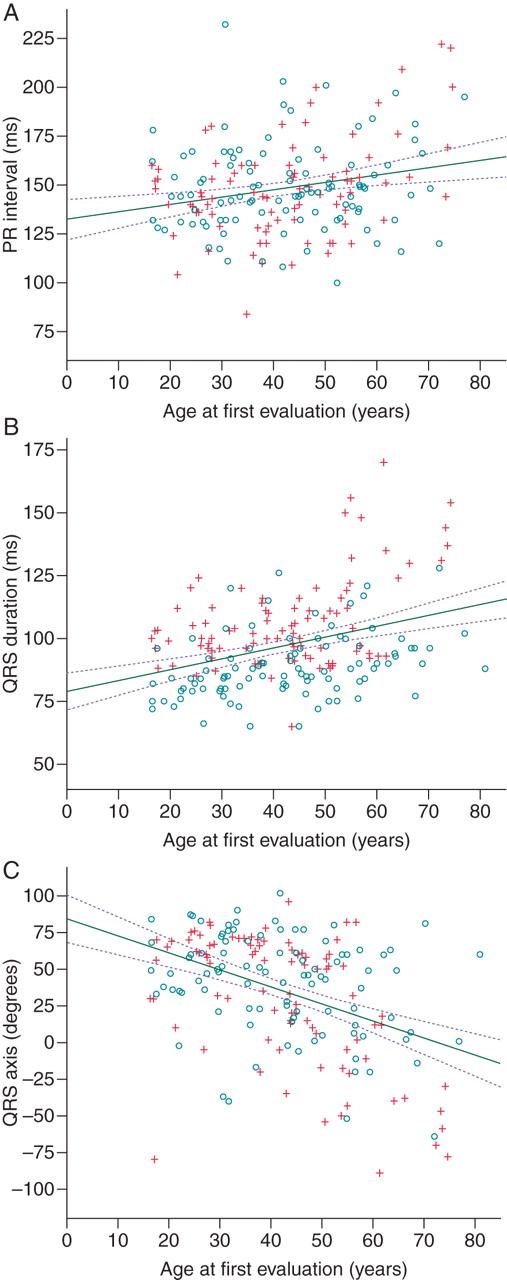
The relation of PR interval, QRS duration, and QRS axis with age. Circles represent female patients and crosses male patients. Solid lines represent univariable linear regression lines and the interrupted lines 95% confidence interval.
Baseline QRS duration
Prolonged QRS duration (>120 ms) was seen in 18 (9%) of patients. The QRS duration was directly proportional to age at first evaluation (Figure 1B) and LVMI, and was shorter in female patients (Table 2). Female sex did not have a significant interaction with age and LMVI (F-test P= 0.464 and P= 0.907 respectively).
Baseline QRS axis
Left QRS axis deviation (−30° to −150°) was observed in 16 (8%) patients and right QRS axis deviation (>+90°) was seen in 2 (1%) patients. The only independent predictor of QRS axis was age at baseline evaluation with an inversely proportional relation (Figure 1C, Table 2).
Pacemaker implantation during follow-up
One hundred and eighty-nine patients without a cardiac device were followed-up for 899 patient years (median 4.8 years, IQR 2.9–6.7 years, range 25 days to 18 years). The events observed during the follow-up period are illustrated in Figure 2. During follow-up, 12 (6%) patients [mean age 54 ± 11 years, 9/12 (75%) male] received devices to treat spontaneously occurring bradyarrhythmias: 5/12 (42%) for AV disease and 7/12 (58%) for sinus node disease. The rate of device implantation for the treatment of a spontaneously occurring bradyarrhythmia was 1.3% per year (95%CI 0.6–2.1), with 8% 5-year cumulative incidence (95%CI 4.1–11.9). Nine of the 12 (75%) patients who underwent pacemaker implantation were on ERT prior to device implantation. The remaining 3 (25%) patients were started on ERT after the pacemaker implantation.
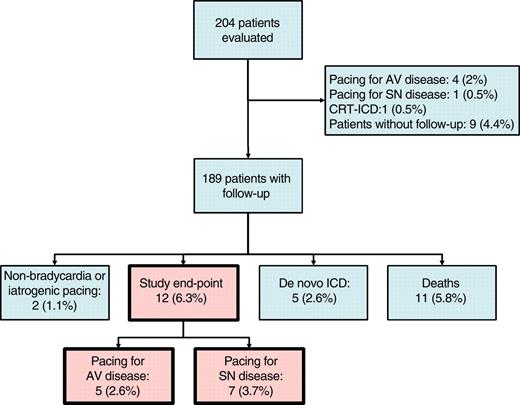
Study outcomes. AV, atrioventricular; SN, sinus node; ICD, internal cardioverter–defibrillator; CRT, cardiac resynchronization therapy.
The analysis of the pre-specified predictors with Cox regression is shown in Table 3. Two independent predictors of pacemaker implantation were identified in a multivariable model: QRS duration and PR interval duration. There was no interaction between PR and QRS duration (likelihood ratio test P= 0.81) and the linearity assumption was not violated (likelihood ratio test P= 0.07 and P= 0.76, respectively).
The relation of clinical characteristics and device implantation during follow-up (Cox regression analysis)
| Predictor variables | Unvariable analysis | Multivariable model | ||||
|---|---|---|---|---|---|---|
| HR | 95%CI | P | HR | 95%CI | P | |
| Age (years) | 1.06 | 1.02–1.10 | 0.005 | |||
| Female sex | 0.27 | 0.07–0.99 | 0.047 | |||
| MSSI score | 1.07 | 1.03–1.12 | 0.002 | |||
| LVMI (g/m2) | 1.01 | 1.003–1.023 | 0.014 | |||
| PR interval (ms) | 1.02 | 0.99–1.04 | 0.12 | 1.03 | 1.004–1.060 | 0.023 |
| QRS duration (ms) | 1.06 | 1.03–1.08 | <0.0001 | 1.05 | 1.02–1.09 | 0.001 |
| QRS axis deviation | 3.1 | 0.65–14.4 | 0.16 | |||
| ERT at baseline | 2.21 | 0.70–6.97 | 0.175 | |||
Using receiver operator characteristic curves, the QRS duration c-statistic (area under curve) was 0.726 (P= 0.01) (Figure 3A) and 0.548 (P= 0.60) for the PR interval (Figure 3B). QRS duration of ≥110 ms at baseline evaluation had a sensitivity of 64%, specificity of 84%, 49% PPV, and 91% NPV, whereas PR duration ≥200 ms had a sensitivity of 9% and specificity of 98%, 69% PPV, and 68% NPV for identifying patients likely to require anti-bradycardia pacing. The Kaplan–Meier curve for survival free from anti-bradycardia pacing, stratified according to QRS ≥ 110 ms is shown in Figure 4.
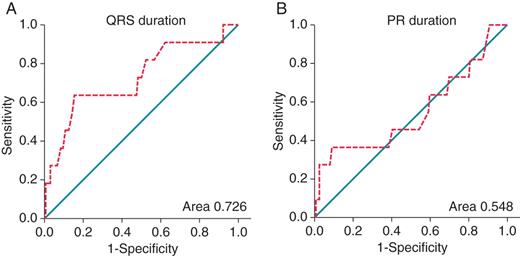
Receiver operating characteristic curves of variables predicting future anti-bradycardia pacing. For each predictor value cut-off, the sensitivity (true positive rate) is plotted against 1-specificity (false positive rate) and the points are joined to form a curve (interrupted lines). An ideal predictor would have a point passing through the top-left-hand corner of the graph, and a useless predictor would lie on the diagonal line joining the lower-left- and top-right-hand corners of the graph. An area under the curve (c statistic) of 1 indicates perfect prediction whilst an area of 0.5 indicates random predictions.16
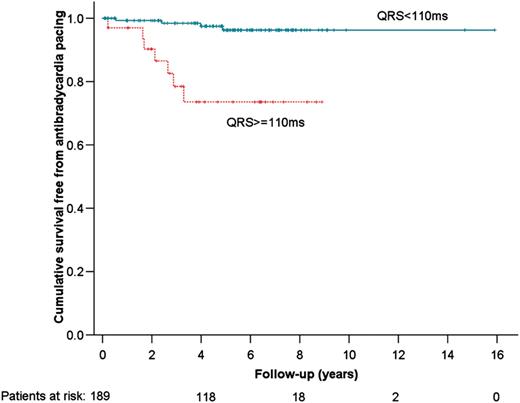
Kaplan–Meier curve for survival free from anti-bradycardia pacing.
Two other patients had a pacemaker for non-spontaneously occurring bradycardias and were censored in the survival analysis: a 74-year-old man had a dual-chamber pacemaker for LVOTO symptoms, and a 46-year-old man had a dual chamber system for iatrogenic complete heart block following alcohol septal ablation for symptomatic LVOTO.
Internal cardioverter–defibrillator implantation during follow-up
A total of nine ICDs were implanted for the primary prevention of SCD: None of the patients with ICDs for primary prevention had an appropriate shock during follow-up (total 27 patient-years; mean 2.7 years; range 1.7–4.6 years).
Five de novo implants in the absence of any bradycardia indications: a 64-year-old woman and a 59-year-old man received CRT–ICD for severe heart failure symptoms in the presence non-sustained ventricular tachycardia (NSVT), and 2 women (aged 47 and 73 years), and 1 man (65 years) had a DDD–ICD following unexplained syncope/pre-syncope and NSVT. These patients were censored in the survival analysis.
Two de novo implants with concurrent bradycardia indications: a 54-year-old man with AV disease and a 64-year-old man with sinus node disease had NSVT on Holter monitoring
Two pacemaker upgrades: a 55-year-old man with AV disease developed syncope and NSVT, 7.9 years following his original DDD implant. A 56-year-old man developed severe heart failure symptoms and LV EF 30%, 3.8 years following his DDD implant.
At the end of the study, 19 of the 189 patients (10%) who were followed-up received a cardiac device. The annual implant rate for any cardiac device was 2.1% (95%CI 1.2–3.1), with a 12% 5-year cumulative incidence (95%CI 6.1–17.9).
Deaths during follow-up
During follow-up there were 11 deaths: 3 (1.6%) male patients with LV hypertrophy died of heart failure; 2 (1%) male patients with LV hypertrophy suffered SCD; there were 6 (3%) non-cardiovascular deaths. The overall mortality rate was 1.1%/year (95%CI 0.45–1.74).
Discussion
Previous cross-sectional studies have reported pacemaker implantation in 1–8% of AFD patients,2,3,5 but to our knowledge this is the first study to examine the annual risk of anti-bradycardia pacing. The finding that pacing for atrioventricular and sinus node disease is common in patients with AFD, particularly in patients with QRS ≥ 110 ms has important implications for the monitoring and treatment of patients with AFD-related cardiac disease. With 453 new pacemaker implants per million population in 2010 in the UK,17 the rate of anti-bradycardia pacemaker implantation in AFD patients is >25 times higher than that observed in the general population.
The pathophysiology of bradyarrhythmia in AFD is complex, but histological studies have shown that fibrosis and apoptosis of cardiac conduction tissue is very frequent at post-mortem.10,11,18,19 Involvement of the autonomic nervous system may also be a contributory factor in some patients.1 In this study, AV conduction disease was the most common indication for a pacemaker at the time of first evaluation. In contrast, during follow-up, sinus node dysfunction was the most common reason for pacemaker implantation. As ERT has been shown to reduce globotriaosylceramide levels in cardiac endothelial cells20,21 and shorten the QRS duration,22–24 this difference in pacing indications could represent a modification of the natural history of the disease. The fact that ERT did not prevent anti-bradycardia pacing and that ERT does not reduce globotriaosylceramide levels in cardiomyocytes24 argue against this, but patients on ERT at baseline had more severe features of AFD than the rest of the cohort and the lack of protection might be explained by the presence of irreversible changes prior to ERT initiation.25,26 An alternative explanation is that sinus node dysfunction precedes the development of AV disease, and regular clinical monitoring resulted in earlier intervention.
The effect of increasing age on the PR and QRS intervals and QRS axis is likely to be related to progressive deposition of globotriaosylceramide in cardiac conduction tissue causing cellular dysfunction.11,18,19 The low prevalence of QRS>120 ms, QRS axis deviation, and the predominance of PR shortening over PR prolongation is explained by the young age of our population. PR interval shortening has been reported in 2–40% of AFD patients3–9 and has been attributed to accelerated AV conduction rather than accessory pathways.27 It is possible that supranormal AV conduction at the earlier stages of AFD is not caused by globotriaosylceramide deposition but is due to circulating metabolites28 affecting cardiac conduction physiology.
Sudden cardiac death in AFD is rare, with only a few reported cases in the literature.29–31 Both brady- and tachyarrhythmias are likely to play a role.7,31 Whether a brady- or a tachyarrhythmia was responsible for SCD in the two patients in our cohort is not known. In this manuscript, we described a series of nine AFD patients treated empirically with ICDs for the primary prevention of SCD. Currently, risk stratification of AFD patients is challenging and relies on the experience of the treating physician as the prognostic significance of NSVT and other markers of disease severity such as ventricular hypertrophy is not known.
Limitations
Devices implanted for non-bradycardia indications and some deaths may be linked to a patient's prognosis of requiring anti-bradycardia pacing, and censoring these patients in our study has the potential to underestimate the incidence of pacemaker implantation for spontaneously occurring bradycardia. The limited number of patients reaching the endpoint make statistical modelling prone to overfitting. The effect of starting ERT after the initial assessment was not examined. The short follow-up of the small number of patients with ICDs prevents any firm conclusions on the use of these devices for the primary prevention of SCD in AFD.
Conclusion
Pacing for atrioventricular and sinus node disease is common in patients with AFD that have a QRS ≥ 110 ms. Such patients should be closely monitored with regular clinical and ECG assessments.
Conflicts of interest: C.O. received travel grants from Shire HGT; E.M. received unrestricted educational grants from both Shire HGT and Genzyme Inc.; R.L. received honoraria from Genzyme Inc. and unrestricted educational grants from Shire HGT and Genzyme Inc.; D.H. received travel, educational, and research grants and have participated in advisory boards from Shire HGT, Amicus therapeutics and Genzyme Inc.; P.M.E. has received unrestricted educational grants from Shire HGT. All other authors have no potential conflicts of interest to declare.
Funding
This research was supported by grants from the Spanish Society of Cardiology (to M.C. and A.G.), the British Heart Foundation (to C.C.), and the European Society of Cardiology (to M.C.). This work was undertaken at UCLH/UCL who received a proportion of funding from the Department of Health's NIHR Biomedical Research Centres funding scheme.
