


Abstract
Mapping of atrial fibrillation (AF) involves identification of low-voltage regions associated with complex fractionated electrograms (CFE) which theoretically represent abnormal substrate and targets for ablation. Whether low-voltage CFE areas also identify abnormal substrate during paced rhythm is unknown.
Twelve patients with persistent AF undergoing ablation of AF had high-density three-dimensional electroanatomic maps created during AF and paced rhythm (24 maps) and the mean voltage during AF and paced rhythm was compared for eight segments of the left atrium (LA). The following were correlated during AF and paced rhythm: regional mean voltage; %low voltage (defined as <0.5 mV); and extent of CFE. In addition, the relationship between the extent of CFE in AF: (i) %low voltage and (ii) conduction during paced rhythm were determined. Mean voltage was lower during AF than paced rhythm for all regions and globally (0.7 ± 0.2 mV vs. 2.1 ± 0.6 mV, P < 0.001). The regional and overall %low voltage of the LA was greater during AF than paced rhythm (53 ± 19% vs. 9 ± 2%, P < 0.001). There was no correlation between mean voltage or %low voltage during AF and paced rhythm. Complex fractionated electrograms were prevalent throughout all regions during AF, but did not correlate with %low voltage, fractionation, or slowed conduction during paced rhythm.
Areas of CFE and low voltage recorded during AF frequently demonstrate normal atrial myocardial characteristics (normal conduction, electrograms, and voltage) during sinus rhythm. Therefore, AF CFE sites do not necessarily identify regions of an abnormal atrial substrate. However, this does not exclude the possibility that CFE might identify a focal driver or source occurring in a region of normal atrial myocardium.
Introduction
It is well recognized that pulmonary vein isolation (PVI) alone is insufficient for the treatment of most patients with persistent atrial fibrillation (AF).1–5 Substrate modification strategies targeting potential AF drivers in regions of complex fractionated atrial electrograms (CFE) have become increasingly used as part of AF ablation procedures in order to increase success rates in the persistent AF population.1–6 In the clinical setting, these CFE were originally defined as complex electrograms with two or more deflections, continuous activity, or a cycle-length <120 ms.6 Such CFE regions have also been observed to correlate with areas of low voltage during AF.7 Current strategies for mapping sites considered critical to AF mechanism involve targeting these low-voltage regions associated with high-frequency activity CFE. We aimed to identify: (i) the relationship between areas with fractionated electrograms during AF and the presence of low voltage, slowed conduction or fractionation during paced rhythm and (ii) whether regional atrial voltages observed during AF correlate with regional voltages during paced rhythm.
Methods
The study population consisted of 12 patients with drug-refractory persistent AF enrolled to undergo electroanatomic substrate mapping in addition to radiofrequency ablation for AF. Patients with a prior history of an AF ablation procedure were excluded. All patients provided written informed consent and the study protocol complies with the Declaration of Helsinki and was approved by the Melbourne Health and Alfred Hospital Research and Ethics Committees.
Study protocol
Electrophysiological study
The procedure was performed in the fasting state under general anaesthesia. All anti-arrhythmic medications were withheld at least five half-lives prior to the procedure with the exception of Amiodarone which was ceased at least 3 months prior to the procedure. All patients underwent trans-oesophageal echocardiography on the day of the procedure to exclude left atrial thrombus.
The following intracardiac catheters were positioned: (i) 10-pole coronary sinus (CS) catheter (2–5–2 mm inter-electrode spacing) with proximal bipole positioned at the CS ostium; (ii) His-bundle electrogram catheter; (iii) 20-pole Reflexion Spiral XX (1–4–1 mm inter-electrode spacing, variable loop 15–25 mm, St Jude Medical, Minneapolis, MN, USA) circular mapping catheter, and (iv) 3.5 mm externally irrigated-tip ablation catheter (D-curve irrigated Celsius Thermocool, 2–5–2 mm inter-electrode spacing, Biosense-Webster, Johnson & Johnson Diamond Bar, CA, USA). Double trans-septal access was obtained with standard techniques using a BRK1 needle and SL1 sheath (St Jude Medical). After establishing left atrial access, intravenous heparin was administered with a target-activated clotting time of 350 s.
Bipolar intra-cardiac electrograms and 12-lead surface electrocardiograph (ECG) were recorded simultaneously on a computerized digital amplifier system (EPMed Systems, West Berlin, NJ, USA). Intra-cardiac electrograms were filtered between 30 and 500 Hz; offline analysis was performed with on-screen digital callipers at 200 mm/s sweep speed.
Electroanatomic mapping
In order to determine regional variations in underlying atrial substrate during sinus or paced rhythm, we used a methodology which has been previously extensively described and utilized.8–12 This involves the creation of detailed activation and voltage maps during stable atrial pacing (utilized to ensure constant cycle-length). In these studies this methodology demonstrated significant abnormalities in atrial substrate with regional variation in a broad spectrum of patient populations. These abnormalities included low voltage, slowed conduction, fractionated, and double potentials, all of which varied according to regional atrial anatomy.8–12
For the study protocol, two electroanatomic maps were created for each patient. The first map was created during AF and subsequently a second map was created during distal CS pacing at a cycle-length of 600 ms. As all patients presented in spontaneous AF, mapping was initially performed in AF and then trans-thoracic direct cardioversion was performed to restore sinus rhythm prior to construction of the paced map.
Three-dimensional electroanatomic maps were created using the Ensite NavX system (St Jude Medical). Pre-operative cardiac computerized tomography images were integrated with the electroanatomic mapping system data in all cases. Points were acquired systematically by the clinician throughout the LA using surface colour projection with an interpolation threshold of 10 mm to ensure an even distribution of collected points. Points were collected using the multipolar circular mapping catheter with the ablation catheter used to collect points in areas where establishing adequate endocardial contact with the circular mapping catheter was difficult such as the left atrial appendage (LAA) and adjacent to the mitral annulus. Points were acquired manually by the mapping system operator once the clinician confirmed a stable catheter position. Careful evaluation of adequate endocardial contact and catheter position with respect to the underlying tissue were assessed by the presence of stable electrogram characteristics, fluoroscopy, and using distance-to-surface measurements on the geometry created by the mapping system. Once these criteria were satisfied, points were collected for analysis. Each individual electrogram was manually verified offline. For mapping during AF, once a stable catheter position was established, each site was sampled over a 5 s recording period. We chose this 5 s sample duration as consistent with prior publications demonstrating this to be as effective as longer durations.13,14 Following completion of the map in AF, patients underwent DC reversion and systematic mapping was repeated during distal CS pacing. Paced-rhythm points acquired following ectopic beats were excluded from analysis.
Voltage mapping
Local voltage during paced rhythm was defined as the amplitude between the absolute peak positive and peak negative deflections. During AF, the local voltage was defined as the amplitude between maximum peak positive and minimum peak negative deflections over the 5 s recording period using the system settings described in the assessment of fractionation section below. Bipolar voltage was initially annotated with the assistance of automated algorithms and manual verification of each individual point was performed offline to ensure its integrity. Appropriate time windows were applied to exclude the stimulus artefact and far-field ventricular electrograms during paced rhythm. A baseline noise threshold of 0.05 mV was applied to exclude background system noise. The LA was divided into eight segments for offline analysis: posterior, anterior, roof, floor, septum, lateral, LAA, and mitral isthmus (see Figure 1A). For each patient, the mean voltage during AF was compared with the mean voltage in paced rhythm. Low-voltage zones were defined as those with bipolar voltages <0.5 mV.15 The proportion of low-voltage signals in each segment was calculated by dividing the number of low-voltage signals by the total number of signals in that segment. The Spearman rank correlation (ρ) was calculated between AF and paced rhythm for regional mean voltage and % low voltage.
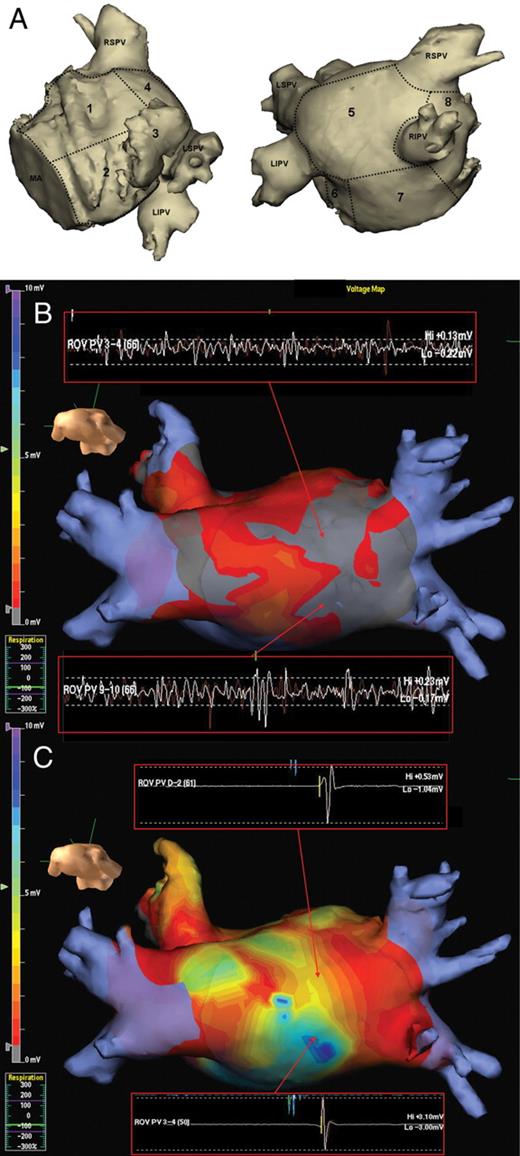
(A) Two views showing the eight left atrial segments used for regional analysis. 1, anterior; 2, lateral; 3, left atrial appendage; 4, roof; 5, posterior; 6, mitral isthmus; 7, floor; 8, septum; MA, mitral annulus; LSPV, left superior pulmonary vein; LIPV, left interior pulmonary vein; RSPV, right superior pulmonary vein; RIPV, right inferior pulmonary vein. (B and C) Colour-coded voltage map in the posterior–anterior view from the NavX 3D electroanatomic mapping system with areas of low voltage (<0.5 mV) in grey and normal voltage in remaining colour scale. Note increased areas of low voltage in AF (B) compared with normal voltages in paced rhythm (C). Note the regions of highly fractionated and low-voltage (<0.5 mV) signals during AF in (B) do not display fractionation and have a normal voltage in paced rhythm (C).
Assessment of fractionation
The assessment of electrogram fractionation during AF was performed using the cycle-length-based automated algorithm from the Ensite NavX system (St Jude Medical). This algorithm was chosen as it is now in widespread clinical usage including an ongoing large outcome study.5,16,17 Complex fractionated electrograms during AF were defined as those with a cycle-length <120 ms.5,6 In brief, the algorithm utilizes a peak–peak sensitivity threshold which is manually set to exclude baseline noise from the analysis. This was set to 0.05 mV which is just above the baseline noise in our laboratory. A user-defined refractory period of 50 ms was selected in order to avoid double-counting of signals during atrial refractoriness. A maximum electrogram width from peak–peak of 10 ms was also used to exclude broad far-field signals from analysis.18,19 Analysis of CFE was performed regionally using the eight atrial segments described above. The duration of signals used for analysis was 5 s. Complex fractionated electrograms during paced rhythm were defined by those with ≥3 deflections, >50 ms duration or those with two separate deflections separated by an isoelectric interval.20 The percentage of CFE signals in each segment was calculated by dividing the number of CFE signals into the total number of recorded signals for that segment. The Spearman rank correlation (ρ) was calculated between: (i) %CFE during AF vs. paced rhythm; (ii) %CFE during AF and % low voltage during paced rhythm; (iii) %CFE during AF and conduction; and (iv) %CFE during AF and low voltage during AF.
Assessment of conduction
Statistical analysis
All statistical analyses were performed using SPSS software version 17.0 (SPSS, Chicago, IL, USA). All continuous variables are expressed as mean±SD. Once continuous variables were assessed for normality, they were analysed using a two-tailed paired Student's t-test or the Wilcoxon rank-sum test as appropriate. The relationship between variables was assessed by calculating Spearman's rank correlation (ρ). A P value <0.05 was considered statistically significant.
Results
Patient demographics
The mean age was 56 ± 9 years; all patients were male. The mean duration of AF was 5.1 ± 6.2 years. There was evidence of mild left atrial dilatation (mean diameter 4.4 ± 0.3 cm). The left ventricular ejection fraction was preserved (mean LVEF =60 ± 6%).
Assessment of voltage
A total of 24 left atrial electroanatomic maps were created. There were a total of 176 ± 56 and 189 ± 104 voltage points taken per patient during paced rhythm and AF, respectively (P= 0.7). There was a significantly lower mean voltage during AF compared with paced rhythm for all atrial regions (Figure 2A). The overall left atrial mean voltage was also significantly lower during AF compared with paced rhythm (0.7 ± 0.2 mV vs. 2.1 ± 0.6 mV, P< 0.001). There was a significantly higher proportion of low-voltage zones in all regions of the LA during AF compared with paced rhythm (Figure 2B). The overall percentage of the LA classified as low voltage was significantly higher during AF compared with paced rhythm (53 ± 19% vs. 9 ± 2%, P< 0.001). An example of this difference is shown on a 3D electroanatomic map in Figure 1B. Except in the anterior wall (ρ = 0.7, P= 0.02), there was no significant correlation between the voltage during AF and voltage during paced rhythm when analysed according to region in each patient; mean Spearman's rank correlation was 0.3 ± 0.2 (range 0.06–0.7). There was also no correlation between the distribution of low-voltage zones during AF and low-voltage zones in paced rhythm; mean Spearman's rank correlation was 0.1 ± 0.2 (range 0.007–0.4).
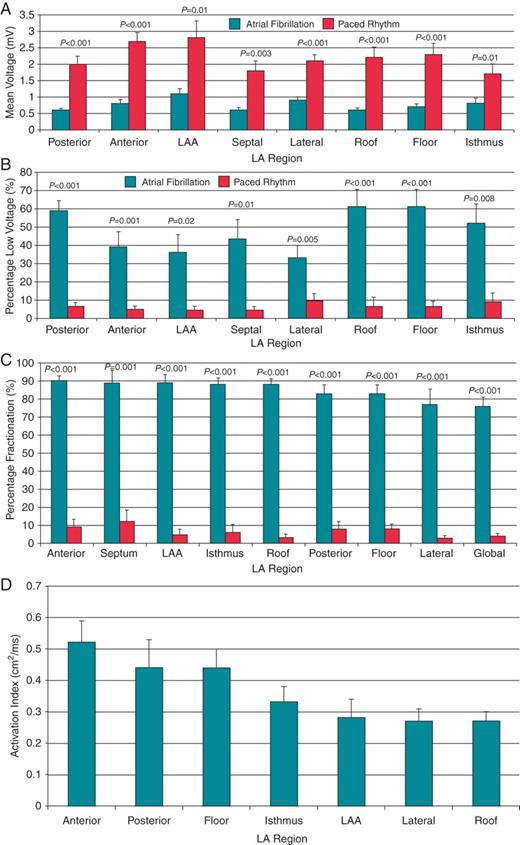
(A) Mean voltage in atrial fibrillation (black bars) vs. paced rhythm (white bars) according to left atrial region. (B) Percentage of low-voltage zones in atrial fibrillation (black bars) vs. paced rhythm (white bars) according to left atrial region. (C) Percentage of complex fractionated electrograms during atrial fibrillation (black bars) vs. paced rhythm (white bars) according to left atrial region. (D) Activation Index of each left atrial (LA) segment. LAA, left atrial appendage.
Assessment of fractionation and conduction
Complex fractionated electrogram zones during AF were prevalent throughout the LA with anterior, septal, LAA, mitral isthmus, and roof displaying the highest proportion of CFE (Figure 2C). During paced rhythm, the sites with the highest percentage of fractionated electrograms were the inter-atrial septum, anterior wall, posterior wall floor (Figure 2C). There was a significantly greater proportion of CFE during AF vs. paced rhythm in all regions of the atria (Figure 2C). Overall, 77 ± 17% and 4 ± 4% displayed CFE in AF and paced rhythm, respectively (P< 0.001). No atrial region demonstrated a significant correlation between CFE during AF and fractionated electrograms during paced rhythm (Figure 3A); mean Spearman's rank correlation was 0.2 ± 0.1 (range 0.03–0.4). An example of the disparity between the low-voltage, highly fractionated signals recorded during AF and normal voltage, non-fractionated signals recorded in the same region during paced rhythm is shown in Figure 1B. There was also no regional correlation between recording of CFE during AF and low voltage during paced rhythm (Figure 3B); mean Spearman's rank correlation was 0.1 ± 0.1 (range 0.04–0.2).
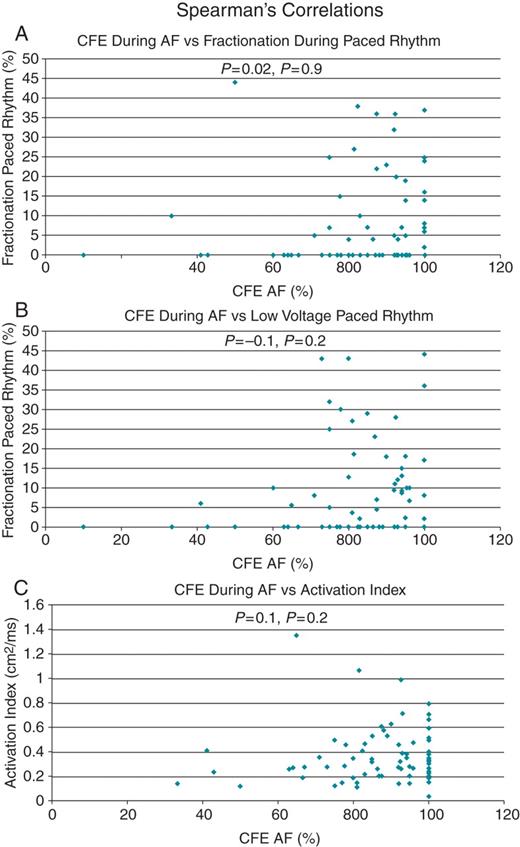
Spearman's correlation (ρ) graphs with representative examples showing poor correlation between percentage complex fractionated electrograms during atrial fibrillation: (A) fractionation in paced rhythm; (B) low voltage during paced rhythm; and (C) activation index.
The LA appendage, lateral wall, roof, and inter-atrial septum demonstrated the slowest conduction with the lowest Activation Indices (Figure 2D). There was no correlation between the proportion of CFE in a region during AF and local atrial conduction assessed during paced rhythm (Figure 3C); mean Spearman's rank correlation was 0.2 ± 0.1 (range 0.1–0.4).
An analysis of individual CFE recordings during AF demonstrated that the mean voltage of CFE signals was significantly higher than the mean voltage of non-CFE signals (0.71 ± 0.58 vs. 0.39 ± 0.45 mV, P< 0.001). There was a significant negative correlation between the proportion of CFE in the LA overall and low voltage during AF (ρ = −0.6, P= 0.04).
Discussion
The major finding of this study is that CFE regions during AF using the NavX algorithm did not correlate with an abnormal substrate of low voltage or slowed conduction during paced rhythm.
In addition we observed that: (i) mean voltages seen during AF were significantly lower than mean voltages during paced rhythm and there was no regional correlation between the two measurements; (ii) low-voltage zones were significantly more frequent during AF (>50% in many regions) than in paced rhythm (<10% in most regions) and there was no regional correlation between these measurements; (iii) CFE zones were much more common during AF compared with paced rhythm and there was no regional correlation between CFE zones seen during AF and paced rhythm.
Fractionation and low voltage as markers of atrial fibrillation substrate
Since the first report by Nademanee et al.6 describing the utility of ablation of CFE for cure of AF this approach has been adopted widely as an adjunctive strategy, particularly in patients with persistent AF.1–6 Complex fractionated electrograms are defined by the presence of high-frequency, low-voltage, and complex continuous signals. Underlying this approach is the assumption that regions displaying these features identify substrate for AF in the form of drivers, short cycle-length rotors,21 or critical regions of slow conduction.22 Indeed, Nademanee noted that high-frequency and complex signals often occur in areas of low voltage,7 potentially reflecting an abnormal underlying atrial substrate. In the current study we addressed the specific question of whether CFE defined by the NavX algorithm identify areas that show abnormal substrate (low voltage, slowed conduction, and complex signals) in a paced rhythm. Although our data show that this is not the case, this does not rule out the possibility that CFE signals nevertheless do identify critical regions necessary for AF maintenance. Complex fractionated electrograms may yet identify focal sources or rotors dependent on areas of heterogeneous functional refractoriness and anisotropic conduction which are only unmasked during AF. A study in isolated sheep hearts identified CFE at regions of functional wavebreak adjacent to the driving rotor.16,23 Other studies have suggested that CFE mark critical regions of autonomic ganglia inputs potentially critical to the AF mechanism.24
In contrast to these observations in AF, there are data in support of the concept that regions of CFE and low voltage during sinus rhythm mapping do identify atrial substrate. Regional atrial voltage reduction and an increased prevalence of complex fractionated signals in sinus rhythm have been demonstrated in a spectrum of conditions associated with AF (increasing age, sinus node disease, left ventricular failure, hypertension, and congenital heart disease).8–12 Using the same methodology as the current study, areas of low voltage and fractionated signals were shown to vary according to regional anatomy. In addition, even patients with ‘lone’ paroxysmal AF have evidence of a reduction in bi-atrial voltage and increased sinus rhythm fractionation compared with a normal control population.15 In pathology studies, areas of atrial fibrosis have been noted to be more prevalent in patients with AF and are a potentially pathogenic substrate for the arrhythmia.25 These data support the concept that mapping during sinus or paced rhythm can identify abnormal atrial myocardium. However, whether this substrate during sinus rhythm represents the same substrate targeted during AF, has, to date, not been clearly demonstrated. In our series, regional analysis did not demonstrate any significant correlation between the regional distributions of CFE during AF with that during paced rhythm. Importantly, regions of CFE in AF frequently demonstrated non-fractionated electrograms with normal voltage and no evidence of regional conduction slowing. Therefore, these findings suggest that not all low-voltage CFE regions in AF (using the NavX definition) are necessarily a reflection of regional atrial myocardial abnormality.
Prior studies
Ndrepepa et al.26 have previously demonstrated a significantly lower voltage during AF compared with sinus rhythm in both the left and right atria of AF patients using a multi-electrode basket catheter. Our data support these findings with significantly lower voltages measured during AF compared with paced rhythm across all left atrial regions with no correlation between the AF and paced rhythm voltage measurements. Ndrepepa et al. hypothesized several mechanisms by which voltage may be reduced during AF: (i) short cycle-length activity during AF could result in wavelet propagation through partially repolarized tissue, which has been shown to reduce signal amplitude; (ii) summation of local potentials is reduced due to the spatial and temporal dissociation of conduction seen during AF.26 In addition to these proposed mechanisms, bipolar voltage measurements are highly dependent on the direction of wavefront propagation. During AF, multiple wavefronts propagate in random and highly variable directions, potentially reducing summation of the recorded voltage.
Another recent study did observe that specific localized CFE sites were also of low voltage during paced rhythm.27 However, these much-localized low-voltage CFE sites were surrounded by high-voltage zones during atrial pacing. As a result, CFE regions actually demonstrated a higher mean voltage than non-CFE regions.27 In addition, comparison of individual electrograms in our study revealed the unexpected finding of a higher voltage for CFE vs. Non-CFE recordings and a negative correlation between CFE and percentage low voltage during AF. However, two recent studies have made similar observations when using an automated cycle-length-based algorithm rather than a visual assessment of complexity to define CFE.18,28
Previous studies examining the prevalence of CFE have identified wide variations ranging between 35% and 86% of total left atrial sites as CFE with up to 97% prevalence of CFE within specific regions.5,18,28–30 These differences may relate in part to the definition of CFE used (signal complexity, continuous activity, or short cycle-length activity)1–6,18,19,28,30 and whether visual assessment or automated algorithms have been used.1–6,18,19,28,30,31 In addition, studies describing the location and prevalence of CFE have demonstrated significant changes in CFE prevalence following PVI.1–4,6,18,27–30,32 In the current study, CFE (defined on the basis of an automated cycle-length algorithm) were observed in over 80% of signals in some regions.
Study limitations
In this study we used the NavX system-automated algorithm of cycle-length to define CFE. We cannot exclude the possibility that using either a different automated algorithm with a different mapping system, mapping catheters with different inter-electrode spacing, unipolar instead of bipolar recordings, different pacing sites/cycle lengths, or using visual assessment of electrogram complexity may have yielded different results. Our study included patients with persistent AF who had preserved left ventricular function and were able to be cardioverted prior to ablation; our findings may not necessarily be applicable to the broader AF population.
Conclusions
Areas of CFE and low voltage recorded during AF frequently demonstrate normal atrial myocardial characteristics (normal conduction, electrograms and voltage) during sinus rhythm. Therefore, AF CFE sites do not necessarily identify regions of abnormal atrial substrate. However, this does not exclude the possibility that CFE might identify a focal driver or source occurring in a region of normal atrial myocardium.
Conflict of interest: none of the authors have any conflicts of interest to declare.
Funding
Drs Teh and Medi are the recipients of a postgraduate research scholarship from the National Heart Foundation of Australia. Dr Lee is the recipient of a postgraduate research scholarship from the National Health and Medical Research Council. Drs Teh, Medi and Lee are the recipients of a cardiovascular and lipid research grant from Pfizer. Dr Kistler is supported by a Research Investigatorship from the Cardiac Society of Australia and New Zealand. Dr Sanders reports having served on the advisory board of and having received lecture fees and research funding from St Jude Medical, Bard Electrophysiology, Biosense–Webster, and Medtronic.
