


Abstract
Total atrial activation time has been identified as an independent predictor of new-onset atrial fibrillation (AF). Echocardiographic assessment of PA-TDI duration provides an estimation of total atrial conduction time. The aim of this study was to investigate the prognostic value of total atrial conduction time to predict AF recurrence after radiofrequency catheter ablation (RFCA).
In 213 patients undergoing RFCA for symptomatic drug-refractory paroxysmal AF, the total atrial conduction time was estimated by measuring the time delay between the onset of the P-wave in lead II of the surface electrocardiogram and the peak A’-wave on the tissue Doppler tracing of the left atrial (LA) lateral wall (PA-TDI duration). After RFCA, all patients were evaluated on a systematic basis at the outpatient clinic. After a mean follow-up of 13 ± 3 months, 74 patients (35%) had recurrent AF whereas 139 patients (65%) maintained sinus rhythm. Left atrial maximum volume index and PA-TDI duration were identified as independent predictors of AF recurrence after RFCA. However, receiver operator characteristics curve analyses demonstrated that PA-TDI duration had a superior accuracy to predict AF recurrence compared with LA maximum volume index (area under the curve 0.765 vs. 0.561, respectively).
Assessment of total atrial conduction time using tissue Doppler imaging can be used to predict AF recurrence after RFCA.
Introduction
Atrial fibrillation (AF) causes electrical and structural changes to the atria which play an important role in the perpetuation and progression of the arrhythmia.1,2 This process is referred to as atrial remodelling. A large extent of atrial remodelling is associated with a limited efficacy of radiofrequency catheter ablation (RFCA) for AF.3 Therefore, pre-procedural assessment of the extent of atrial remodelling could be used to identify patients with a high risk of AF recurrence after RFCA.
Currently, the most commonly used method to estimate the extent of atrial remodelling is the measurement of the left atrial (LA) size. Left atrial size is an independent predictor of new-onset AF in the general population and has been identified as a predictor of AF recurrence after RFCA.4–7 However, the clinical applicability of LA size to identify patients with a high likelihood to maintain sinus rhythm after RFCA for AF is limited. Therefore, additional markers of atrial remodelling are needed to improve patient selection.
Total atrial conduction time has been proposed as a marker of atrial remodelling. In contrast to LA size, total atrial conduction time reflects the extent of both electrical and structural remodelling of the atria. Recently, a novel echocardiographic parameter based on tissue Doppler imaging (TDI) has been introduced to assess the total atrial conduction time: the PA-TDI duration.8 Potentially, this new parameter provides a more accurate assessment of the presence and extent of atrial remodelling than conventional echocardiographic parameters. The aim of this study was to investigate the prognostic value of total atrial conduction time to predict AF recurrence after RFCA.
Methods
Patient population and evaluation
The patient population consisted of a group of consecutive patients with symptomatic drug-refractory paroxysmal AF, undergoing RFCA. Atrial fibrillation was classified as paroxysmal when episodes were generally self-terminating and lasted no longer than 7 days, according to the European Society of Cardiology guidelines definitions.9 Persistent AF was defined as AF episodes lasting longer than 7 days or requiring termination by cardioversion.9 Prior to the procedure, all patients underwent a comprehensive transthoracic echocardiographic examination to assess LA size and function, left ventricular (LV) function, and to exclude structural heart disease. In addition, a novel echocardiographic parameter was assessed to estimate the total atrial conduction time (PA-TDI duration). The PA-TDI duration is measured using TDI during sinus rhythm. Therefore, patients who were in AF during echocardiography were excluded from the analysis. After the ablation, all patients were evaluated on a systematic basis at the outpatient clinic during a 12-month follow-up period. Electrocardiogram (ECG) recordings were acquired on each visit and 24 h Holter registrations were scheduled after 3, 6, and 12 months of follow-up. Importantly, all patients were encouraged to immediately obtain an ECG registration when experiencing palpitations. All medications were continued for at least 3 months. Afterwards, anti-arrhythmic drugs were discontinued at the discretion of the physician. After a blanking period of 3 months, recurrence of AF was defined as any recording of AF on ECG or an episode longer than 30 s on 24 h Holter registration.
Standard echocardiography
Two-dimensional transthoracic echocardiography was performed using a commercially available ultrasound system (Vivid 7, General Electric Vingmed, Milwaukee, WI, USA), equipped with a 3.5 MHz transducer at a depth of 16 cm. All patients were imaged in left lateral decubitus position. Two-dimensional and colour Doppler data were obtained in the parasternal short- and long-axis views and the apical two- and four-chamber views. All images were ECG-triggered and stored in cineloop format for off-line analyses (EchoPac 108.1.5, General Electric Medical Systems, Horten, Norway). Left atrial volumes were obtained from the apical views by disc's method and indexed to body surface area.10 Left atrial volumes were measured at two phases of the cardiac cycle: LA maximum volume at the end-systolic phase (just before mitral valve opening) and LA minimum volume at the end-diastolic phase (just before mitral valve closure). The LA function was derived from the LA volumes by calculating the total LA emptying fraction according to the following formula: total LA emptying fraction = [(LA maximum volume – LA minimum volume)/LA maximum volume) × 100%. Left ventricular ejection fraction was calculated from the standard apical two- and four-chamber views by Simpson's method, according to the American Society of Echocardiography guidelines.10 Left ventricular diastolic function was evaluated using pulsed-wave Doppler recordings of the mitral valve inflow pattern (E-wave, A-wave, and deceleration time of the E-wave) and Doppler tissue recordings of the mitral annular motion (E’-wave). In addition, the diastolic function grade was classified as either normal, Grade 1 (impaired relaxation), Grade 2 (pseudonormalization), or Grade 3 (restrictive filling pattern) as recommended by current guidelines.11
Atrial tissue Doppler imaging
The PA-TDI duration is a novel echocardiographic parameter that can be used to estimate the total atrial conduction time.8 Colour-coded TDI images of the LA were obtained from the apical four-chamber view during end-expiration, with the sector size and depth optimized for the highest frame rates possible (>115 frames/s). The ultrasound beam was carefully aligned to keep the incidence angle as small as possible. To assess the PA-TDI duration, a fixed 9 × 9 pixel region of interest was placed on the LA lateral wall just above the mitral annulus providing the tracing of the mechanical activation in that area (Figure 1). The PA-TDI duration was assessed by measuring the time interval between the onset of the P-wave in lead II of the surface ECG and the peak A’-wave on the tissue Doppler tracing (Figure 1). A long PA-TDI duration corresponds to a long total atrial conduction time.
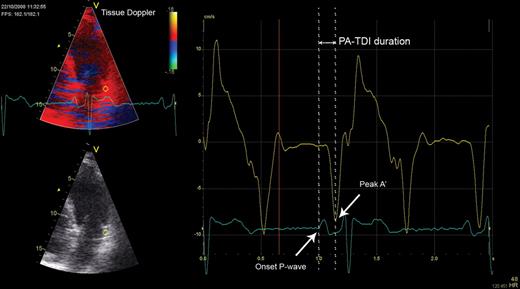
Measurement of the total atrial conduction time (PA-TDI duration). A fixed 9 × 9 pixel region of interest (yellow) was positioned in the left atrial lateral wall on a tissue Doppler recording to obtain a tracing of the mechanical activation in this area (yellow tracing). A simultaneously acquired registration of surface electrocardiogram lead II (blue tracing) was displayed underneath the tissue Doppler tracing. The PA-TDI duration (double arrow) was assessed by measuring the time interval between the onset of the P-wave in lead II and the peak A’-wave on the tissue Doppler tracing (single arrows).
Bland–Altman analyses were performed in our laboratory to assess the inter- and intra-observer reproducibility of PA-TDI duration measurements showing minimal biases and tight limits of agreement (1.8 ± 10 and 1.7 ± 10 ms, respectively).12
Radiofrequency catheter ablation
Radiofrequency catheter ablation was aimed at creating circular lesions around the left and right pulmonary vein ostia. All patients received intravenous heparin to maintain an activated clotting time of 300–400 s. A transseptal puncture was performed to gain entrance to the LA. Intracardiac echocardiography was used to guide the transseptal puncture. A non-fluoroscopic electroanatomical mapping system with multi-slice computed tomography integration was used to guide the ablation procedure (CARTO XPTM, CartomergeTM, Biosense Webster, Diamond Bar, CA, USA). Mapping and ablation were performed using a 3.5 mm quadripolar open-loop irrigated mapping/ablation catheter (7.5Fr NavistarTM, Biosense Webster). Radiofrequency current was applied at 30–35 W with a maximum temperature of 45°C and an irrigation flow of 20 mL/min until a bipolar voltage of <0.1 mV was achieved, with a maximum of 60 s per point. The end-point of the procedure was pulmonary vein isolation as confirmed by recording entrance block during sinus rhythm or pacing from inside the coronary sinus.13
Statistical analysis
All variables were tested for a normal distribution by means of the Kolmogorov–Smirnov test. Continuous variables are presented as mean ± SD and were compared with the Student's t-test. Categorical variables are presented as number (percentage) and were compared by means of the χ2 test. Univariable and multivariable Cox proportional hazard analyses were performed to investigate clinical and echocardiographic predictors of AF recurrence after RFCA. All variables mentioned in Tables 1 and 2 were included in the univariable analyses. Variables with a P value <0.05 in the univariate analysis were included into the multivariate analysis. Multivariate analysis was performed using a backward stepwise conditional approach. Variables with a P> 0.05 were excluded from the model. The receiver operator characteristics (ROC) curve was calculated to evaluate the performance of the strongest independent predictors of AF recurrence after RFCA obtained at multivariate analysis. All statistical analyses were performed using SPSS software (version 16.0, SPSS Inc., Chicago, IL, USA). A value of P< 0.05 was considered statistically significant.
Baseline characteristics
| Overall | Non-recurrence | Recurrence | P value | |
|---|---|---|---|---|
| (n= 213) | (n= 139) | (n= 74) | ||
| Clinical characteristics | ||||
| Age (years) | 55 ± 11 | 55 ± 9 | 55 ± 15 | 0.99 |
| Male gender, n (%) | 165 (77) | 108 (78) | 57 (77) | 0.91 |
| Body surface area (m2) | 2.1 ± 0.2 | 2.1 ± 0.2 | 2.1 ± 0.2 | 0.18 |
| Body mass index (kg/m2) | 26.5 ± 3.6 | 26.4 ± 3.4 | 26.8 ± 3.8 | 0.41 |
| CHADS2 score ≥2, n (%) | 15 (7) | 13 (9) | 2 (3) | 0.07 |
| Duration of atrial fibrillation (months) | 67 ± 60 | 68 ± 56 | 65 ± 66 | 0.75 |
| History of cardioversion, n (%) | 114 (54) | 68 (49) | 46 (62) | 0.07 |
| History of persistent atrial fibrillation, n (%) | 46 (22) | 19 (14) | 27 (36) | <0.001 |
| Failed anti-arrhythmic drugs (n) | 3.2 ± 1.3 | 3.2 ± 1.4 | 3.2 ± 1.2 | 0.92 |
| Hypertension, n (%) | 88 (41) | 53 (38) | 35 (47) | 0.20 |
| Diabetes, n (%) | 9(4) | 8 (6) | 1 (1) | 0.13 |
| Medication | ||||
| ACE-inhibitor, n (%) | 48 (23) | 32 (23) | 16 (22) | 0.82 |
| Angiotensin-II receptor blocker, n (%) | 58 (27) | 34 (24) | 24 (32) | 0.21 |
| Class IC anti-arrhythmic drug, n (%) | 75 (35) | 54 (39) | 21 (28) | 0.13 |
| Class III anti-arrhythmic drug, n (%) | 121 (57) | 77 (55) | 44 (59) | 0.57 |
ACE-inhibitor, angiotensin-converting enzyme inhibitor.
Echocardiographic characteristics
| Overall | Non-recurrence | Recurrence | P value | |
|---|---|---|---|---|
| (n= 213) | (n= 139) | (n= 74) | ||
| Volumes | ||||
| LA maximum volume index (mL/m2) | 39 ± 12 | 38 ± 11 | 42 ± 13 | 0.014 |
| LA minimum volume index (mL/m2) | 20 ± 8 | 20 ± 8 | 22 ± 9 | 0.029 |
| LA emptying fraction (%) | 49 ± 12 | 49 ± 12 | 48 ± 12 | 0.46 |
| LV ejection fraction (%) | 59 ± 5 | 59 ± 5 | 58 ± 6 | 0.10 |
| Pulsed wave Doppler | ||||
| E-wave (m/s) | 0.63 ± 0.16 | 0.62 ± 0.16 | 0.64 ± 0.16 | 0.36 |
| A-wave (m/s) | 0.54 ± 0.15 | 0.55 ± 0.14 | 0.52 ± 0.15 | 0.21 |
| E/A-ratio | 1.24 ± 0.48 | 1.21 ± 0.46 | 1.31 ± 0.51 | 0.12 |
| Deceleration time (s) | 212 ± 67 | 213 ± 68 | 207 ± 63 | 0.56 |
| Doppler tissue imaging | ||||
| E’-wave (cm/s) | 9.1 ± 2.4 | 9.0 ± 2.5 | 9.2 ± 2.3 | 0.58 |
| E/E’-ratio | 7.3 ± 2.6 | 7.3 ± 2.7 | 7.3 ± 2.3 | 0.92 |
| Diastolic function grade | ||||
| Normal, n (%) | 168 (79) | 108 (78) | 60 (81) | 0.57 |
| Grade 1: impaired relaxation, n (%) | 45 (21) | 31 (22) | 14 (19) | |
| Grade 2: pseudo-normalization, n (%) | 0 (0) | 0 (0) | 0 (0) | |
| Grade 3: restrictive filling pattern, n (%) | 0 (0) | 0 (0) | 0 (0) | |
| Atrial electromechanical interval | ||||
| PA-TDI duration (ms) | 132 ± 25 | 124 ± 23 | 146 ± 20 | <0.001 |
Gr, Grade; LA, left atrial; LV, left ventricular; PA-TDI duration, total atrial conduction time.
Results
Patient characteristics
The present patient population was prospectively included from an ongoing clinical registry.14 Out of 323 consecutive patients undergoing RFCA for paroxysmal AF, 213 patients were in sinus rhythm during transthoracic echocardiography and comprised the patient population [165 men (77%), mean age 55 ± 11 years]. Importantly, none of these patients had previously undergone RFCA for AF. The procedural end-point of PV isolation was reached in all patients and no major procedural complications occurred.
After a mean follow-up of 13 ± 3 months, 74 patients (35%) had recurrent AF and 139 patients (65%) had maintained stable sinus rhythm. Patients with AF recurrence had significantly larger LA volumes compared with patients who maintained sinus rhythm (LA maximum volume index: 42 ± 13 vs. 38 ± 11 mL/m2, P= 0.014; LA minimum volume index: 22 ± 9 vs. 20 ± 8 mL/m2, P= 0.029). Moreover, patients with AF recurrence more often had a history of persistent AF than patients who maintained sinus rhythm [27 (36%) vs. 19 (14%), P< 0.001). More detailed comparisons of baseline characteristics and echocardiographic characteristics between patients with AF recurrence and patients who maintained sinus rhythm are shown in Tables 1 and 2, respectively.
Total atrial conduction time
The mean PA-TDI duration for the overall population was 132 ± 25 ms. There was no relation between the use of Class 1c or Class 3 anti-arrhythmic drugs and PA-TDI duration. Patients with AF recurrence during follow-up had a significantly longer PA-TDI duration at baseline than patients who maintained sinus rhythm (146 ± 20 vs. 124 ± 23 ms, P< 0.001). Moreover, PA-TDI duration was significantly longer in patients who had been previously classified as persistent AF (142 ± 21 vs. 129 ± 25 ms, P= 0.002).
Clinical predictors of atrial fibrillation recurrence
Univariate and multivariate Cox proportional hazard analyses were performed to identify clinical and echocardiographic predictors of AF recurrence after RFCA (Table 3). Left atrial maximum volume index (HR per mL/m2: 1.020, P= 0.030) and PA-TDI duration (HR per ms: 1.035, P< 0.001) were identified as independent predictors of AF recurrence. Importantly, multivariate analyses demonstrated that there was no interaction between LA maximum volume index or PA-TDI duration and a history of AF. This illustrates that both LA maximum volume index and PA-TDI duration have a similar prognostic value in patients with and without a history of persistent AF. Therefore, LA maximum volume index and PA-TDI duration can be used to predict AF recurrence in both groups of patients. To study the discriminative performance of these variables to predict AF recurrence after RFCA, ROC curve analyses were performed (Figure 2). The area under the ROC curve (index of discrimination) for LA maximum volume was 0.561 (P= 0.14), indicating a low discriminative power. The PA-TDI duration demonstrated a higher degree of discrimination than LA maximum volume index with an area under the ROC curve of 0.765 (P< 0.001). To illustrate the implication of this finding, an example of a patient with a relatively small LA and a long total atrial conduction time is shown in Figure 3. Despite the relatively small LA size, the prolonged total atrial conduction time indicates a high extent of atrial remodelling most likely caused by a decreased atrial conduction speed. Consequently, this patient experienced AF recurrence during follow-up, illustrating the importance of total atrial conduction time to predict AF recurrence after RFCA. To further illustrate the impact of PA-TDI duration on the risk for AF recurrence, the Kaplan–Meier curve for freedom of AF after RFCA according to PA-TDI quartiles is shown in Figure 4.
Univariate and multivariate Cox proportional hazard analyses of atrial fibrillation recurrence after catheter ablation
| Univariate analysis | Multivariate analysis | |||
|---|---|---|---|---|
| Variable | HR | P value | HR | P value |
| History of persistent atrial fibrillation (y/n) | 2.467 | <0.001 | – | – |
| LA maximum volume index (mL/m2) | 1.024 | 0.011 | 1.020 | 0.030 |
| LA minimum volume index (mL/m2) | 1.029 | 0.025 | – | – |
| PA-TDI duration (ms) | 1.036 | <0.001 | 1.035 | <0.001 |
HR, hazard ratio; LA, left atrium; PA-TDI duration, total atrial conduction time.
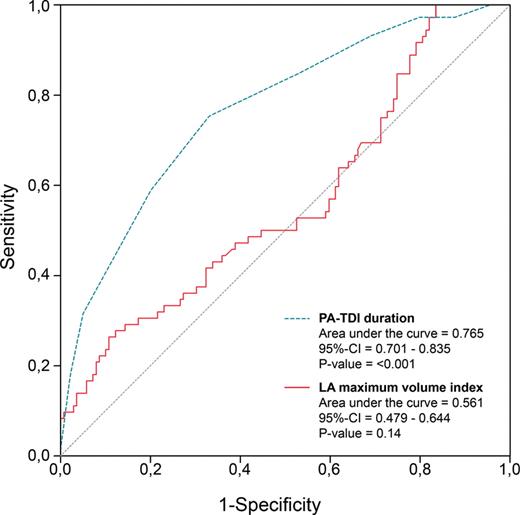
Receiver operator characteristic curve analyses of the total atrial conduction time (PA-TDI duration) and left atrial maximum volume index according to the recurrence of atrial fibrillation during follow-up. CI, confidence interval.
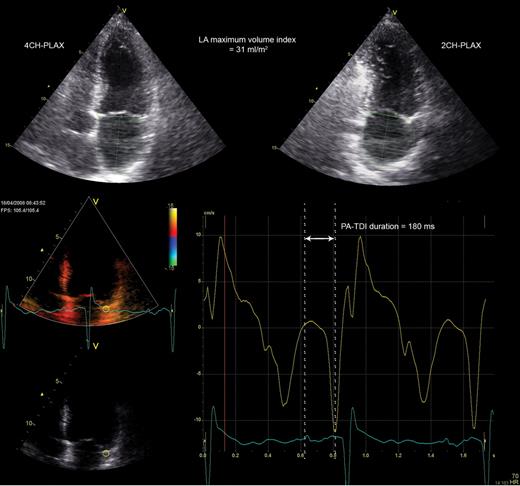
Example of a patient with a small left atrial size and a long total atrial conduction time (PA-TDI duration). The left atrial maximum volume index was obtained from the two- and four-chamber parasternal long-axis views (2CH-PLAX and 4CH-PLAX, respectively) and measured 31 mL/m2. A tissue Doppler tracing of the left atrial lateral wall demonstrated a PA-TDI duration (arrow) of 180 ms. Despite the small left atrial size, the long PA-TDI duration indicates a large extent of atrial remodelling. This patient has experienced recurrence of atrial fibrillation during follow-up.
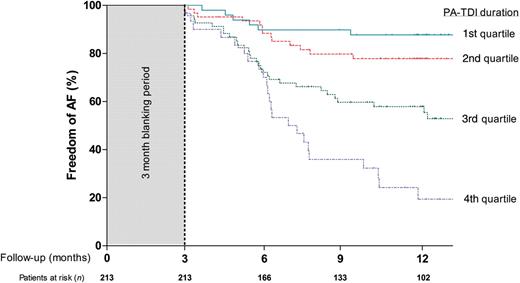
Kaplan–Meier curve for freedom of atrial fibrillation after radiofrequency catheter ablation according to total atrial conduction time (PA-TDI duration) quartiles.
Discussion
The present study investigated the value of pre-procedural echocardiographic assessment of the total atrial conduction time using TDI to predict AF recurrence after RFCA in patients with paroxysmal AF. The main finding was that PA-TDI duration was an independent predictor of AF recurrence after RFCA. Moreover, PA-TDI duration was a stronger predictor of AF recurrence than LA maximum volume index and demonstrated a higher degree of discrimination to identify patients who will have AF recurrence after RFCA.
Conventional predictors of atrial fibrillation recurrence
Radiofrequency catheter ablation is considered a reasonable option for patients with symptomatic, drug refractory AF.13 However, RFCA for AF is associated with a considerable recurrence rate.15 A large number of parameters has been related to a high risk of AF recurrence after RFCA, such as age, arterial hypertension, type of AF, LA size, and impaired LV systolic function.5,6,16,17 Interestingly, these parameters all seem to either cause or reflect the presence and extent of atrial remodelling. A high extent of atrial remodelling is thought to limit the efficacy of RFCA for AF.
In the present study a history of persistent AF and a large LA maximum volume index were associated with a higher risk for AF recurrence. Moreover, multivariate analysis demonstrated that LA maximum volume index was an independent predictor of AF recurrence after RFCA. This is in agreement with previous studies that have identified LA size as a predictor of AF recurrence after RFCA.4–7 Moreover, this finding is in agreement with the assumption that significantly dilated atria are associated with a high degree of atrial remodelling that may limit the efficacy of RFCA. Nevertheless, LA size may not be the most appropriate approach to identify patients who will experience AF recurrence after RFCA, as the present study demonstrated (Figure 2). Although LA maximum volume index was independently associated with AF recurrence after RFCA, the discriminative power of this parameter was low [area under the ROC curve of 0.561 (P= 0.14)]. Therefore, additional parameters are needed to improve patient selection.
Total atrial conduction time and atrial fibrillation recurrence
In addition to atrial dilatation, slow atrial conduction velocity may be another consequence of atrial remodelling.18 Atrial enlargement and slowing of the atrial conduction velocity can result in a larger number of re-entrant wavelets inside the atria. This situation favours the development and perpetuation of AF.19 The total atrial conduction time is related to the atrial dimensions and conduction speed. Consequentially, compared with LA size, the assessment of the total atrial conduction time may provide a more comprehensive estimation of the amount of atrial remodelling since this parameter integrates LA dimensions and electrical properties of the LA wall. Recently, Allessie et al.20 underlined the importance of electrical remodelling in the development of substrate for AF by demonstrating a substantially higher degree of functional reentry during longstanding AF as compared with acute AF. Furthermore, Choi et al.21 demonstrated that by decreasing the total atrial conduction time with linear triple-site pacing, burst-induction of AF could be prevented in some patients with persistent AF.
The PA-TDI duration is an easy, fast, and reliable method to estimate the total atrial conduction time. This novel echocardiographic parameter has been validated against P-wave duration on signal-averaged electrocardiography.8 Accordingly, PA-TDI duration has been used to identify patients with an atrial substrate vulnerable to develop AF.22–24 The present study demonstrated that PA-TDI duration was an independent predictor of AF recurrence after RFCA. Importantly, PA-TDI duration was a stronger predictor of AF recurrence after RFCA than LA size and demonstrated a higher degree of discrimination [area under the ROC curve of 0.765 (P< 0.001)].
Clinical implications
Several risk factors for AF recurrence after RFCA have been identified. However, the ability to predict which patients will benefit from RFCA for AF based on those risk factors remains limited. Left atrial size is one of the most frequently used parameters to select patient for RFCA of AF. However, the accuracy of this parameter to predict the efficacy of RFCA for AF is suboptimal. Left atrial size reflects the amount of structural changes to the LA tissue caused by atrial remodelling. In contrast, total atrial conduction time reflect both structural changes (LA dimensions) as well as changes in the electrical properties (atrial conduction velocity) caused by atrial remodelling, and provides a more comprehensive estimation of the amount of atrial remodelling. The current study demonstrated that total atrial conduction time had a higher discriminative power than LA size and can be used to improve patient selection. If further validated, total atrial conduction time may be used during pre-procedural consultation to better inform patients about their risk for AF recurrence after RFCA. Alternatively, in patients with a prolonged total atrial conduction time, the creation of a more extensive lesion set could be considered in order to improve the outcome of the procedure. Importantly, echocardiographic assessment of the total atrial conduction time using TDI is easy, reliable, fast, widely available, and can be applied in routine clinical practice.
Limitations
Some limitations of the present study should be acknowledged. First, detection of AF recurrence after RFCA was based on ECG recordings acquired on a systematic basis and/or 24 h Holter registration. Importantly, patients were encouraged to obtain an ECG registration when experiencing palpitations in order to confirm AF as the cause of these complaints. Nevertheless, asymptomatic episodes may have been missed. Secondly, the present study comprised a relatively small group of patients. Therefore, the present findings need to be validated in a larger group of patients. Finally, TDI does not differentiate between active contraction or passive motion of the myocardial segments. The advent of two-dimensional speckle tracking analysis may provide additional information by identifying active motion of the LA wall. Furthermore, total atrial conduction time can only be assessed during sinus rhythm.
Conclusion
An increased total atrial conduction time assessed with TDI echocardiography is an independent predictor of AF recurrence after RFCA for paroxysmal AF.
Conflict of interest: none declared.
Funding
M.J.S. receives research grants from Boston Scientific, Medtronic and Biotronik. J.J.B. receives research grants from General Electric Healthcare, Bristol-Myers Squibb Medical Imaging, St Jude, Medtronic, Boston Scientific, Biotronik, and Edwards Lifesciences. S.A.T. receives a research grant from Medtronic.
