


Abstract
Discrete, fragmented, local voltage potentials (LVPs) have been observed in electrograms recorded at the ablation site in patients undergoing radiofrequency ablation for arrhythmias originating in both the right and left ventricular outflow tract; however, the incidence and the significance of the LVP with respect to arrhythmogenesis is uncertain.
We studied 25 patients with outflow tract arrhythmias referred for radiofrequency catheter ablation and recorded high-amplified intracardiac electrograms close to the site of origin of the arrhythmia. Ten patients undergoing ablation for supraventricular arrhythmias served as controls. During sinus rhythm, LVPs were recorded in 24 of the 25 patients, 10–85 ms (41 ± 19 ms) after the onset of the QRS complex, duration 33 ± 11 ms, voltage 2.0 ± 1.5 mV. The same potential was recorded 10–52 ms (mean 37 ± 11 ms) prior to the V potential in the ventricular premature beats. In 10 patients, ventricular parasystole was suggested by varying coupling intervals >100 ms, and fusion beats allowing for the estimation of the least common denominator of R-R intervals. In 23 of the 25 patients, the 12-lead electrocardiogram (ECG) and intracardiac contact mapping located the arrhythmias to an area of 3–4 cm 2 in the septal region of the right ventricular outflow tract; in two patients, the site of origin was in the left coronary cusp. Radiofrequency ablation carried out in 24 of the 25 patients was successful in 21 patients, and after successful ablation, the LVP could still be recorded in all these 21 patients. The LVP was not present in 10 controls.
Local potentials are recorded close to the site of origin of ventricular ectopy in >90% of patients with idiopathic outflow tract ectopy and imply successful ablation. The potentials may reflect an area of depressed conductivity known to be a prerequisite for experimental ventricular ectopy including parasystole.
Introduction
It is generally accepted that outflow tract ventricular ectopy is caused by triggered activity, 1 and in experimental models it has been shown that a prerequisite for ventricular premature beats (VPBs), ventricular parasystole, and ventricular tachycardia (VT) is an inexcitable area of conduction impairment surrounding the ectopic pacemaker, thereby protecting the pacemaker by entrance block. 2–8
Clinically, discrete and fragmented local voltage potentials (LVPs) have been documented in electrograms recorded at ablation site in patients undergoing radiofrequency ablation for arrhythmias originating in the outflow tract 8–10 ; however, the significance of the LVPs with respect to arrhythmogenesis is uncertain.
The aim of the present study was to investigate the incidence of the LVP in consecutive patients with outflow tract ectopy referred for radiofrequency ablation compared with controls and the possible role of the LVP in arrhythmia mechanisms.
Methods
Patients and clinical electrocardiogram characteristics
We investigated 25 out of 28 consecutive patients with VPBs referred for radiofrequency catheter ablation. Only patients having VPBs with a left bundle branch block pattern were considered, and patients with structural heart disease (i.e. right ventricular dysplasia) were excluded.
The latter were excluded by a detailed family history focusing on sudden cardiac death events occurring in the near family. Two-dimensional echocardiography was performed prior to radiofrequency ablation in all patients. In patients experiencing sustained VT, MRI and/or RV angiography was performed.
Seventeen patients also had non-sustained VT (NSVT) defined as three or more beats and lasting <30 s, four of those also had sustained VT (≥30 s) with the same QRS morphology as the VPBs ( Table 1 ). In all 25 patients, VPBs showed a left bundle branch block pattern with transition zone from V 2 to V 4 ( Figure 1 ). The frontal QRS axis was >90° in 13 patients and 60°−90° in 12 patients, whereas in aVL, a QS pattern was present in 24 patients. In addition, 22 of the 25 patients showed concordance between the QRS vector of the VPB and the QRS vector of the sinus beat in 10–12 of the 12-lead ECG, and in the 3 remaining patients, there was concordance in at least 8 of 12 leads.
Patient characteristics, electrocardiogram findings, and results of single-beat analysis of intracardiac electrograms
| Patient no/ age/sex | Non-sustained VT/sustained VT | VT cycle length | Fusion | Location | %VPB/24 h | Mean cycle length (range) | QRS − LVP (ms) | LVP vpb − V vpb or LVP vpb − QRS | LVP amplitude (mV) | LVP duration (ms) | LVP vpb amplitude (mV) | LVP vpb duration (ms) |
|---|---|---|---|---|---|---|---|---|---|---|---|---|
| 1/58/f | 6/− | 353 | − | RVOT | 10.7 | 386 (300–500) | 25 | 29 | 3.2 | 24 | 2.7 | 27 |
| 2/52/f | 37/− | 360 | + | RVOT | 11.9 | 370 (295–480) | 70 | 10 | 3.2 | 46 | 3.3 | 50 |
| 3/49/m | 7/+ | 400 | + | RVOT | 1.1 | 413 (320–500) | 45 | 27 | 1.2 | 45 | 1.3 | 45 |
| 4/58/f | −/− | − | − | RVOT | NA | 520 (520–900) | NA | NA | NA | NA | NA | NA |
| 5/54/m | −/− | − | − | RVOT | 1.8 | 540 (540–550) | 85 | 52 | 0.3 | 45 | 0.7 | 45 |
| 6/63/f | −/− | − | + | RVOT | 10 | 429 (380–510) | 40 | 21 | 0.9 | 37 | 1.8 | 20 |
| 7/58/f | 3/− | 533 | + | RVOT | 30.4 | 587 (430–700) | 75 | 42 | 1.0 | 56 | 2.4 | 56 |
| 8/33f | 4/− | 400 | + | RVOT | 10.5 | 413 (375–515) | 50 | 40 | 1.8 | 25 | 1.2 | 30 |
| 9/29/f | −/− | − | − | RVOT | 5.4 | 353 (330–375) | 50 | 35 | 0.2 | 27 | 1.2 | 33 |
| 10/58/f | 4/+ | 400 | − | RVOT | 10.3 | NA | 25 | 41 | 0.6 | 25 | 0.8 | 23 |
| 11/40/m | 5/− | 440 | − | RVOT | 11.1 | 475 (420–525) | 36 | 40 | 3.9 | 40 | 2.5 | 35 |
| 12/35/f | 10/+ | 320 | + | LCC | NA | 440 (360–580) | 15 | 20 | 2.5 | 55 | 1.4 | 57 |
| 13/28f | 7/− | 260 | + | RVOT | 1.5 | 450 (430–485) | 36 | 28 | 3.1 | 30 | 1.6 | 70 |
| 14/78/m | 4/− | 300 | − | RVOT | 0.4 | 580 (410–615) | 52 | 45 | 2.0 | 32 | 1.0 | 50 |
| 15/56/f | 3/− | 255 | − | LCC | 4.2 | 500 (430–630) | 60 | 40 | 0.6 | 50 | 0.5 | 45 |
| 16/42/m | 6/− | 240 | − | RVOT | 0.4 | 460 (440–510) | 30 | 30 | 1.8 | 22 | 6.0 | 36 |
| 17/37/f | −/− | − | − | RVOT | 1.5 | 420 (400–440) | 21 | 25 | 6.2 | 31 | 1.4 | 24 |
| 18/34/f | 11/− | 320 | + | RVOT | 5.0 | 440 (420–450) | 28 | 24 | 2.8 | 23 | 7.8 | 25 |
| 19/48/f | 7/− | 280 | − | RVOT | NA | 370 (340–380) | 35 | 36 | 1.0 | 44 | 0.7 | 38 |
| 20/42/m | 3/− | 380 | − | RVOT | 10.9 | 420 (340–440) | 32 | 60 | 1.3 | 22 | 2.5 | 51 |
| 21/28/f | 3/+ | 250 | + | RVOT | 1.6 | 490 (480–500) | 25 | 29 | 0.4 | 40 | 1.6 | 28 |
| 22/58/m | 22/− | 245 | + | RVOT | 7.4 | 370 (340–400) | 40 | 26 | 2.4 | 36 | 1.9 | 30 |
| 23/42/f | −/− | − | − | RVOT | 1.5 | 420 (415–460) | 52 | 38 | 4.5 | 45 | 1.4 | 35 |
| 24/40/m | −/− | − | − | RVOT | 13.0 | 520 (480–720) | 10 | 25 | 0.6 | 44 | 0.5 | 45 |
| 25/37/f | −/− | − | − | RVOT | 10.0 | 590 (565–590) | 47 | 35 | 3.0 | 34 | 3.6 | 47 |
| Mean ± SD | 337 ± 88 | 9.5 ± 8.1 | 41 ± 19 | 33 ± 12 | 2.0 ± 1.5 | 37 ± 11 | 2.1 ± 1.7 | 39 ± 13 |
VPB, ventricular premature beat; VT, ventricular tachycardia; RVOT, right ventricular outflow tract; LCC, left coronary cusp; VT CL , cycle length of ventricular tachycardia; CI, coupling interval; LVP, the fragmented local potential of a sinus beat; QRS − LVP, the interval between the start of the QRS complex and the LVP; LVP vpb , the fragmented local potential of a VPB/VT; LVP/mV and LVP vpb /mV, the peak amplitude (mV) of LVP and the LVP vpb measured in the distal bipolar electrogram; LVPdur, duration of the LVP (ms) measured in the distal bipolar electrogram; LVP vpb − V, the interval between the LVP vpb and the onset of the V potential (or QRS complex); NA, non-applicable. Differences between tested variables: LVP vs. LVP vpb : P = 0.88; LVP vs. LVP vpb-dur : P = 0.60. There were no statistically significant differences between values for QRS − LVP, LVP, LVP dur , LVP vpb , LVP vpb-dur , and P vpb − QRS between patients with VPB vs. patients with VPB + VT.
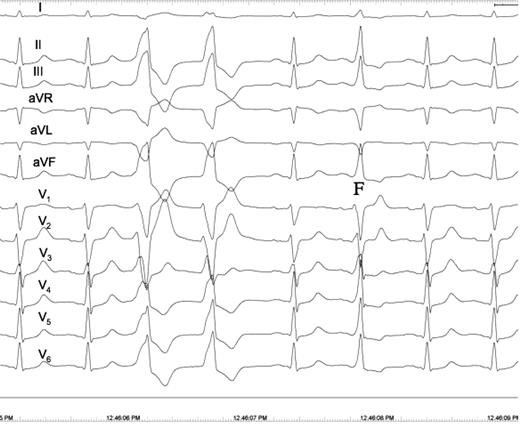
Patient 2. Twelve-lead electrocardiogram showing a pair of ventricular premature beats (VPBs) and a fusion beat (F). The frontal QRS axis of the first ventricular premature beat shows right axis deviation and a QS pattern in I. In contrast, the QRS complex of the second ventricular premature beat is the mirror-shape of the first ventricular premature beat in lead I showing a normal frontal QRS axis of 60° and a R-R′ pattern, indicating that the electrical impulse exits from the interventricular septum to the left side of the septum in the first ventricular premature beat and vice versa in the second ventricular premature beat. Another explanation for the differences in the QRS complex between the first and the second ventricular premature beat is that the second ventricular premature beat is a fusion beat most apparent in V 5 and V 6 . Notably, there is complete concordance between the QRS vector of the sinus beats and the QRS vector of the second ventricular premature beat in all 12 electrocardiogram leads.
On 24 h Holter recordings, the mean percentage of VPBs was 7.3 ± 6.8%. The coupling intervals showed a great variation, ranging from 295 to 900 ms. Fusion beats were also present in seven patients ( Table 1 , Figure 1 ).
Signal-averaging ECG (ELA Spider view) did not show late potentials in any of the cases.
The study was approved by the hospital Ethics Committee.
Electrogram analysis
Standard recording techniques (Prucka CardioLab System, GE Healthcare, Chicago, IL, USA) and ablation catheters (Celsius™ or Navistar™, Biosense Webster, Diamond Bar, CA, USA) with a 4 mm tip electrode were used except in Patient 4, where an 8 mm tip electrode was used.
The 12-lead ECG together with the intracardiac electrograms were recorded with the filtering as follows: unipolar electrograms 0.05Hz–1 kHz, bipolar electrograms 30Hz–1 kHz. High-amplitude electrograms were aimed at using a 50 Hz notch filter in the unipolar recordings. The electrode spacing was 2 mm between the bipoles, with 5 mm spacing between the distal and the proximal pairs. The following annotations, abbreviations, and measures were employed:
- S −1
last sinus beat before VPB/VT
- S −2
second last sinus beat before VPB/VT
- S −3
third last sinus beat before VPB/VT etc.
- V −1
local ventricular electrogram of the last sinus beat before VPB/VT
- V −2
local ventricular electrogram of the second last sinus beat before VPB/VT
- LVP
fragmented local potential of a sinus beat recorded at ablation site
- LVP vpb
local potential preceding the V potential of the VPB at ablation site
- LVP vt
local potential preceding the V potential of VT
- LVP vpb − V vpb
interval between the LVP vpb to the onset of the V potential (QRS) of the VPB
The criteria used for the location of optimal ablation site were the following: .
LVP vpb − V vpb of at least 10–15 ms in the distal bipolar recording with a QS pattern in the unipolar electrogram, starting simultaneously with the LVP vpb in the bipolar electrogram ( Table 1 );
concordance in10–12 ECG leads during pace mapping;
pace stimulus to the start of the paced QRS complex during pace mapping similar to LVP vpb − V vpb
Controls
Ten consecutive patients without VPBs undergoing electrophysiological investigation and/or radiofrequency ablation because of supraventricular arrhythmias served as controls. The ablation catheter was placed in the septal area in the right ventricular outflow tract (RVOT) below the pulmonary valve as close as possible to the anatomical site where the ectopic pacemaker was located in the 23 patients with VPBs originating in the RVOT. At this site, RVOT pacing with a cycle length of 500 ms was performed in order to obtain a QRS complex and QRS vector in the 12-lead ECG as similar as possible to the QRS complex of the 23 patients VPBs. When this was achieved, we used the electrograms recorded during sinus rhythm for comparison and with the same filter settings and amplification used in the 25 patients.
Statistics
Clinical data are expressed as mean ± standard deviation (SD). Normality for data was tested using the Shapiro–Wilkins test. Because all data were normally distributed with P > 0.05, the paired t -test was used to compare numerical variables where appropriate. The difference between patients with VPBs only vs. patients having VT was tested using the two-sample t -test. A significance level of 0.05 was used. All statistical analyses were performed using SAS (manufacturer and location) for Windows, version 9.1.3.
Results
At optimal ablation sites, the uni- and bipolar electrograms displayed a fragmented LVP within the V potential, appearing 10–85 ms (41 ± 19 ms) after the onset of the QRS complex in 24 of the 25 patients ( Figures 2 – 4 , 6 and 7 ). The peak amplitude of the LVP of S −1 was 2.0 ± 1.5 mV and the duration 33 ± 11 ms ( Table 1 ). In contrast, the LVP vpb was recorded for 10–52 ms (37 ± 11 ms) prior to the earliest start of the QRS complex of the V vpb . The mean amplitude and duration of the LVP vpb was not statistically different from the amplitude ( P = 0.34) and duration of the LVP ( P = 0.96). In 10 of the 24 patients, the LVP vpb showed reversed polarity compared with the polarity of the LVP ( Figures 3 , 7 and 8 ), and in the remaining 14 patients, the polarity was the same. Fusion beats were demonstrated by the recording of the LVP and LVP vpb in nine patients ( Figure 3 ). Patients who experienced VT during the procedure also showed the LVP (LVP vt ) preceding each QRS complex of the VT ( Figure 4 ). Notably, the LVP and the LVP vpb were not visible in the His bundle electrogram (HBE) in any of the patients, the electrode catheter recording the His bundle potential being only 2–4 cm apart from the ablation catheter ( Figure 5 ). Conversely, the His bundle potential was recorded on the ablation catheter in one patient only (Patient 7).
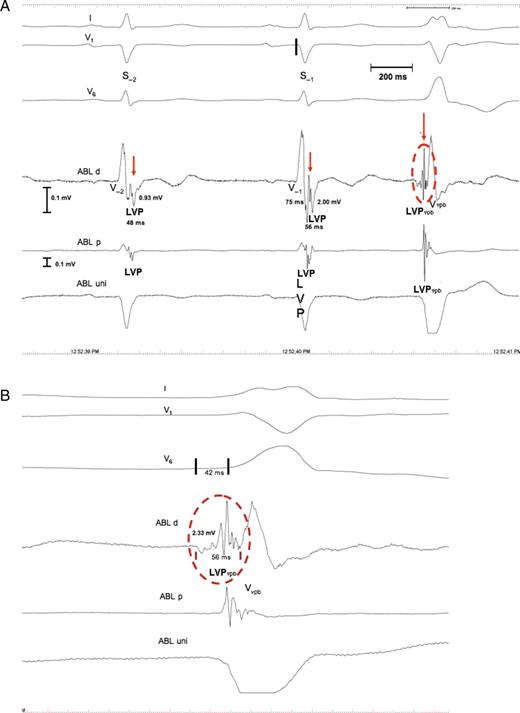
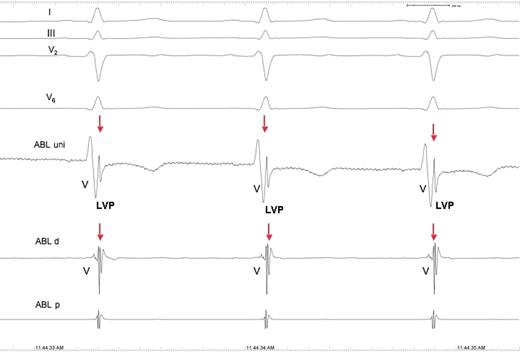
Patient 7. ( A ) Intracardiac electrograms demonstrating the local potentials, LVP and LVP vpb . Shown are: standard electrocardiogram lead I, V 1 , and V 6 . A high amplified bipolar electrogram is recorded close to the site of origin of the VPB (ABL d), together with a unipolar electrogram (ABL uni) and a bipolar electrogram from the proximal pairs of the ablation catheter (ABL p). The LVP potentials (red arrows) are recorded 75 ms after the earliest start of the QRS complexes of S −1 (black line in V 1 ). The LVP ampl is 2.00 and 0.93 mV, and the LVP dur is 56 and 48 ms in S −1 and S −2 , respectively. ( B ) Magnification of the LVP vpb (red circle). The amplitude of the LVP vpb is 2.33 mV, the duration 65 ms, and it is preceded by a slow and low-amplitude potential not present in the LVP of S −1 and S −2 . The LVP vpb starts 42 ms prior to the earliest start of the QRS complex of the VPB (black lines in V6), and the ABL uni shows no LVP vpb , due to far-field sensing of the V potential and a QS pattern indicating optimal ablation site. For further discussion, see text.
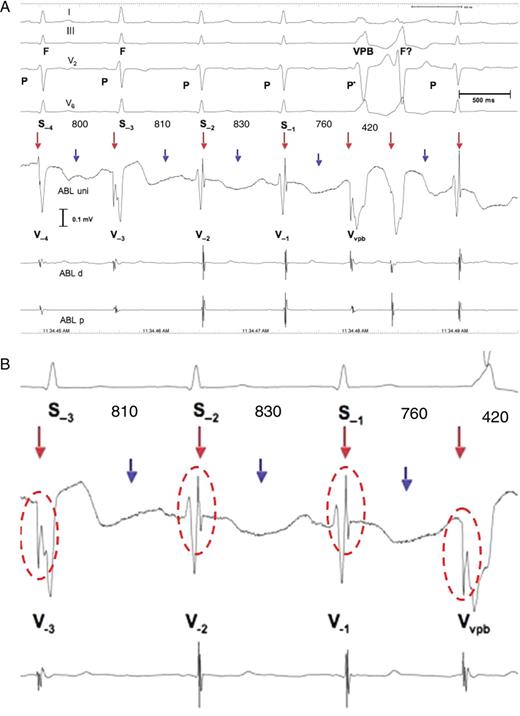
Patient 8. ( A ) Ventricular parasystole with concealed fusion and intermittent 2:1 exit block. The electrocardiogram shows apparently four sinus beats preceding a pair of ventricular premature beats. The R-wave in I and V 2 shows a higher R-wave in S −3 compared with the R-wave of S −1 , S −2 , and S −4 . The intracardiac electrograms and especially ABL uni show that only S −1 and S −2 and the beat after the pair of ventricular premature beats are sinus beats, with the LVP recorded at the end of the local V potential, whereas S −3 is a fusion beat (F), preceded by the LVP vpb (red arrows), as is S −4, but to a lesser degree than S −3 . Notably, the ventricular premature beats and fusion beatshow the LVP vpb with reversed polarity compared with the LVP of the sinus beats. In addition, the second ventricular premature beat of the pair may also be a fusion beat (F?) resulting from decremental AV conduction of the sinus impulse, i.e. the P-wave (P*), preceding the first ventricular premature beat due to concealed retrograde conduction into the AV junction of the first ventricular premature beat. Alternatively, a different exit from the ectopic pacemaker may explain the difference in the QRS complex between the two. Notably, the PR interval of the sinus beat after the pair of ventricular premature beats is prolonged compared with the PR interval of the two sinus beats before the pair of ventricular premature beats. This is probably due to concealed retrograde conduction into the AV junction of the ventricular parasystolic focus located in the high interventricular septum. The R-R interval between the pair of ventricular premature beats is 420 ms (the least common denominator); the R-R interval between S −4 and S −3 is 800 ms (400 × 2); the R-R interval between S −3 and S −2 is 810 ms (405 × 2); and the R-R interval between S −2 and S −1 is 760 ms (360 × 2). Finally, the S −1 − VPB is 760 ms (360 × 2). This is consistent with ventricular parasystole with intermittent 2:1 exit block (blue arrows). Since the intracardiac electrograms do not show local potentials associated with the blocked beats, the LVP vpb does not represent pacemaker activity, but rather slow conduction of the impulse after exiting the protected zone. ( B ) Magnification of S −3 , S −2 , S −1 , and the VPB with the LVP and the LVP vpb highlighted by red circles. Abbreviations are as in Figure 2 .
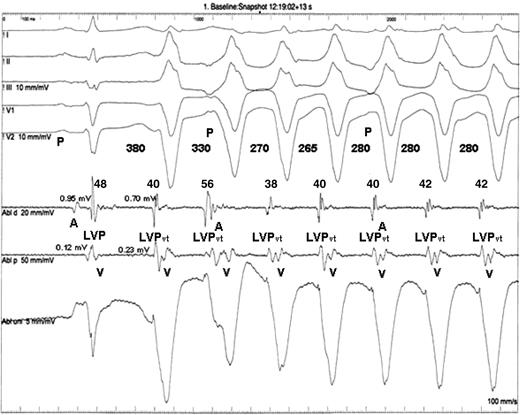
Patient 19. Non-sustained ventricular tachycardia from the right ventricular outflow tract. The coupling interval of S −1 with the first beat of the ventricular tachycardia is 380 ms, and the ventricular tachycardia cycle length stabilizes at cycle length 280 ms. The LVP vt duration is rather constant between 38 and 42 ms except for the second beat of the ventricular tachycardia where it is 56 ms. This is probably due to fusion of the LVP vt and the A potential of the sinus beat. The amplitude of the LVP in the distal pairs of the ablation catheter of S −1 is 0.95 and 0.70 mV in the LVP vt compared with 0.12 and 0.23 mV in the proximal pairs. The electrode spacing is 2 mm between the bipoles, with 5 mm spacing between the distal and the proximal pairs. For further discussion refer to the text.
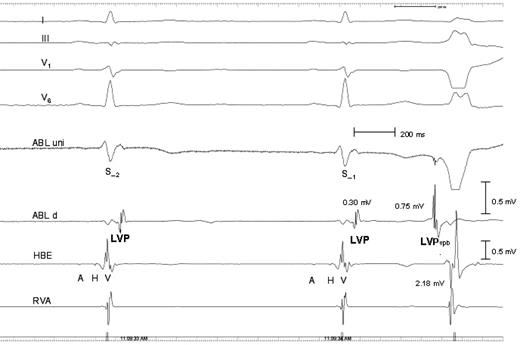
Patient 4. Intracardiac electrograms demonstrating that the LVP potential is a local potential recorded in electrograms close to the ectopic focus only. Recordings are the same as in previous figures. In addition, a His bundle electrogram is recorded 2–3 cm away from the ablation catheter located at the site of origin of the ventricular premature beats, together with a right ventricular electrogram recorded at the right ventricular apex (RVA), 5–6 cm away from ABL uni and ABL d. No LVP and LVP VPB potentials are seen in His bundle electrogram, and the amplitude of the LVP vpb is 0.75 mV compared with 2.18 mV of the V potential in the His bundle electrogram. A is atrial electrogram in the His bundle electrogram, and H is the His bundle potential.
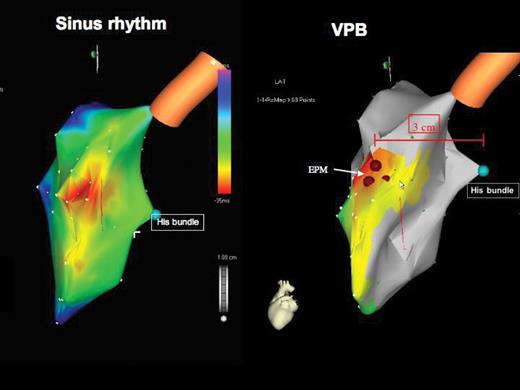
Patient 9. Electroanatomical mapping (Carto map): left lateral view looking on the interventricular septum. (To the left) Activation map during sinus rhythm. The earliest electrical activation of the QRS complex starts at the high interventricular septum (purple colour), resulting from activation of the septum via the left anterior fascicle. (To the right) Activation map of the ventricular premature beat showing the location of the ectopic pacemaker in the high interventricular septum (brown filled circles) 3 cm anterior and 1–2 cm cranial to the His bundle (green filled circle). The earliest septal activation of the ventricular premature beats starts anteriorly and cranially, compared with the earliest activation of the sinus beat. The activation spreads similarly to the sinus beat downwards the septum.
Patient 8. Intracardiac electrograms recorded after successful catheter radiofrequency ablation. The local voltage potential is still present. For comparison, see Figure 3 .
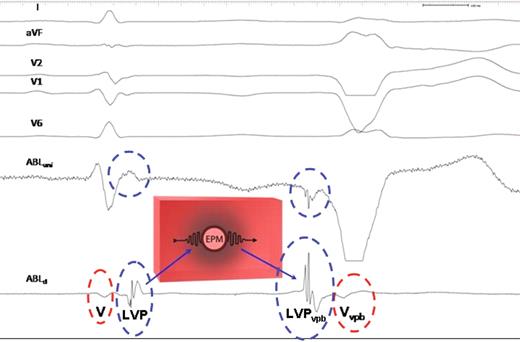
Schematic illustration of the possible explanation for the recording of local potentials. (To the left) Sinus beat. An ectopic pacemaker (EPM) is located in the high interventricular septum, surrounded by an inexcitable barrier of conduction impairment (grey shaded area). The electrical impulse of the sinus beat giving rise to the LVP (blue circle) is recorded at the end of the QRS complex, 60 ms after the onset of the local V potential (red circle), conducts slowly into the zone of depressed conductivity, and is blocked, thereby protecting the ectopic pacemaker by entrance block. (To the right) Ventricular premature beats. When the ectopic pacemaker fires, the impulse is conducted in the opposite direction through the zone of impaired conduction. This leads to the inversion of the polarity of the LVP vpb compared with the LVP of the sinus beat and the LVP vpb now precedes the local V vpb with 45 ms.
Electrical mapping and subsequent radiofrequency ablation revealed that the site of origin of the arrhythmias was in the high right interventricular septum within an area of 3–4 cm 2 in 22 of the 24 patients, whereas 2 patients (Patients 12 and 16) had the focus located in the left coronary sinus cusp. In the 24 patients in whom the LVP was recorded, the uni- and bipolar electrograms were optimal with regard to radiofrequency ablation, with a mean LVP vpb − QRS of 33 ± 11 ms, and the unipolar V vpb showing a QS pattern ( Figures 2 – 4 ). Pace mapping performed in 16 patients demonstrated concordance in at least 11 of 12 ECG leads and a pace stimulus V potential (QRS complex) interval comparable with the LVP vpb − V interval.
Activation and propagation maps using the Carto mapping system performed in 15 of the patients showed that the VPB first activated the interventricular septum below the pulmonary valve, cranially and anteriorly compared with the initial activation of the sinus beat. The impulse further propagated through the interventricular septum, similar to the activation of the sinus beat ( Figure 6 ).
Radiofrequency ablation was successful in 23 of the 24 patients in whom it was attempted. Patient 7 showed a small His bundle potential in the sinus beat at the site of potential radiofrequency ablation which was therefore avoided due to the risk of creating complete AV block by radiofrequency ablation. In another two patients, the VPBs reoccurred within 24 h. Thus, 21 out of 24 patients (88%) were cured with a mean follow-up of 1.4 years.
Importantly, the LVP was still present after radiofrequency catheter ablation in the 21 patients in whom ablation was successful ( Figure 7 ) and was not recorded in any of the 10 controls.
Discussion
The most important finding in the present study was the recording of the LVP and LVP vpb at ablation site in 24 of 25 patients with outflow tract arrhythmias. Only one patient did not disclose the potential. In this patient, we used an ablation catheter with an 8 mm tip electrode instead of a 4 mm tip which was employed in all the other 24 patients. The 8 mm tip is not ideal for the recording of local, low-voltage potentials and may explain the missing LVP potential in this patient. Thus, we were able to record the LVP in 96% of the patients studied compared with none in the control group.
In the past, several investigators have demonstrated similar LVPs in patients in whom the site of origin was above the semi-lunar valves. Thus, Timmermans et al . 9 recorded sharp local potentials similar to the LVP, and LVP vpb in five out of six patients with RVOT arrhythmias originating in the root of the pulmonary artery, indicating a muscular connection from this site to the RVOT. Tada et al . 10 found similar sharp, local potentials in 12 patients with RVOT ectopy originating above the pulmonary valve, and very recently, Srivathsan et al . 11 described discrete arterial potentials similar to ours with respect to voltage, duration, and location within the QRS complex of the sinus beats and reversion of that relationship during the ventricular arrhythmias in all of the 12 patients with outflow tract ventricular arrhythmias originating above the semi-lunar valves. They also provided evidence for the LVPs playing an active role in the arrhythmogenesis.
In this series, point-to-point contact mapping and Carto activation mapping located the ectopic pacemaker anatomically to the right interventricular septal region below the pulmonary valve within an area of ∼3–4 cm 2 ( Figure 6 ), except in two patients in whom the ectopic pacemaker was located in the left coronary cusp. Thus, the LVP and LVP vpb were demonstrated in 22 of the 23 patients with RVOT ectopy originating below the semi-lunar valves; however, we cannot rule out that the ablation catheter recorded the LVP above the pulmonary valve in some cases, since we did not perform angiography to visualize the pulmonary valve.
Characteristic 12-lead ECG patterns have been described with different arrhythmia locations. 12–14 The following 12-lead ECG patterns were present in our patients: frontal QRS axis >90° in 13 patients and 60°−90° in 12 patients, whereas in aVL, a QS pattern was present in 24 patients, which indicates that the ectopic pacemaker was located septally. 14 The septal location of the ectopic pacemaker was also supported by the alternation between the positive and the negative QRS complex in lead I, observed occasionally between VPBs and within pairs of VPBs in four of the patients. This suggests that the exit of the impulse may be changing from the left to the right side of the interventricular septum.
Triggered activity is the accepted mechanism of RVOT ectopy in humans. Kim et al . 15 evaluated a total of 127 consecutive patients with idiopathic RVOT arrhythmias with the purpose to compare and contrast the clinical and electrophysiological characteristics of outflow tract arrhythmias with special emphasis on the arrhythmia mechanism. Patients were classified according to three groups: 36 (28%) patients with sustained monomorphic VT, 46 (36%) with NSVT, and 45 (35%) with VPBs only. All the patients were investigated intensively including electrophysiological provocation, cathecholamine infusion, adenosine, and verapamil injections during VT. The principal finding of the study, also based on several previous studies from the same group, 16 , 17 was that, although patients with RVOT arrhythmias present with clinically distinct grades of ventricular ectopy and VT, the electrophysiological findings suggest that these subtypes may represent the continuum of a similar arrhythmia mechanism, i.e. cathecholeamine-mediated delayed after-depolarisations and cAMP-mediated triggered activity. Thus, almost all patients with monomorphic sustained VT demonstrated evidence of triggered activity, the same being true for 50% of the patients with NSVT. Even 5% of the patients with single VPBs were inducible for sustained VT.
In the present study, we also found evidence of another form of arrhythmia mechanism: ventricular parasystole in 10 patients. The diagnosis of ventricular parasystole was supported by the following observations: a pronounced variation of the coupling interval and fusion beats recorded by Holter monitoring or during the ablation procedure in a total of 10 patients ( Figures 1 and 3 ), allowing for the estimation of the least common denominator of interectopic R-R intervals in 7 patients ( Table 1 ).
In experimental environments, it has been shown that a ‘sine qua non’ for VPBs and ventricular parasystole is a non-excitable area of depressed conductivity, protecting the ectopic pacemaker from the sinus pacemaker by entrance block. 2–8 Owing to the entrance block, the pacemaker functions as a parasystolic focus. However, parasystolic patterns could be converted to triggered activity, and re-entrant patterns by alteration of the atrial driving rate, by electrotonic interactions occurring across the zone of impaired conductivity, causing incomplete entrance block (modulated parasystole), or by a slowing of pacemaker automaticity. In either case, the ectopic responses were the result of impaired conductivity within the tissue surrounding the ectopic focus. Reciprocation of the impulses across the inexcitable zone (entrainment) could also generate VT capable of being initiated and terminated by a single properly timed VPB. 7 These observations are in agreement with our findings that 7 of the 10 patients with ventricular parasystole also showed VPBs with a constant coupling interval, i.e. bigeminy and trigeminy for longer periods, and at other times showed varying coupling intervals with fusion. A recent experimental study also suggests that bidirectional modulated parasystole can account for VT. 18
On the basis of the above findings, we speculate that the LVP represents the area of conduction impairment, a barrier of depressed inexcitability, with the effect that the electrical impulse of sinus origin conducts slowly into the barrier and dies out, protecting the ectopic pacemaker by intermittent entrance block. The automatic pacemaker cycles within the protected zone and, when it fires, may exit the protected area by successfully conducting across the region of impaired conduction, giving rise to the LVP vpb preceding the V vpb , and most often displaying a polarity opposite from that of the LVP ( Figures 3 and 8 ). Furthermore, in Patient 8, in whom intermittent 2:1 exit block from the ectopic pacemaker occurred, the intracardiac electrograms did not disclose the LVP associated with the blocked beats ( Figure 3 ), indicating that the LVP vpb does not represent pacemaker activity itself, but rather slow conduction of the impulse after exiting the protected zone. This is supported by the fact that the pace stimulus to the beginning of the QRS complex during pace mapping at successful ablation site was similar to LVP vpb − QRS vpb . Importantly, the LVP was still recorded after successful radiofrequency ablation ( Figure 7 ), indicating that the dessication resulting from the radiofrequency energy created a permanent exit block from the ectopic pacemaker to the tissue responsible for the recording of the LVP.
The LVP was not recorded between the A potential and the V potential during sinus rhythm, ruling out that the LVPs were Purkinje potentials and thus fascicular origin of the VPBs.
Finally, phase-2 re-entry has been suggested to play a role in RVOT ectopy, and we previously demonstrated ST elevation and T-wave changes in S −1 compared with S −2 in patients with RVOT ectopy by using signal averaging of the ECG and single-beat analysis of intracardiac electrograms recorded close to the site of successful radiofrequency ablation. 19 These changes were consistent with experimental phase-2 re-entry; however, fusion beats were also recorded in several of the patients speaking in favour of parasystole as the responsible arrhythmia mechanism.
A schematic illustration of the possible arrhythmia mechanism and substrate is depicted in Figure 8 .
Conclusions
Local potentials can be recorded in the vast majority of patients with idiopathic outflow tract ectopy below and beyond the semi-lunar valves and seem to be a prerequisite for outflow tract ectopy. The local potentials facilitated successful radiofrequency ablation and may reflect an area of depressed conductivity known to be a prerequisite for experimental ventricular ectopy including parasystole.
Study limitations and future directions
There are several limitations to the present study. We did not try to record action potentials from the ectopic pacemaker. Recording of monophasic action potentials with specially designed ablation catheters could be considered in future studies.
Electrophysiological and pharmacological testing to confirm triggered activity was carried out in only seven patients and was positive in six patients. However, experimental studies have shown that normal automaticity, abnormal automaticity, and triggered activity caused by early and delayed after-depolarizations, as well as depolarization-induced automaticity, can cause ventricular parasystole if the focus is protected. 1 , 2 , 6
We did not perform electroanatomical voltage mapping to estimate the extent of the LVP; however, in none of the patients was the LVP present in the HBE, the electrode catheter recording the His bundle potential being 2–3 cm apart from the ablation catheter ( Figure 5 ). Moreover, the LVP potential was often of very low amplitude in the proximal pairs of the ablation catheter, with the bipolar only 5 mm apart from the distal pairs ( Figure 4 ).
Incremental atrial and ventricular pacing was performed in seven patients, and we observed no prolongation of the V − LVP interval or block with higher pacing rates. Performing incremental pacing or S 1 –S 2 restitution curves, de Bakker et al . demonstrated an increase in the delay in local activation time in the infarcted human heart. 20 Since we did not validate the LVP systematically, we cannot be certain that the LVP is coupled with the local V potential; however, the LVP was recorded in 24 of the 25 patients 10–85 ms within the QRS complex of sinus beats, 10–52 ms prior to the QRS complex of the VPBs including fusion beats, and the LVP was still present within the QRS complex of the sinus beats after successful radiofrequency ablation.
As stated previously, we excluded patients with arrhythmogenic right ventricular dysplasia. By electroanatomical voltage mapping, Corrado et al . 21 demonstrated fragmented low-voltage regions caused by areas of fibro-fatty myocardial replacement in 7 out of 27 patients with RVOT tachycardia and suggested that these patients represented early and minor forms of arrhythmogenic right ventricular dysplasia. The LVPs in our series may represent similar changes, but it should be noted that the LVP was also recorded above the semi-lunar valves in 2 of the 25 patients as well as in the 12 patients in the series of Srivathsan et al . 11
Other techniques like non-contact mapping and magnetocardiography may also be considered to demonstrate the area of conduction impairment. We previously demonstrated by three-dimensional magnetocardiography a difference in the dipole in S −1 compared with S −2 in a few patients with RVOT VPBs. 22
An anatomical substrate for the ectopic focus in the outflow tracts should be searched for. Hasdemir et al . 23 demonstrated ventricular myocardial extensions into the pulmonary artery and aorta beyond the ventriculo-arterial junction in 22% of normal individuals and speculated that intrinsic arrhythmogenic properties specific to those regions could play a role in patients developing outflow tract ectopy.
Finally, Boukens et al . 24 also described a developmental basis for electrophysiological heterogeneity in the ventricular and outflow tract myocardium as a substrate for ventricular arrhythmias.
Conflict of interest: P.E.B.T. has received research grants and consulting fees from Boston Scientific, Medtronic, Inc., and St. Jude Medical. P.S. has received consulting fees from ELA-Sorin, GE Medical, St. Jude Medical.
References
Author notes
Deceased.
