


Abstract
Complex fractionated atrial electrogram (CFAE) has been reported to relate to maintain atrial fibrillation (AF). The aims of this study were to investigate the relationship between CFAE and background conditions during sinus rhythm (SR).
Electroanatomical mapping using an EnSite Array was performed in 20 patients (paroxysmal AF:persistent AF = 16:4) who underwent pulmonary vein antrum isolation (PVAI). Contact bipolar electrograms were recorded before PVAI, during SR, and subsequently during induced AF. Peak-to-peak voltages and morphologies of the electrograms during SR were compared between sites with and without CFAE during AF. Among 1947 points obtained during SR, 974 (50%) were included in CFAE sites and 973 (50%) in non-CFAE sites. Electrogram amplitude during SR was higher at the CFAE sites than at the non-CFAE sites (2.4 ± 1.7 vs. 1.9 ± 1.9 mV; P < 0.0001), whereas fractionated or double electrograms were found in a similar range between the two areas (2 vs. 3%; P = 0.21). When analysed further in terms of AF termination by PVAI followed by confirmation of non-inducibility, the voltage of electrograms at the CFAE sites was lower (2.1 ± 1.7 vs. 2.6 ± 1.8 mV; P = 0.0001) and the morphology was more complex in patients without AF termination compared with those with AF termination.
Our results suggest that in paroxysmal and persistent AF with minimally damaged LA, the CFAE sites in patients with AF termination by PVAI alone represent healthy atrial tissue with rapid electrical activity in response to an AF driver located in the pulmonary vein. However, in patients without AF termination, they represent more damaged tissue responsible for maintaining AF.
Introduction
Radiofrequency catheter ablation of complex fractionated atrial electrogram (CFAE) opened a new frontier beyond pulmonary vein antrum isolation (PVAI) to eliminate persistent and longstanding persistent atrial fibrillation (AF). However, it does not always represent a successful ablation site and is also recorded in paroxysmal AF patients in whom PVAI alone could eliminate AF. Some studies have reported that CFAE was detected in >50% of the LA surface area and that ablation guided by CFAE alone was still challenging if PVAI had not been performed before CFAE ablation. 1 , 2 Some potential underlying mechanisms of CFAE have been proposed, but there has been no definitive consensus; some are related to critical mechanisms that maintain AF, whereas others are passive mechanisms that respond to fast AF drivers located elsewhere. Understanding the underlying mechanism appears to be useful for identifying meaningful sites with CFAE, where ablation leads to either a prolonged AF cycle length or AF elimination.
Besides AF substrates examined during AF (CFAE), background conditions of atrial tissue during sinus rhythm (SR) are related to AF maintenance or elimination by RF ablation. These conditions include low electrogram amplitudes recorded during SR or complex electrogram morphologies called ‘AF nests’ recorded during real-time frequency domains in SR. 3 , 4 We hypothesized that the underlying mechanism of CFAE is associated with the background conditions of atrial tissue during SR. Therefore, we investigated peak-to-peak voltages and morphologies of contact bipolar electrograms during SR and analysed these in terms of bipolar electrogram amplitude and morphology at sites with and without CFAE recorded during AF before ablation.
Methods
Patient population
The study population comprised 20 AF patients (58 ± 10 years old, 14 men) who had to undergo radiofrequency ablation of AF. There were 16 paroxysmal and 4 persistent AF patients. The definitions of paroxysmal and persistent AF were those adopted in HRS/EHRA/RCAS consensus reports. 5 All patients had symptomatic, drug-refractory AF. No patient had undergone any prior AF ablation, and one patient had an old myocardial infarction. Another patient had valvular heart disease (mitral regurgitation) and a history of mitral valvuloplasty. Transthoracic echocardiography revealed that the mean left atrial dimension was 39 ± 7 mm and the mean left ventricular fractional shortening was 40 ± 6%. Patients with severely dilated LA were excluded from the study. The maximum LA dimension in patients with persistent AF was 51 mm in this study. The mean duration of persistent AF was 9 ± 3 months, ranging from 6 to 12 months. Informed consent was obtained from all patients, and the sessions were performed under conscious sedation by intravenous administration of midazolam. All anti-arrhythmic drugs were discontinued for at least five half-lives before the electrophysiological study and ablation procedure.
Electrophysiological study and image acquisition
Standard multi-electrode catheters were positioned in the coronary sinus and right ventricular apex through the femoral veins for pacing and recording. Using the standard Brockenbrough technique, an atrial transseptal puncture was performed under fluoroscopic guidance, and a multi-electrode array (St Jude Medical, Minnetonka, MN, USA) was transseptally introduced into the left atrium (LA) through a 10-Fr-long transseptal sheath (Mullins, Medtronic, Minneapolis, MN, USA). The tip of the multi-electrode array was placed in the LA appendage (LAA). Two additional transseptal long sheaths were introduced into the LA by the standard Brockenbrough technique through which a 20-pole circular electrode catheter (Optima, St. Jude Medical) was placed at either the right or left superior pulmonary vein (PV) ostium to record PV potentials. A deflectable 7-Fr catheter with an 8-mm tip distal electrode (Fantasista, Japan Life Line, Tokyo, Japan) was also introduced into the LA and used for mapping, pacing, and ablation. Intravenous heparin was administered to maintain an activated clotting time (ACT) of more than 300 s immediately after the atrial transseptal puncture. ACT levels were monitored every 30 min; if these levels were <300 s, an adequate amount of heparin was injected to maintain an ACT of more than 300 s. The long sheaths were constantly flushed with 5–10 ml of saline every 10–15 min to avoid thrombus formation.
Contact electroanatomical mapping
Three-dimensional (3D) geometries of LAs and PVs were depicted separately using EnSite version 6.0J (St Jude Medical) and combined with each other. After the LA geometry was created, contact bipolar electrograms were recorded during SR in the LA by point-by-point recording. Thereafter, AF was induced by intravenous injection of 4–10 µg of isoproterenol or rapid pacing from the coronary sinus or high right atrium. After waiting for 15 min to stabilize AF, contact bipolar mapping was performed during AF in a similar fashion. For patients with AF at the beginning of the procedure, contact mapping during AF was performed first. Thereafter, AF was converted to SR by an intracardiac DC shock of 5–10 J to create the mapping during SR. Mapping during SR was performed after 15-min interval to avoid untoward effects by DC shock. 6 An 8-mm tip ablation catheter with 2-mm interelectrode space was used to collect bipolar electrograms. Efforts were made to obtain equally distributed mapping points throughout the LA. The LA endocardial contact of the catheter during mapping was ensured by stability of the catheter icon on the EnSite version 6.0J and fluoroscopically.
After voltage mappings were performed during both SR and subsequently induced AF, a standard quadripolar mapping catheter coated with a lubricant was inserted nasally into the esophagus under fluoroscopic guidance. The entire course of the esophagus was depicted and superimposed on the LA posterior wall. 7
Detection of CFAE
CFAE was automatically identified by a custom software included in the EnSite Array system. This software is the same as the worldwide accepted one of the EnSite NavX system. 8 The system has proved to be effective for guiding CFAE-targeted ablation. 8 The algorithm measured an average time interval between consecutive deflections over a 5-s recording period, and CFAE was defined as a complex electrogram with a mean cycle length <120 ms. 2 Each deflection was identified by a detection algorithm, the details of which are described elsewhere. 8 The mean cycle lengths of local electrograms were displayed in a colour-coded fashion on the 3D LA geometry ( Figure 1 ). Distribution of CFAE sites in the LA was analysed in six pre-determined LA areas: anterior wall, septal wall, posterior wall, inferior wall, lateral wall, and the region including the LAA. Each region was anatomically defined as follows: the posterior LA consisted of a square with the boundaries of the 4 PV ostia, the inferior LA extended from the lower aspect of the two inferior PV ostia to the inferior mitral annulus, the anterior LA extended from the LA roof line connecting both superior PVs to the superior mitral annulus, the septal LA extended from the right side of the anterior LA to the line between the two right PV ostia, the lateral LA extended from the left side of the anterior LA to the line between the two left PV ostia, and the region including the LAA was circumferentially explored. The LA and CFAE surface areas were calculated using a research segmentation software package.
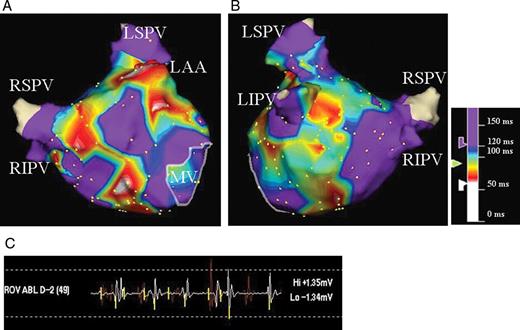
CFAE map of the LA in anteroposterior ( A ) and posteroanterior ( B ) views. Atrial electrograms during AF were analysed using an automated CFAE algorithm. The average time duration between consecutive deflections in a local electrogram over 5 s at each site was calculated; the colour-coded value for each site is displayed on the three-dimensional LA geometry. Areas coloured white and red represent areas with very rapid and/or fractionated local electrograms. Areas with mean cycle length >120 ms are coloured purple. CFAE, complex fractionated atrial electrogram; AF, atrial fibrillation; LA, left atrium; LSPV, left superior pulmonary vein; LIPV, left inferior pulmonary vein; RSPV, right superior pulmonary vein; RIPV, right inferior pulmonary vein; LAA, left atrial appendage; MV, mitral valve.
Analysis of electrograms during SR
In contact electrogram mapping during SR, electrogram amplitude was defined as the contact bipolar voltage difference between the highest and lowest deflections of each electrogram (peak-to-peak voltage). Double potentials and fractionated signals were identified as potentials with a time interval between the two deflections of >50 ms and complex activity of >50 ms duration, respectively. 9
Characteristics of electrograms recorded in the 3D voltage map collected during SR were compared between the CFAE sites and non-CFAE sites ( Figure 2 ). Further analysis regarding the electrogram characteristics during SR was performed in terms of AF persistence after PVAI or termination by PVAI.
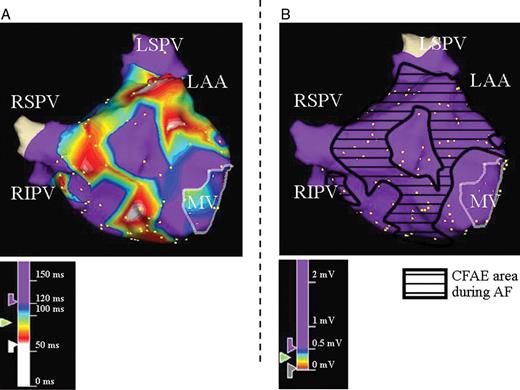
Example of electrogram analysis during SR at CFAE and non-CFAE sites during AF. Three-dimensional electroanatomical maps of the LA in anteroposterior views during AF ( A ) and SR ( B ) are shown. ( A ) CFAE map recorded during AF and ( B ) voltage map recorded during SR. The area surrounded by the black line in B indicates the CFAE sites that correspond to A . SR, sinus rhythm; other abbreviations as in Figure 1 .
Ablation procedure
Catheter ablation was performed during AF in all 20 patients using an 8-mm tip ablation catheter. Ipsilateral PVs were jointly isolated by contiguous focal lesions deployed at a distance of 1.0 cm from the PV ostium under navigation using the EnSite version 6.0J. Ablation lesions were generally created with a temperature and power limit of 55°C and 40–50 W, respectively. However, to minimize the risk of esophageal injury, the power and duration were reduced to 30 W over 20 s at the LA posterior wall sites near the esophagus.
The primary end point of the ablation procedure was complete electrical PV isolation with loss of any local PV potentials. If AF was not terminated by PVAI, additional RF application to the LA roof, mitral isthmus, and/or LA anterior lines was performed. When AF persisted after completion of these procedures, it was converted to SR by an intracardiac DC shock of 5–10 J.
Statistical analysis
Results for continuous variables were expressed as mean ± standard deviation or numbers and percentages. Differences between groups for the continuous variables were determined by ANOVA, followed by Scheffe's post hoc test. Categorical variables were compared by a χ 2 test, and a P -value <0.05 was considered statistically significant.
Results
Distribution of CFAE sites
A total of 1529 points (76 ± 22 points per patient) was equally taken in the entire LA during AF to record contact bipolar electrograms. CFAE was recorded in all patients during AF. Among these, 850 points (56%) were classified as CFAE sites and 679 (44%) as non-CFAE sites. The mean surface area of the LA was 123 ± 27 cm 2 . The mean surface area with CFAE was 54 ± 38 cm 2 , which occupied 42 ± 30% of the LA surface. CFAE distributed in the LA over the region including the LAA (20 patients, 100%), septal wall (19 patients, 95%), anterior wall (18 patients, 90%), posterior wall (16 patients, 80%), inferior wall (17 patients, 85%), and lateral wall (13 patients, 65%).
Comparison of electrogram amplitudes and morphologies during SR between CFAE and non-CFAE sites
A total of 1947 points (97 ± 23 points per patient) was taken during SR to record contact bipolar electrograms in a similar fashion during AF. Among these, 974 points (50%) were included in the CFAE sites and 973 (50%) in the non-CFAE sites. The mean amplitude of electrograms during SR was 2.1 ± 1.8 mV in all patients. The percentage of points with electrograms <0.5 mV was 8% (151 of 1947 points) and those demonstrating a complex morphology with fractionated or double potentials was 3% (53 of 1947 points) in which the percentage of points with a low and complex morphological electrogram was 19% (10 of 53 points). Electrogram amplitude during SR at the CFAE sites was significantly higher than that at the non-CFAE sites (2.4 ± 1.7 vs. 1.9 ± 1.9 mV; P < 0.0001), whereas the percentage of fractionated or double electrograms during SR was similar between the CFAE and non-CFAE sites (2 vs. 3%; P = 0.21).
Comparison of electrogram amplitudes and morphologies during SR in the CFAE sites between patients with and without AF termination by PVAI alone
In the present study, AF terminated during PVAI in 11 patients (55%) and still persisted after PVAI in the remaining 9 patients (45%). AF was converted to SR after PVAI and/or LA linear ablation by an intracardiac DC shock of 5–10 J in six of these nine patients (66%). AF was converted to SR during LA line creation after PVAI in the remaining three patients. AF terminations were associated with LA roofline creation in two patients, and LA line creation from the right superior PV to anterior LA in one patient. Electrograms during SR were compared between patients without AF termination by PVAI alone (non-term group, nine patients, 870 electrogram points) and patients with AF termination by PVAI alone (term group, 11 patients, 1077 electrogram points). The percentage of acquired points during SR was similar in each predetermined LA areas in both groups: anterior wall; non-term group 18% (157 points) vs. term-group 17% (182 points), septal wall; 23% (196 points) vs. 25% (272 points), posterior wall; 21% (187 points) vs. 23% (252 points), inferior wall; 13% (109 points) vs. 10% (106 points), lateral wall; 18% (159 points) vs. 17% (183 points), and the region including the LAA; 7% (62 points) vs. 8% (82 points), respectively.
Patient characteristics in both groups are shown in Table 1 . There were no significant differences in patient characteristics between these groups, including age, sex, AF duration, left ventricular fractionated shortening, presence of structural heart disease, or LA surface area. LA dimension revealed by transthoracic echocardiography was significantly larger in the non-term group than term group (42 ± 6 vs. 36 ± 6 mm; P = 0.04; Table 1 ). The mean LA surface area also tended to be larger in the non-term group than in the term group, although there was no statistically significant difference between the two groups (136 ± 28 vs. 113 ± 24 cm 2 ; P = 0.08; Table 1 ). In both groups of patients with persistent AF, LA diameter was not large and low-voltage zone defined as <0.5 mV was found infrequently in the LA during SR.
Patient characteristics
| Non-term group ( n = 9) | Term group ( n = 11) | P -value | |
|---|---|---|---|
| Age (years) | 56 ± 10 | 60 ± 10 | 0.45 |
| Men/women ( n ) | 6/3 | 8/3 | 0.77 |
| PAF/PeAF | 6/3 | 10/1 | 0.18 |
| AF duration (years) | 1.7 ± 1.2 | 2.0 ± 1.2 | 0.66 |
| LA dimension (mm) | 42 ± 6 | 36 ± 6 | 0.04 |
| LVFS (%) | 38 ± 6 | 41 ± 7 | 0.32 |
| Structural heart disease, n (%) | 1 (11) | 1 (9) | 0.89 |
| LA surface area (cm 2 ) | 136 ± 28 | 113 ± 24 | 0.08 |
| CFAE surface area (cm 2 ) | 54 ± 37 | 53 ± 40 | 0.95 |
PAF, paroxysmal atrial fibrillation; PeAF, persistent atrial fibrillation; LA, left atrium; LVFS, left ventricular fraction shortening; CFAE, complex fractionated atrial electrogram.
The electrograms during SR at the CFAE and non-CFAE sites were compared between the two groups ( Figure 3 ). Mean electrogram amplitude at the CFAE sites was lower in the non-term group than in the term group (2.1 ± 1.7 vs. 2.6 ± 1.8 mV; P = 0.0021), and the percentage of fractionated or double electrograms during SR was higher in the non-term group than in the term group (3 vs. 1%; P = 0.02; Figures 4 and 5 ). There were, however, no significant differences between the non-term group and term groups in the mean electrogram amplitude (1.8 ± 1.6 vs. 2.0 ± 2.1 mV; P = 0.12) and percentage of fractionated or double electrograms (4 vs. 3%; P = 0.39) during SR at the non-CFAE sites. Irrespective of AF termination, mean electrogram amplitudes in the CFAE sites were higher than those in the non-CFAE sites although the mean amplitudes at the non-CFAE sites were similar between patients with and without AF termination.
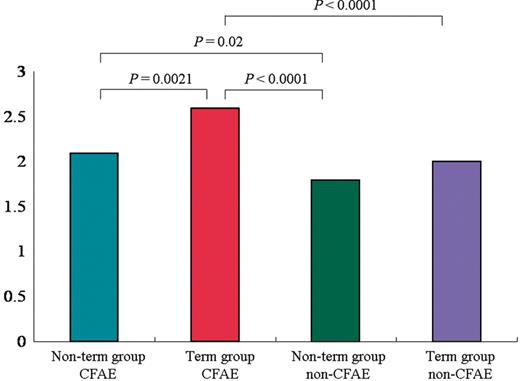
Electrograms amplitude during SR at CFAE and non-CFAE sites in the two groups. Mean electrogram amplitude at the CFAE sites was lower in the non-term group than in the term group ( P = 0.0021). There were no significant differences in the mean electrogram amplitude ( P = 0.12) during SR at the non-CFAE sites between the non-term group and term groups. SR, sinus rhythm; other abbreviations as in Figure 1 .

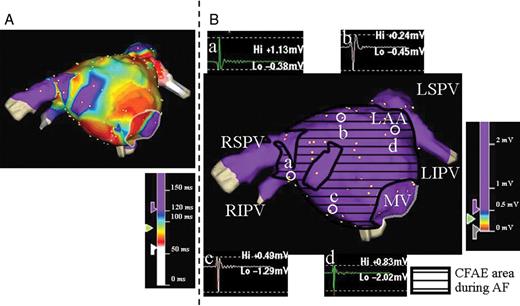
Three-dimensional electroanatomical maps of the LA in anteroposterior views during AF ( A ) and SR ( B ) in a patient from non-term group. ( A ) CFAE map of the LA; the CFAE sites are distributed throughout the LA. ( B ) Voltage map during SR with sample bipolar atrial electrograms. The area surrounded by the black line in B indicates the CFAE sites that correspond to A . In this case, a low-voltage electrogram (<0.5 mV) was recorded during SR at sites a and b, where CFAE was recorded during AF, whereas the electrograms at sites c and d are thought to be normal. The electrogram at site a is fractionated. SR, sinus rhythm; other abbreviations as in Figure 1 .
Three-dimensional electroanatomical maps of the LA in anteroposterior views during AF ( A ) and SR ( B ) in a patient from the term group. ( A ) CFAE map of the LA. ( B ) Voltage map during SR with sample bipolar atrial electrograms. The area surrounded by the black line in B indicates the CFAE sites that correspond to A . The amplitudes and morphologies of the electrograms at sites a, b, c, and d are thought to be normal. There was no low-voltage electrogram in the LA during SR in this case. SR, sinus rhythm; other abbreviations as in Figure 1 .
Discussion
Main findings
First, the mean electrogram amplitude during SR was higher at the CFAE sites than that at the non-CFAE sites, whereas the percentage of abnormal electrograms with complex morphologies, including fractionated or double electrograms, were similar between the CFAE and non-CFAE sites in patients with paroxysmal or persistent AF. Second, the amplitudes and the morphologies of the electrograms at the CFAE sites were lower and more complex in patients without AF termination than in those with AF termination by PVAI alone, although mean amplitudes of the electrograms at the CFAE sites were higher than those at the non-CFAE sites, irrespective of AF termination by PVAI alone.
The relationship between CFAE and substrates for maintaining AF
CFAE has been defined as a continuous atrial electrogram or an electrogram with a short cycle. It has been suggested to be the substrate for maintaining AF. 1 , 2 , 10 Nademanee et al . 10 proposed a new ablation strategy that targeted CFAE for AF ablation. They reported that CFAE-guided RF ablation frequently terminated AF, and a higher success rate was achieved during a long-term follow-up. 10
Several researchers have reported some potential mechanisms leading to CFAE, in which CFAE identifies sites with conduction disturbance, including slow conduction, functional conduction block, and anchor points for reentry circuits. 11 , 12 On the other hand, CFAE might represent passive or bystander activation, including anisotropic conduction, summation of activation of different overlapping myocardial layers, fibrillatory conduction, and wave break occurring far from the core of the rotor. In such cases, CFAE-guided RF ablation may fail to eliminate AF. 13
Comparison of electrograms during SR between CFAE and non-CFAE sites
Some studies have reported that CFAE was detected at >50–80% of the LA surface area, and the distribution of CFAE has been reported to remain relatively constant, 1 , 2 , 10 which was reconfirmed in the present study. The broad distribution of CFAE over the entire LA suggests that CFAE does not always identify successful sites for AF ablation. More appropriate characterization of electrograms is required to improve the specificity of CFAE for identifying sites critical to AF perpetuation.
In the present study, electrogram amplitude during SR at the CFAE sites was higher than that at the non-CFAE sites, whereas the percentages of fractionated or double electrograms during SR were similar between the CFAE and non-CFAE sites. These findings suggest that a large amount of myocardium in the CFAE sites includes relatively healthy atrial myocardium as a background and that CFAE does not always represent diseased atrial myocardium in the LA. In general, such a diseased part in the cardiac chamber usually plays an important role in initiating or maintaining secondary tachycardia associated with organic heart disease, such as ventricular tachycardia associated with an old myocardial infarction or atrial tachycardia associated with previous open heart surgery, in which a critical activation pathway or tachycardia focus is involved in the diseased part of the myocardium.
Comparison of electrograms during SR between patients with and without AF termination by PVAI alone
Oakes et al . 3 recently reported that the AF recurrence rate was high after PVAI alone in patients with a low-voltage zone in the LA body, suggesting that a low-voltage zone in the LA served as the substrate for AF initiation and/or perpetuation. Chang et al . 14 reported that the patients with lower LA voltages had a higher recurrence rate after AF ablation. AF termination during PVAI alone followed by non-inducibility suggests that the substrate for AF perpetuation was not located in the LA body but confined to the PV. In contrast, AF persistence after PVAI suggests that the substrate for maintaining AF is present in the LA. 15 , 16
Therefore, we compared electrogram amplitudes and morphologies during SR in the CFAE sites between patients in whom AF termination and subsequent non-inducibility were achieved by PVAI alone and those in whom AF termination was not achieved by PVAI alone. In patients without AF termination, the electrogram amplitude in the CFAE sites was lower and the percentage of abnormal electrograms with complex morphology was higher compared with the amplitude and morphology in patients with AF termination by PVAI alone. The electrogram amplitudes and morphologies were similar at the non-CFAE sites, irrespective of AF termination by PVAI alone. These findings suggest that a more electrically impaired atrial substrate is likely to be involved at the CFAE sites in patients without AF termination compared with those with AF termination by PVAI alone.
In this study, electrogram amplitude was higher in the CFAE sites than in the non-CFAE sites, irrespective of AF termination by PVAI alone. The reason is unclear, but some speculations can be made. Non-CFAE site in patients without AF termination may act as conduction barriers, whereas CFAE sites act as main places for maintaining rapid AF activation. Furthermore, both a rapid firing driver and the surrounding relatively healthy tissue with passive activation responding to the fast activating driver may coexist within the same CFAE site.
We performed AF ablation in patients with persistent AF, in whom LA diameter was not large and low-voltage zone defined as <0.5 mV was found infrequently in the LA during SR, which might have influenced the results. Patients with persistent AF in this study might be considered to have persistent AF with minimally damaged LA.
Genesis of a low-amplitude electrogram
A low-voltage electrogram represents electrical and/or structural damage of atrial tissue. It arises from diverse mechanisms, but atrial fibrosis has been proposed as one of the main causes of a low-voltage electrogram. 15 , 17 Histological examinations of the LA have shown increased amount of atrial fibrosis in patients with AF compared with control subjects. 18 It was also reported that atrial fibrosis contributed to AF induction by burst or premature atrial pacing. 19 Atrial fibrosis separates atrial myocytes, thus causing conduction disturbances. Atrial fibrosis seems to increase conduction heterogeneity in addition to localized conduction delay. 20 Amyloidosis, inflammation, fat infiltration, and degeneration were also reported to be related to a low-voltage electrogram. 21 In addition, anatomical, histological, and functional factors such as reduced function of IkAch (Ach-sensitive K channel) were reported to contribute to a low-voltage electrogram. 22
Limitations
Electrogram analysis in this study was limited to the LA; the right atrium was not included. However, CFAE in the right atrium has been considered less important for AF perpetuation but related to AF maintenance only if the mean cycle length of AF in the right atrial appendage is shorter than that in the LA. 23 In this study, the automatic algorithm measured an average time interval between consecutive deflections over a 5-s recording period. 8 We cannot address the question of whether temporal variations of CFAE may occur. The number of mapping points was relatively small, and CFAE mapping was not performed in the coronary sinus, which may have influenced the results. But these sampling points covered the entire LA with an interpolation of 10 mm which was similar to that reported by some previously published studies. 24 , 25 The purpose of this study was to clarify the mechanism of CFAE in the LA body in comparison to electrograms during SR. We excluded points within the PVs from the electrogram analyses during SR and AF, although we did sample some points within the PVs and superimposed them on the LA geometry in order to define the CFAE border which was sometimes located near the PV antrum. Electrogram comparison was made only in the LA body during SR and AF. Peak-to-peak voltages and morphologies of the electrograms during SR were compared with sites with and without CFAE during AF in this study; however, the same recording sites were not sampled during both SR and AF. Since each mapping procedure was performed with an interpolation of 10 mm, and the estimated distance between the recording sites during AF and those during SR was <10 mm, which we believe to make sense in the correlation between the electrogram during SR and during AF. A 4-mm tip electrode might be more appropriate for sensing and analysing bipolar signals than an 8-mm tip electrode. However, we selected an 8-mm tip bidirectional ablation catheter to optimize RF energy delivery to the LA endocardium. Catheter tip orientation relative to the endocardium is an influencing factor in recording contact bipolar electrogram. The AF induction protocol was inconsistent in this study, which may have influenced the results. Furthermore, the number of patients in this study was relatively small. Further study with a larger population is required to detail the underlying mechanisms of CFAE.
Conclusions
Our results suggest that in paroxysmal and persistent AF with minimally damaged LA, the CFAE sites in patients with AF termination by PVAI alone represent healthy atrial tissue with rapid electrical activity in response to an AF driver located in the PV, whereas they represent more damaged tissue responsible for maintaining AF in patients without AF termination by PVAI.
Conflict of interest: T.T. has served as a speaker and consultant for Nihon Kohden and St Jude Medical.
