


Abstract
Myocardial excitability is known (amongst other reasons) to be related to the degree of ischaemia, contractile dysfunction and heart failure. It was hypothesized that the right ventricular (RV) stimulation threshold has prognostic value with respect to the occurrence of ventricular arrhythmias (VAs) and patient survival in recipients of an implantable cardioverter defibrillator (ICD).
Ischaemic heart disease patients receiving an ICD at Leiden University Medical Center as primary prevention for sudden cardiac death were included in this study. Right ventricular thresholds were determined at ICD implant. Data were collected on VAs triggering ICD therapy and on all-cause mortality. A total of 689 consecutive patients were included (87% male, age 63 ± 11 years, left ventricular ejection fraction (LVEF) 29 ± 11%) and followed for a median of 28 months. Post-implant RV-threshold was 0.7 ± 0.5 volt (V) at 0.5 ms pulse duration. Best dichotomous separation was reached at a cut-off of 1 V. During follow-up, 167 (24%) patients received appropriate ICD therapy, 88 (13%) had appropriate shocks and 134 (19%) died. Cumulative appropriate shock incidence for patients with RV threshold ≥1 V (n = 166) was 16% at 1 year, 24% at 3 years and 34% at 5 years compared with 4, 11 and 17% for patients with an RV-threshold <1 V (n = 523). Adjusted hazard ratio of RV threshold ≥1 V was 2.0 (95% CI: 1.4–2.9) for appropriate therapy, 3.3 (95% CI: 2.0–5.4) for appropriate shocks and 1.6 (95% CI: 1.1–2.5) for mortality.
The RV stimulation threshold at ICD implant has a strong independent prognostic value for the occurrence of VAs triggering appropriate ICD therapy, appropriate shocks and mortality.
Introduction
Following the results of several large randomized trials, current guidelines for prevention of sudden cardiac death (SCD) advocate implantation of an implantable cardioverter defibrillator (ICD) in patients with a low left ventricular ejection fraction (LVEF) without a prior life-threatening ventricular arrhythmia (VA).1–5 This strategy has led to an increasing number of ICD implantations in recent years and currently, a low LVEF is still the most effective and consistent parameter used to select patients at risk of SCD.6–9 However, the rate of VAs, triggering appropriate device therapy is relatively low (35–40%)10 in this group of patients, warranting better risk-stratification for ICD implantation.
As the structure of cardiac tissue is affected by the pathological processes of infarction and subsequent fibrosis, the electrophysiological properties of the myocardium are altered significantly.11–13 The changes in cardiac tissue structure caused by myocardial infarction may increase the risk of ventricular arrhythmias (VAs) to occur. Furthermore, these changes may increase the myocardial excitability threshold.11–13 Consequently, an increased excitability threshold may reflect an increased risk of VAs.
In the current study, it was hypothesized that alterations of myocardial excitability caused by ischaemic heart disease and reflected in part by changes in the stimulation threshold, may be of clinical use as a risk parameter for VAs in primary prevention ICD patients.
Methods
Patients and protocol
Since 1996, all patients who received an ICD system in the Leiden University Medical Center were prospectively documented in the departmental Cardiology Information System (EPD-Vision®, Leiden University Medical Center). Patients included in this study received an ICD between 1999 and 2007. Characteristics at baseline, data of the implant procedure, and data of all follow-up visits were recorded. For the current study, only patients with ischaemic heart disease and a primary indication for defibrillator implantation were evaluated. We excluded patients with congenital structural, monogenetic heart disease, or non-ischaemic heart disease for the present analysis. Furthermore, patients without a documented RV threshold at implant were excluded for the present analysis.
Eligibility for ICD implantation in this population was based on international guidelines for the prevention of sudden cardiac death which, due to evolving guidelines may have changed over time. In the majority of patients, indication for an ICD was based on a depressed LVEF with or without non-sustained ventricular tachycardia. Ischaemic heart disease was defined as a history of myocardial infarction (presence of an unstable coronary lesion on angiography and/or the elevation of cardiac biomarker(s) above normal levels), or a history of significant coronary artery disease (an angiographically estimated diameter stenosis of at least 50% in at least one coronary artery and exercise-induced myocardial ischemia/perfusion defect) that resulted in coronary revascularization.
ICD implantation
All defibrillator systems used were implanted transvenously without thoracotomy. The right ventricular lead was positioned in the right ventricular apex near the septum and adjustments, if necessary, were made to achieve an optimal pacing threshold. During the implant procedure, standard testing of sensing and pacing thresholds and defibrillation threshold testing was performed. Used systems were manufactured by Biotronik (Berlin, Germany), Medtronic (Minneapolis, MN, USA), Boston Scientific (Natick, MA, USA, formerly CPI, Guidant (St. Paul, MN, USA) and St. Jude Medical/Ventritex (St. Paul, MN, USA).
In this primary prevention patient cohort, defibrillators were programmed as follows: a monitor zone was programmed in all patients to detect VAs >150 bpm. No therapy was programmed in this zone. Ventricular arrhythmiass >188 bpm were initially attempted to be terminated with two bursts of antitachycardia pacing (ATP) and, after continuation of the arrhythmia, with defibrillator shocks. In the case of a VA >210 bpm, device shocks were the initial therapy. Furthermore, atrial arrhythmia detection was set to >170 bpm with supraventricular tachycardia (SVT) discriminators enabled. Settings were adapted, only when clinically indicated (i.e. hemodynamic well-tolerated ventricular tachycardia at high rate; ventricular tachycardia in the monitor zone). The stimulation threshold was determined by automatic decrementation of the stimulus voltage at constant pulse duration of 0.5 ms after implant.
Follow-up and endpoints
All patients visited the clinic for follow-up assessments every 3–6 months. Patients were followed up to February 2009. At each patient visit, a trained device specialist or cardiologist performed device interrogation and determined sensing, pacing thresholds, and lead impedance.
The primary endpoint was VA triggering appropriate defibrillator therapy (ATP or shock) or appropriate shock only. Secondary endpoint was all-cause death.
ICD evaluation
All printouts were checked for appropriate and inappropriate ICD therapy (ATP or shocks). Therapies were classified as appropriate when they occurred in response to ventricular tachycardia (VT) or ventricular fibrillation (VF) and as inappropriate when triggered by sinus or SVT, T-wave oversensing, or electrode dysfunction. Cutoff rate of the monitor or first therapy zone was noted.
Statistical analyses
Continuous data are expressed as mean (±standard deviation) or as median (25th/75th percentile); dichotomous data are presented as numbers and percentages. Differences at baseline were tested for statistical significance using a chi-square test using Yate's correction or student t-test for independent samples where appropriate. Event rates over time were analysed by method of Kaplan–Meier with corresponding log-rank test for differences in distribution between the curves. Since follow-up was performed every 3–6 months, patients without data in the past 6 months were censored at the date of their last visit.
We used multivariable Cox regression analyses to assess the association between stimulation threshold and VAs independent of an increasing number of other risk factors including age, gender, cardiac resynchronization therapy, LVEF, history of atrial fibrillation/atrial flutter, use of amiodarone, use of beta-blocker, use of sotalol, and anterior-, lateral-, inferior- and posterior MI as potential confounders. Hazard ratio (HR) is reported with the corresponding 95% confidence interval (CI). All tests were two-sided, a P-value of <0.05 was considered statistically significant. Missing values of all the variables were seen only for the variable atrial fibrillation/atrial flutter in <0.3% (n = 2/689) of all patients. The regression models were done on the patients without missing values.
A receiver operating characteristic (ROC) curve analysis was used to measure the ability of the RV threshold to discriminate between patients that received appropriate therapy and patients that did not.
Results
Patient population
A total of 1086 consecutive ICD recipients with a primary prevention indication were registered in the electronic database system. Fifty patients (5%) were excluded due to incomplete follow-up data, 332 patients (31%) due to non-ischaemic heart disease, and 15 patients (1%) due to non-documented baseline RV-threshold measurements. The remaining 689 patients were included in the present analysis and followed for a median 28 months (interquartile range (IQR): 16–46 months).
The majority of patients (87% male, 63 ± 11 years, LVEF 29 ± 11%) had a history of myocardial infarction (84%) or coronary revascularization procedure (PCI 28%, CABG 43%) (Table 1). Median RV threshold was 0.5 V (IQR: 0.5–0.8 V) at 0.5 ms pulse duration. Receiver operating characteristic curve analysis of the RV threshold suggested that a cutoff of 1 V provided the best clinically useful dichotomous separation for assessment of the primary endpoint. A RV stimulation threshold ≥1 V was observed in 166 (24%) patients. An equal distribution of lead types were used in both the RV threshold >1 V group and the RV threshold <1 V group (P = NS). There was not a significant difference between the groups in the use of any particular lead type (not shown).
Baseline characteristics
| All patients (n = 689) | RV threshold <1 V (n = 523) | RV threshold ≥1 V (n = 166) | P-value | |
|---|---|---|---|---|
| Male sex | 600 (87) | 459 (88) | 141 (85) | 0.35 |
| Age (years) | 63 ± 11 | 63 ± 11 | 63 ± 11 | 0.81 |
| Hypertension | 318 (46) | 239 (46) | 79 (48) | 0.72 |
| Diabetes | 176 (26) | 130 (25) | 46 (28) | 0.40 |
| Smoking | 151 (22) | 118 (23) | 33 (20) | 0.50 |
| Prior myocardial infarction | 578 (84) | 436 (83) | 142 (86) | 0.55 |
| Anteriora | 304 (53) | 237 (54) | 67 (47) | 0.13 |
| Inferiora | 161 (28) | 112 (26) | 49 (35) | 0.043* |
| Laterala | 76 (13) | 54 (12) | 22 (16) | 0.32 |
| Posteriora | 49 (9) | 36 (8) | 13 (9) | 0.76 |
| Prior PCI | 192 (28) | 145 (28) | 47 (28) | 0.92 |
| Prior CABG | 296 (43) | 226 (43) | 70 (42) | 0.86 |
| Hypercholesterolemia | 463 (67) | 364 (70) | 99 (60) | 0.051 |
| Family history of CAD | 300 (44) | 220 (42) | 80 (48) | 0.21 |
| Atrial fibrillation/flutter documented | 170 (25) | 123 (24) | 47 (28) | 0.26 |
| QRS width | 126 ± 34 | 125 ± 34 | 130 ± 34 | 0.10 |
| Creatinine clearance (mL/min) | 78 ± 35 | 78 ± 32 | 77 ± 43 | 0.70 |
| Ejection fraction | 29 ± 11 | 29 ± 10 | 29 ± 13 | 0.90 |
| Cardiac resynchronization therapy | 335 (49) | 263 (50) | 72 (43) | 0.13 |
| Medication | ||||
| Beta-blocker | 425 (62) | 345 (66) | 80 (48) | <0.001* |
| Sotalol | 75 (11) | 47 (9) | 28 (17) | 0.006* |
| ACE inhibitor/ATII antagonist | 580 (84) | 443 (85) | 137 (83) | 0.54 |
| Diuretics | 502 (73) | 375 (72) | 127 (77) | 0.27 |
| Statin | 560 (81) | 426 (82) | 134 (81) | 0.82 |
| Aspirin | 332 (48) | 255 (49) | 77 (46) | 0.76 |
| Oral anticoagulation | 400 (58) | 304 (58) | 96 (58) | 1.00 |
| Amiodarone | 110 (16) | 70 (13) | 40 (24) | 0.002* |
Values are expressed as n (%) or as mean ± standard deviation.
aPatients could fall into more than one infarction location category (i.e. anterolateral, inferoposterior infarction).
*P < 0.05.
Baseline characteristics distributed according to RV threshold are reported in Table 1. With the exception of infarct localization [higher number of inferior wall infarctions in the >1 RV threshold group (P = 0.04)] baseline characteristics were similar.
Cardiac resynchronization therapy was combined with the defibrillator device in ∼50% of cases of either group (RV threshold <1 V: 50%, RV threshold ≥1 V: 43%; P = 0.13). Concerning the use of drugs: patients with a higher threshold more often used sotalol and amiodarone than patients with a threshold <1 V. Patients with lower threshold more often used beta-blockers. The use of other drugs was similar in both groups.
Device therapy
During follow up, a total of 1615 episodes of VA were appropriately terminated by the ICD in 24% (n = 167) of patients either by ATP or by shock delivery. A total number of 278 shocks were delivered appropriately by the ICD in 13% (n = 88) of patients. Furthermore, 68 patients (10%) experienced inappropriate shocks. Figure 1 shows the distribution over time of first appropriate therapy and shocks for the total patient cohort.
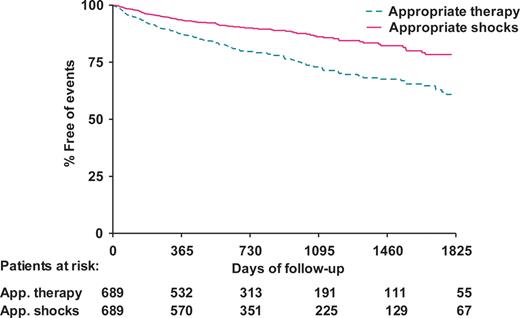
Kaplan–Meier plot of cumulative incidence of first appropriate implantable cardioverter defibrillator therapy and appropriate shocks in the total study population. App, appropriate.
Appropriate therapy during follow-up occurred more often in patients with an RV threshold ≥1 V (37%, 62 of 166 patients) when compared with patients with an RV threshold <1 V (20%, 105 of 523 patients). Furthermore, the number of patients that experienced appropriate ICD shocks was more than three times higher in the group with a RV threshold ≥1 V (26%, 43 of 166 patients) than in the group with a RV threshold <1 V (9%, 45 of 523 patients).
Figure 2 illustrates the time course of first appropriate therapy (panel A) and for first appropriate shocks (panel B) for patients with a RV threshold <1 V and a RV threshold ≥1 V. A significantly higher cumulative incidence of first ICD therapy and shocks was observed in the group with a RV threshold ≥1 V. Cumulative appropriate shock rate for patients with a RV threshold ≥1 V was 16% (95% CI: 10–22%) at 1 year, 24% (95% CI: 17–31%) at 3 years and 34%(95% CI: 24–43%) at 5 years compared with 4% (95% CI: 2–5%) at 1 year, 11% (95% CI: 7–14%) at 3 years and 17% (95% CI: 12–23%) at 5 years for patients with an RV threshold <1 V (log-rank P < 0.001).
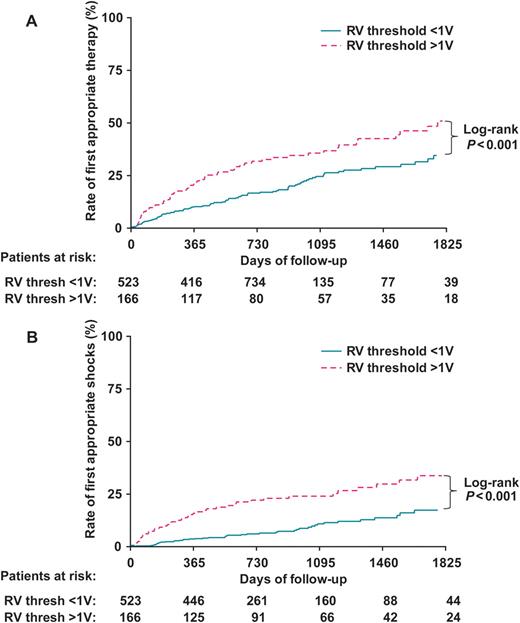
(A) Kaplan–Meier plot of cumulative incidence of first appropriate ICD therapy. (B) Kaplan–Meier plot of cumulative incidence of first appropriate ICD shocks. RV, right ventricular; Thresh, threshold; other abbreviations as in Figure 1.
Post-implant RV threshold ≥1 V was found to be an independent and significant predictor of first appropriate ICD therapy (adjusted HR Model 3: 2.0, 95% CI: 1.4–2.9) and appropriate shocks (adjusted HR Model 3: 3.3, 95% CI: 2.0–5.4) after correcting for other potential confounders as listed (Table 2).
With higher measurements of the RV threshold, the percentage of patients experiencing appropriate shocks increased. The area under the ROC curve for RV threshold was significantly >0.5 (area under ROC curve 0.7; 95% CI: 0.6–0.7; P < 0.001). A high specificity was observed at a cut-off value around ≥1 V [specificity 80% (95% CI: 76–83%)] at the expense of sensitivity [49% (95% CI: 38–60%)]. The negative predictive value of the RV threshold cut-off value of 1 V was 91%.
Mortality
One-hundred and thirty-four (19%) patients died during the follow-up period. Total mortality in patients with an RV threshold ≥1 V (28%, 47 of 166 patients) was higher compared with the group of patients with an RV threshold <1 V (17%, 87 of 523).
Cumulative survival (%) for the two study groups is displayed in Figure 3. A trend exists toward decreased patient survival in the patient group with a RV threshold ≥1 V. Cumulative survival in this group is 90% (95% CI: 86–95%) at 1 year, 78% (95% CI: 72–85%) at 3 years, and 70% (95% CI: 61–78%) at 5 years, compared with 94% (95% CI: 92–96%) at 1 year, 81% (95% CI: 77–85%) at 3 years, and 73% (95% CI: 67–79%) at 5 years in the group with an RV threshold <1 V. The log-rank test for this difference was not statistically significant (P = 0.12).
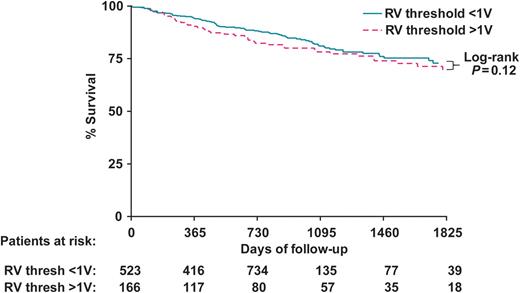
Kaplan–Meier plot of cumulative incidence of death. Abbreviations as in Figure 2.
However, post-implant RV threshold ≥1 V was found to be an independent and significant predictor of mortality after correcting for potential confounders as listed in Table 2. After adjustment the mortality rate was 60% higher among those with RV threshold ≥1 V as compared to patients with RV threshold <1 V (adjusted HR Model 3: 1.6, 95% CI: 1.1–2.5) (Table 2).
Multivariable Cox regression analyses
| RV threshold <1 V (n = 523) | RV threshold ≥1 V (n = 166) | Unadjusted HR (95% CI) | Adjusted HR (95% CI) | |||
|---|---|---|---|---|---|---|
| Model 1 | Model 2 | Model 3 | ||||
| Appropriate therapy | 105 (20) | 62 (37) | 1.8 (1.3–2.5) | 2.0 (1.4–2.9), P < 0.001 | 2.0 (1.4–2.8), P < 0.001 | 2.0 (1.4–2.9), P < 0.001 |
| Appropriate shocks | 45 (9) | 43 (26) | 2.9 (1.9–4.4) | 3.3 (2.0–5.3), P < 0.001 | 3.1 (1.9–5.2), P < 0.001 | 3.3 (2.0–5.4), P < 0.001 |
| All-cause mortality | 87 (17) | 47 (28) | 1.3 (0.9–1.9) | 1.7 (1.2–2.6), P = 0.007 | 1.6 (1.1–2.4), P = 0.028 | 1.6 (1.1–2.5), P = 0.021 |
Values are expressed as n (%), or as HR, hazard ratio (95% CI, confidence interval).
Model 1, adjusted for age, gender, cardiac resynchronization therapy, LVEF and inferior infarction. Model 2, additionally adjusted for beta-blocker-, sotalol- and amiodarone treatment. Model 3, additionally adjusted for anterior MI, lateral MI and posterior MI and history of AF/AFL.
Discussion
In this cohort of ICD treated patients with ischaemic heart disease and a primary prevention indication for ICD treatment, a post-implant right ventricular stimulation threshold ≥1 V was independently associated with (i) a higher occurrence of VAs triggering appropriate therapy, (ii) a three-fold higher occurrence of VA triggering appropriate shocks and (iii) a 60% higher risk of mortality compared with patients with a threshold <1 V.
Risk stratification for SCD
Left ventricular function is an established indicator for an increased risk of SCD.6–8 Results of a series of randomized trials have resulted in a rise in the number of ICD implantations due to a great expansion in the indications for primary prevention ICD use.1,3–5 However, the relatively low percentage of ICD patients who receive appropriate therapy (35–40% of patients in MADIT II and SCD-Heft)1,10 suggested a considerable risk heterogeneity in the low LVEF population. This has prompted a series of studies and secondary analyses from the major ICD trials in an attempt to identify factors that can be used to stratify patients with reduced LVEF into high- and low-risk subgroups.14–22 Given the complexity and limitations of some of these proposed stratification strategies, the RV stimulation threshold is a relatively easy to use, straightforward prognostic and, more importantly, electric measure of arrhythmic risk. It may assist clinicians in identifying ICD-treated patients at high risk of receiving appropriate ICD therapy and a higher risk of death, therefore facilitating better evaluation of the prognosis post-implant. The present study cannot provide an answer as to the value of the stimulation threshold as a pre-implant risk stratifier, it suggests only that the baseline stimulation threshold may enable some prognosis prediction post-implant, and may assist in guiding perhaps the medication regime or the frequency of outpatient visits especially for the group below the cutoff of 1 V as the negative predictive value was 91%. Obviously such a cutoff value should be treated just like any other ‘superficial’ cutoff measure (like, for example an LVEF of 35% calculated by biplane echo). Common sense and personal and professional judgment is indispensable in solving such dilemmas.
In order to get to the stage of clinical usefulness, the pacing thresholds should be determined in a standardized prospective fashion utilizing MRI data in order to draw definite conclusions about the optimal cutoff, or perhaps range, with its associated arrhythmic risk groups.
Ischaemic heart disease, poor excitability and arrhythmogenesis
Prior myocardial infarction leaves a residue of poorly excitable cardiac tissue. Findings from a canine study suggested that disruptions in cell-to-cell electrical continuity may contribute to slow conduction in the infarcted region.12 In later experiments, a persistent reduction of the space constant existed in chronically infarcted canine myocardium 5–8 days after persistent occlusion and reperfusion, which is directly related to slow conduction velocity.13 The investigators hypothesized that these alterations were due to a depression in action potential depolarization, an increase in internal axial resistance (by modification of the low resistance gap junctions, therefore increasing anisotropy) and an increase in the axial resistance of the extracellular space (due to the fibrotic matrix in which surviving cells are distributed within the mottled infarcted myocardium). Furthermore, wavefront-obstacle interactions in a poorly excitable medium may reflect an arrhythmogenic process that permits formation of separate new wavelets, which in vivo may lead to flutter, fibrillation, and sudden cardiac death.23
Arrhythmias leading to sudden cardiac death are often associated with the presence of inhomogeneities (obstacles) in cardiac tissue and reduced excitability of cardiac cells. Observations of fast arrhythmias in a medium of reduced excitability, combined with medium inhomogeneities provide a substrate for formation of multiple wavelets leading to high-frequency arrhythmias.11,24–26
Device therapy and stimulation threshold
Stimulation thresholds vary immediately following implant due to lead-myocardium maturation and chronically due to changes in underlying myocardium, ischemia, infarction, metabolic state, or drug therapy.27–31 The present findings suggest that properties of the baseline RV stimulation threshold may be used clinically as an indicator of chronic changes caused by ischaemic heart disease, increasing the risk of arrhythmic events requiring ICD therapy and the risk of mortality. A high RV stimulation threshold was used as a marker of the degree of poor myocardial excitability to indirectly indicate potentially arrhythmia-prone conditions. The association was found to be independent of infarction location despite the essentially local measurement position at the RV apex, which implies that the parameter reflects not only a localized effect but rather a sum of effects. In addition, when looking at a small sample of the first 15 patients who received appropriate ICD shocks (and of whom more than one measurement of the RV threshold was available before the ICD therapy took place), we saw the RV threshold increasing several months before an appropriate shock in 11 patients (increase with as little as 0.2 V or with a much as 3 V), stay the same in three patients and decrease in one patient. After the ICD shock it remained the same in 14 patients and decreased in 1. According to this small sample of patients, one may cautiously suggest that there may also be a predictive value in serial measurement of the RV threshold regarding the imminent occurrence of a VA requiring appropriate ICD shock. These changes probably also reflect a state of progressing heart failure.
While the cumulative survival analysis was not able to demonstrate a significant difference in mortality incidence between the two study groups (Figure 3), post-implant RV threshold ≥1 V was nevertheless found to be independently associated with a 60% increased hazard of mortality after adjusting for confounders as listed in Table 2. Cardiac resynchronization therapy and LVEF were the most important variables influencing the association between RV threshold and mortality, both to an equal extent. As the association of the RV threshold with VA triggering appropriate shocks was strongest, the risk parameter may be most valuable for the estimation of fast, potentially life-threatening, arrhythmias.
Though the optimal cut-off value of the RV stimulation threshold for its best predictive value may vary slightly in post-MI patient subgroups with different baseline characteristics or for a different moment of baseline measurement, its ability to identify patient with a higher risk of arrhythmic events leading to appropriate ICD therapy and shocks will most likely not be affected. This is supported by results of the multivariate analyses that showed that the effect was independent of other predictors. Antiarrhythmic drugs such as beta-blockers tend to increase the stimulation threshold but, paradoxically, in the current study were used more frequently in the group with RV threshold <1 V, suggesting a limited clinical effect. Amiodarone treatment was more prevalent in patients with RV threshold ≥1 V, but whether the type III antiarrhythmic drug has similar effects is as yet unclear. Virtually all antiarrhythmic drugs may influence the pacing threshold but usually become clinically important only at high serum concentrations.29,30
Limitations
This is a single-centre follow-up study based on data of routine clinical practice. Missing data in the enrolled population was seen in <1% of patients, which limited potential over- or underestimation of findings. The single-centre nature of this study was, in this case, an advantage in that it kept the variability between procedure protocol and operators at a minimum.
Guidelines for ICD eligibility might have changed over time, creating a more heterogeneous patient population than in the strict controlled conditions of a clinical trial. Potentially confounding effects of these heterogeneities were limited by using the multivariable Cox analysis to assess the independent association between stimulation threshold and VAs.
The electrophysiologists performing the procedure at our centre are trained to look for an RV threshold preferably <1 V, though the number and distribution of pacing sites is not pre-specified or standardized in the clinical protocol. The search for the optimal threshold was at the discretion of the operator. MRI data were not available of patients in this study to assess scar tissue. However, data were available on the culprit vessel, peak troponin levels and perfusion defects post-MI (assessed with gated SPECT), which informed us about location and extensiveness of the myocardial damage. Other reasons led us to believe that the reported association between RV threshold and ICD therapy is valid, despite the study's non-standardized nature.
First, although certainly far from the accuracy of MRI scar tissue data, simply the location of the MI as informed by the mentioned test modalities should have led to substantial confounding of the association between the pacing threshold and the ICD shock rate, certainly when taking into account the relatively large sample size and number of events. However, on the contrary, a very strong relationship was still observed. Considering that it concerned the ‘optimal achievable pacing threshold (site)’ chosen by the operator at the time of implantation, this finding suggests that the operator did already take the location of the infarction into account at placement of the lead and avoided it as much as was possible.
Second, despite variation in procedures, due to the law of ‘regression toward the mean’ the eventual result of the threshold cutoff in a large sample size will probably approach the true mean. Patients included in this study were consecutive and non-selected, because the procedure was not done in a standardized trial setting. After reviewing the data of all patients and performing ROC analysis of all the measured thresholds, a clear trend was visible with a RV threshold of 1 V as the best statistical and clinical cutoff value. Although it is a relatively simple way to analyse the data, we believed it was best not to ‘overprocess’ the data after documentation, in order to avoid introducing errors in the natural distribution of the values and simply report what we observed, as we did not have the benefit of a standardized controlled study protocol.
In summary, although lack of MRI scar tissue data is a certain limitation of the study, we still believe that the association we found is a true trend that really exists. However, in order to get to the stage of clinical usefulness, the best threshold cutoff should be determined in a standardized prospective fashion in the future utilizing MRI data in order to draw definite conclusions about the ideal cutoff, or perhaps range, and its associated risk group. Of note, clinical usefulness of the stimulation threshold before the implantation of the ICD still remains to be investigated.
Lastly, while appropriate ICD therapy was used as a primary endpoint throughout the current study, it should be noted that it is not a perfect surrogate for life-threatening VA or SCD.
Conclusion
In ICD treated patients with a primary prevention indication and ischaemic heart disease, the RV stimulation threshold at implantation has an independent prognostic value for the prediction of potentially life-threatening VA and death.
Conflicts of interest: none declared.
Funding
Martin J. Schalij received research grants from Biotronik, Medtronic and Boston Scientific.
