


Abstract
It is unclear how the amplitude of bipolar electrogram relates to the local conduction velocity (CV) in patients with atrial fibrillation (AF). For 50 AF patients (paroxysmal/persistent AF: 40/10 patients), contact bipolar voltage maps of the left atrium (LA) were constructed during sinus rhythm using EnSite version 6.0J in a point-by-point recording fashion. Patients were divided into Groups A ( n = 16), B ( n = 19), and C ( n = 15) according to the level of the lowest electrogram amplitudes: <0.5, 0.5–0.75, and 0.75–1.0 mV, respectively. Low-voltage zone (LVZ) was defined separately for these groups as a bipolar electrogram amplitude of <0.5, 0.5–0.75, and 0.75–1.0 mV, respectively. The local CV through the LVZ and non-LVZ was calculated along the direction of local activation within each zone for all groups.
Low-voltage zone was consistently found at the septal, anterior, and posterior LA in all groups. In Group A, CV through the LVZ was significantly slower compared with the non-LVZ (0.8 ± 0.5 vs. 1.4 ± 0.6 m/s, P = 0.004), but those through the LVZ and non-LVZ were similar in Group B (1.2 ± 0.5 vs. 1.3 ± 0.5 m/s, P = 0.07) and Group C (1.5 ± 0.5 vs. 1.4 ± 0.6 m/s, P = 0.79). The percentage of points showing fractionated or double potentials in the LVZ was significantly more in Group A (76/293 points, 26%) than in Group B (11/185 points, 6%), and Group C (7/135 points, 5%) ( P < 0.0001 and P < 0.0001, respectively).
There was a significant slowing of local conduction in the LVZ defined as <0.5 mV and was frequently associated with fractionated or double potentials in patients with AF.
Introduction
An atrial fibrillation (AF) substrate in the left atrium (LA) is related to AF initiation and maintenance, and the pulmonary vein (PV) also plays an important role to initiate and perpetuate AF. 1 , 2 The AF substrate could be represented by a low-voltage electrogram during sinus rhythm (SR), shortened effective refractory period, complex fractionated atrial electrograms, and other features. 3 , 4 A low-voltage zone (LVZ) during SR has been shown to relate to LA function and damage. 5 , 6 In addition, Oakes et al . 7 recently reported that AF recurrence after PV antrum isolation (PVAI) is likely to occur in patients with LVZ. However, the reason why patients with LVZ have a relatively higher recurrence rate is unclear.
Low-voltage zone has been defined as an area with bipolar electrogram amplitude of <0.5 mV. 8 It is also unclear how the cut-off value of 0.5 mV for the definition of the LVZ is related to the electrophysiological characteristics including total activation time in LA, local conduction velocity (CV), and electrogram morphology. This study was conducted to examine how bipolar electrogram amplitude is related to local CV and electrogram morphology in patients with AF.
Methods
Study population
The study population comprised 50 consecutive patients with paroxysmal ( n = 40) or persistent ( n = 10) AF who were referred for radiofrequency (RF) ablation of AF and included 37 men and 13 women. Paroxysmal and persistent AF were defined according to the HRS/EHRA/ECAS consensus reports. 9 Their mean age was 61 ± 10 years. All patients had symptomatic drug-refractory AF. No patients had undergone any prior AF ablation. Two patients had valvular heart disease (mitral regurgitation) and one had undergone a mitral valvuloplasty. Three patients had ischaemic heart disease, three patients had idiopathic hypertrophic cardiomyopathy, and one patient had sick sinus syndrome. Transthoracic echocardiography showed that the mean LA dimension was 39 ± 5 mm, and the mean left ventricular fractional shortening was 38 ± 8%. Patients with a very large LA were excluded from the study. The maximum LA dimension in patients with persistent AF was 51 mm in this study. Informed consent was obtained from all patients, and the session was performed under conscious sedation. All antiarrhythmic drugs were discontinued for at least five half-lives before the electrophysiological study and ablation procedure.
Electrophysiological study and image acquisition
Standard multielectrode catheters were positioned in the coronary sinus and right ventricular apex via the femoral veins for pacing and recording. Using a standard Brockenbrough technique, an atrial transseptal puncture was performed under fluoroscopic guidance, and a multielectrode array (St Jude Medical, Minnetonka, MN, USA) was transseptally introduced into the LA through a 10 Fr long transseptal sheath (Mullins: Medtronic, Minneapolis, MN, USA). The tip of the multielectrode array was placed in the left atrial appendage (LAA). In addition, two more transseptal long sheaths were introduced into the LA by standard Brockenbrough technique, through which a 20-pole circular electrode catheter (Optima: St Jude Medical) was placed at either the right or the left superior PV ostium to record the PV potentials. A deflectable 7 Fr catheter with an 8 mm tip distal electrode (Fantasista: Japan Life Line Co., Ltd, Japan) was also introduced into the LA. The latter catheter was used for mapping, pacing, and ablation. Intravenous heparin (100 IU/kg) was administered to maintain an activated clotting time (ACT) of >300 s immediately after the atrial transseptal puncture. The ACT levels were monitored every 30 min, and if they were <300 s, an adequate amount of heparin was injected to maintain an ACT of >300 s. The long sheaths were constantly flushed with 5–10 mL of saline every 10–15 min to avoid any thrombus formation.
The three-dimensional geometry of the LA and PVs was depicted by EnSite version 6.0J (St Jude Medical). Three-dimensional voltage and activation maps were constructed during SR before the AF ablation with contact bipolar electrograms obtained from the endocardial LA in a point-by-point recording fashion. An 8 mm tip ablation catheter was used to record the voltages and local activation times. Bipolar intracardiac electrograms filtered between 30 and 500 Hz were recorded. The electrodes of the catheter placed in the coronary sinus were used for the timing reference signal for activation mapping. Efforts were made to obtain equally distributed mapping points throughout the LA. Contact bipolar mapping points were collected using interpolation of 10 mm and covered the LA thoroughly, which indicated that the distance to the nearest neighbouring point was <10 mm. The LA endocardial contact of the catheter during mapping was ensured fluoroscopically and using the stability of the catheter icon on the EnSite version 6.0J. The surface areas of the LA were calculated using a research segmentation software package. For patients with ongoing AF recorded at the beginning of the procedure, AF was converted to SR by an intracardiac DC shock of 5–10 J, and a 15 min interval was taken before the mapping to avoid any untoward effect by the DC shock. 10
After voltage and activation mapping was performed, a standard quadripolar mapping catheter coated with a lubricant was inserted nasally into the oesophagus under fluoroscopic guidance. The entire course of the oesophagus was depicted and superimposed on the posterior wall of the LA to avoid oesophageal injury. 11
Definition and measurement of the low-voltage zone
The mean peak-to-peak contact bipolar voltage throughout the LA was measured during SR, and a contact voltage map was constructed. Patients were divided into Groups A ( n = 16), B ( n = 19), and C ( n = 15) according to the level of the lowest electrogram amplitude in the LA as <0.5, 0.5–0.75, and 0.75–1.0 mV, respectively ( Table 1 ). Low-voltage zone was defined separately for Groups A, B, and C as bipolar electrogram amplitude of <0.5, 0.5–0.75, and 0.75–1.0 mV, respectively. The distribution of the LVZ in the LA was analysed for six pre-determined LA areas: anterior wall, septal wall, posterior wall, inferior wall, lateral wall, and the region including the LAA. Three patients with paroxysmal AF were excluded from this study because their lowest electrogram amplitude was >1.0 mV.
Patient characteristics
| Group A ( n = 16) | Group B ( n = 19) | Group C ( n = 15) | P -value | |
|---|---|---|---|---|
| Age, years | 64 ± 10 | 59 ± 11 | 61 ± 9 | 0.28 |
| Men/women, n | 8/8* | 15/4 | 14/1 | 0.02 |
| Paroxysmal/persistent, n | 11/5 | 16/3 | 13/2 | 0.39 |
| AF duration, years | 3.4 ± 3.7 | 4.5 ± 3.5 | 3.7 ± 3.0 | 0.72 |
| LA dimension, mm | 40 ± 6 | 40 ± 6 | 37 ± 4 | 0.20 |
| LVFS, % | 36 ± 10 | 38 ± 6 | 38 ± 8 | 0.64 |
| Structural heart disease, n (%) | 4 (25) | 4 (21) | 1 (7) | 0.38 |
| LA surface area, cm 2 | 124 ± 28 | 123 ± 20 | 128 ± 20 | 0.83 |
| LA mean peak-to-peak voltage, mV | 1.5 ± 0.6** | 2.3 ± 0.5 | 2.6 ± 0.6 | <0.0001 |
AF, atrial fibrillation; LA, left atrium, LVFS, left ventricular fraction shortening.
* P = 0.008 for the comparison of the Group A vs. Group C.
** P < 0.0001 for the comparison of the Group A vs. Group B and Group A vs. Group C.
Analysis of the conduction velocity
The contact activation map was constructed during SR to calculate the total activation time in the LA and the local CV, which was measured according to the methods described by other researchers. 12 , 13 In short, contact bipolar electrograms were recorded in a point-by-point recording fashion, and the local activation time was measured along the local activation direction revealed by the activation map. This map showed the timing difference from the electrogram of the coronary sinus to the beginning of the first deflection of the local electrogram recorded by the distal electrode of the mapping catheter. The isochronal line in the activation map was depicted at 4–6 ms intervals. Conduction velocity between two points was calculated using the linear distance and the difference in the local activation time between these points. Conduction velocities were calculated five times along each activation direction and were averaged to obtain a mean CV in the activation direction through areas of least isochronal crowding. The local CV through the LVZ and non-LVZ were calculated within each zone for each group and then compared in each group.
Analysis of the electrograms during sinus rhythm
The following definitions were used for the analysis. Amplitude represented the contact bipolar voltage difference between the highest and lowest deflections in each electrogram (peak-to-peak voltage). Double and fractionated signals were defined as those separated by an isoelectric interval of >50 ms and complex activities lasting for >50 ms, respectively. 14
Ablation procedure
Pulmonary vein antrum isolation was performed during spontaneous ( n = 12) or induced ( n = 29) AF in 41 patients and during SR in 9 patients. The ipsilateral PVs were jointly isolated by a continuous lesion at sites of 1 cm away from the PV ostium under navigation using the EnSite version 6.0J. Ablation was performed with a temperature limit of 55°C and a power limit of 40–50 W in general, but the power and duration were reduced to 30 W and 20 s at LA posterior wall sites near the oesophagus in order to minimize the risk of oesophageal injury. Radiofrequency ablation of the cavotricuspid isthmus was performed in patients with a history of atrial flutter or inducible cavotricuspid isthmus-dependent atrial flutter. If the non-PV triggers initiating AF were identified using the EnSite system, additional RF ablation was performed to these triggers.
The primary endpoint of the ablation procedure was electrical PV isolation with the elimination or dissociation of PV potentials. If AF did not terminate after PVAI, additional RF ablation was performed for the LA roof line. If AF persisted despite these procedures, it was converted to SR by an intracardiac DC shock of 5–10 J in patients of Groups B and C. In Group A patients, if AF persisted after PVAI and RF application to the LA roof line, additional RF ablation was performed for the LA bottom line connecting the right and left inferior PVs, the coronary sinus along the endocardial aspect and within the vessel as required, and/or areas with complex fractionated atrial electrograms. If AF persisted after these procedures, it was converted to SR by an intracardiac DC shock. Completeness of the line was verified by pacing from both sides of the ablation line, followed by depicting the virtual activation sequence on the EnSite interface if additional linear lesions were created.
Follow-up
After ablation, all patients underwent at least 2 days of continuous ECG monitoring in hospital and were administered oral anticoagulants. Patients were followed up at 2 weeks, 1 month, and then every 1 month, and 24 h Holter monitoring was performed. If patients experienced palpitation, another 24 h Holter monitoring was performed to evaluate their condition.
Statistical analysis
Continuous variables were expressed as the mean ± SD or numbers and percentages, as appropriate. Group comparisons for continuous variables were made by ANOVA, followed by a Bonferroni–Dunn post hoc test. Categorical variables were compared by a χ 2 test. A P -value of <0.05 was considered statistically significant.
Results
Regional voltage differences
Bipolar electrograms were taken for a total of 4709 points in all 50 patients with an average of 94 ± 26 points for each patient. For all patients, the mean peak-to-peak voltage of the entire LA was 2.2 ± 1.8 mV. The average bipolar voltage in the entire LA was not associated with AF duration, LA dimension, left ventricular fractional shortening, the presence of structural heart disease, LA surface area, or whether AF was paroxysmal or persistent. Ageing was associated with a decrease in the mean peak-to-peak voltage ( r = –0.3, P = 0.03). The mean electrogram amplitudes for women were significantly lower than for men (1.8 ± 0.4 vs. 2.3 ± 0.8 mV, P = 0.03), and the mean age of women was significantly higher than that of men (66 ± 6 vs. 60 ± 10 years, P = 0.03). The mean peak-to-peak voltage was diverse according to the sites of LA: 2.1 ± 1.8, anterior wall; 1.5 ± 1.3, septal wall; 1.9 ± 1.5, posterior wall; 2.1 ± 1.5, inferior wall; 2.8 ± 2.1, lateral wall; and 3.4 ± 2.6 mV, region including the LAA.
Patient characteristics and distribution patterns of the low-voltage zone for each group
There were no significant differences in patient clinical characteristics between the three groups, including age, AF duration, LA dimension, left ventricular fractional shortening, the presence of structural heart disease, or LA surface area ( Table 1 ). The percentage of women in Group A was significantly higher than that in Group C (50 vs. 7%, P = 0.008).
Examples of the regional distribution of the LVZ for each group are shown in Figure 1 . In Group A, the LVZ in the LA was heterogeneously distributed over the anterior wall (7 of 16 patients, 44%), septal wall (15 of 16 patients, 94%), posterior wall (7 of 16 patients, 44%), inferior wall (3 of 16 patients, 19%), lateral wall (3 of 16 patients, 19%), and the region including the LAA (2 of 16 patients, 13%) ( Figure 2 ). Similar distributions of the LVZ were also observed in Groups B and C ( Figure 2 ). Low-voltage zone was likely to be found at the septal, anterior, and posterior LA for all groups, although this finding was most common at the septal wall.
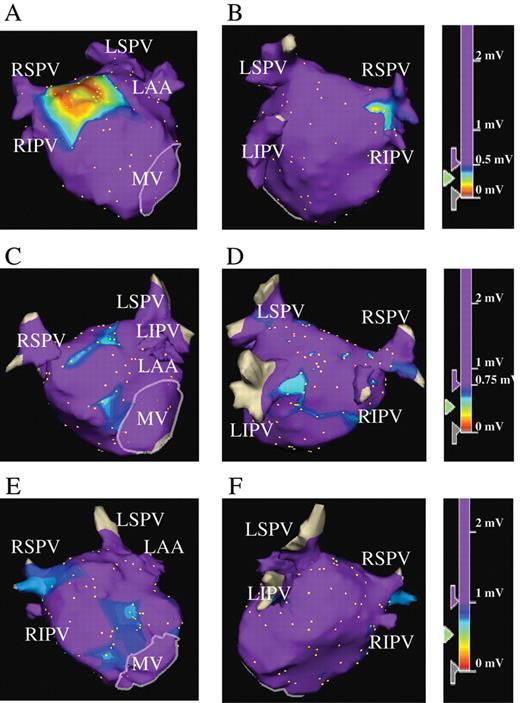
Representative three-dimensional voltage maps of the LA during SR. Patients in Group A ( A and B ), Group B ( C and D ), and Group C ( E and F ) from the anteroposterior (A, C, and E) and posteroanterior views (B, D, and F), respectively. (A and B) LVZ is defined as <0.5 mV for patients in Group A, including the case shown. Panels A and B show LVZ at the high septal wall, high anterior wall, and a part of the posterior wall LA. In the colour-coded key, purple represents areas with the voltages of >0.5 mV. (C and D) LVZ is defined as 0.5–0.75 mV (purple represents areas with voltages of >0.75 mV) for patients in Group B. Panels C and D show LVZ defined as 0.5–0.75 mV at the septal wall, anterior wall, and posterior wall of LA. Note that patients in Group B, including the case shown, did not have LVZ defined as <0.5 mV. (E and F) LVZ is defined as 0.75–1.0 mV (purple represents areas with voltages of >1.0 mV). Panels E and F show LVZ defined as 0.75–1.0 mV at the septal wall, anterior wall, and a part of the posterior wall of LA. Note that patients in Group C, including this patient, did not have LVZ defined as <0.75 mV. LA, left atrium; SR, sinus rhythm; LVZ, low-voltage zone; RSPV, right superior pulmonary vein; RIPV, right inferior pulmonary vein; LSPV, left superior pulmonary vein; LIPV, left inferior pulmonary vein; LAA, left atrial appendage; MV, mitral valve.

Frequency of points with low-voltage electrograms defined separately for each group for the six pre-determined left atrium sites.
Conduction velocity through the low-voltage zone and the non-low-voltage zone in each group
For all 50 patients, the mean LA total activation time was 96 ± 24 ms and was significantly longer in Group A than in Groups B and C (107 ± 25 vs. 91 ± 22 ms, P = 0.03; Table 2 ). The activation map revealed local conduction delays through the LVZ during SR for patients in Group A ( Figure 3 ), in which dense isochronal lines were observed in the LVZ, whereas homogeneously spaced isochronal lines were observed in the non-LVZ. In contrast, the homogeneously spaced isochronal lines, suggesting no conduction delay, were observed both through the LVZ and non-LVZ for patients in Groups B and C ( Figure 3 ).
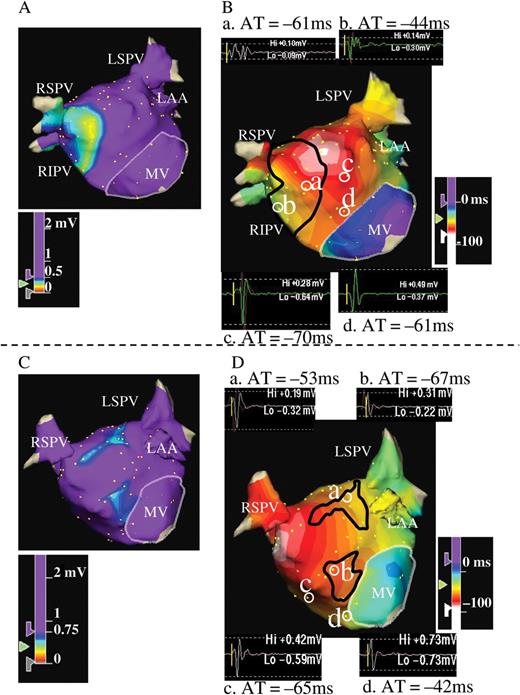
( A and B ) Example of voltage (A) and activation maps (B) in the LA during SR for a patient from Group A. Activation map was created at 4 ms intervals. Both maps were obtained from the anteroposterior view. Panel A shows LVZ at the LA septal wall. The area surrounded by the black line in Panel B corresponds to the LVZ defined as <0.5 mV in Panel A. Examples of electrograms are also shown in Panel B. Starting from the LA anteroseptal wall, activation spreads out towards the entire LA. Note that isochronal lines become more crowded in the LVZ, which implies slowing of conduction through the LVZ defined as <0.5 mV. In contrast, isochronal lines in the non-LVZ are widely spaced, suggesting a normal CV. The electrograms at sites a and b are located in the LVZ, whereas those at sites c and d are in the non-LVZ. The local AT referenced to the coronary sinus at each point are –61 ms at site a and –44 ms at site b. The distance between the two points (a and b) is 16 mm, and the difference of local AT is 17 ms; thus, CV is 0.9 m/s. The local AT is –70 ms at site c and –61 ms at site d. The distance between the two points (c and d) is 17 mm, and the difference of local AT is 9 ms; thus, CV is 1.9 m/s. Fractionated electrograms were recorded during SR at sites a and b in the LVZ, and the electrogram morphology at sites c and d in the non-LVZ appears normal. ( C and D ) Examples of voltage (C) and activation maps (D) in the LA during SR of a patient in Group B. Activation map was created at 6 ms intervals. The area surrounded by the black line in Panel D corresponds to the LVZ defined as 0.5–0.75 mV in Panel C. Examples of electrograms are also shown in Panel D. Starting from the LA posteroseptal wall, the activation spreads out towards the entire LA. Isochronal lines in the LVZ are not crowded, even in the LVZ, implying that CV is not slowed through the LVZ. Electrogram morphology at sites a and b in the LVZ and c and d in the non-LVZ appears normal for this case. CV, conduction velocity; other abbreviations as in Figure 1 .
Total activation time and conduction velocity
| Total activation time | Conduction velocity | ||
|---|---|---|---|
| LVZ area | Non-LVZ area | ||
| Group A (LVZ <0.5 mV) | 107 ± 25* | 0.8 ± 0.5** | 1.4 ± 0.6 |
| Group B (LVZ 0.5–0.75 mV) | 97 ± 26 | 1.2 ± 0.5 | 1.3 ± 0.5 |
| Group C (LVZ 0.75–1.0 mV) | 85 ± 13 | 1.5 ± 0.5 | 1.4 ± 0.6 |
| Total activation time | Conduction velocity | ||
|---|---|---|---|
| LVZ area | Non-LVZ area | ||
| Group A (LVZ <0.5 mV) | 107 ± 25* | 0.8 ± 0.5** | 1.4 ± 0.6 |
| Group B (LVZ 0.5–0.75 mV) | 97 ± 26 | 1.2 ± 0.5 | 1.3 ± 0.5 |
| Group C (LVZ 0.75–1.0 mV) | 85 ± 13 | 1.5 ± 0.5 | 1.4 ± 0.6 |
Groups A, B, and C consist of patients with the smallest amplitude of <0.5, 0.5–0.75, and 0.75–1.0 mV, respectively. The LVZ is defined separately for Groups A, B, and C as <0.5, 0.5–0.75, and 0.75–1.0 mV, respectively. LVZ, low-voltage zone.
* P = 0.04 for the comparison between Group A and Groups B and C.
** P = 0.004 for the comparison between the LVZ area and the non-LVZ area.
In Group A, CV through the LVZ was significantly slower compared with the non-LVZ (0.8 ± 0.5 vs. 1.4 ± 0.6 m/s, P = 0.004; Table 2 ). However, those through the LVZ and non-LVZ were similar in Group B (1.2 ± 0.5 vs. 1.3 ± 0.5 m/s, P = 0.07) and in Group C (1.5 ± 0.5 vs. 1.4 ± 0.6 m/s, P = 0.79). One patient from Group A was excluded from the analysis of CV between the LVZ and non-LVZ, as almost all electrograms in all segments in the LA were <0.5 mV.
Analysis of the electrograms in each group
A total of 1635 points were taken for electrogram recordings in Group A (102 ± 31 points per patient), 1825 points in Group B (96 ± 26 points per patient), and 1249 points in Group C (83 ± 16 points per patient, Table 3 ). The locations of the points in the LA among the three groups were equally distributed in the entire LA, and there were no significant differences in the numbers between the groups. The mean peak-to-peak voltage was significantly lower in Group A (1.5 ± 0.6 mV) than in Group B (2.3 ± 0.5 mV) and Group C (2.6 ± 0.6 mV) ( P < 0.0001 and P < 0.0001, respectively, Table 1 ). The number of points taken in the LVZ was similar among the three groups; 308 of 1635 points (19%) in Group A, 185 of 1825 points in Group B (10%), and 135 of 1249 points in Group C (11%). The percentage of electrograms demonstrating a complex morphology (fractionated or double potentials) in the LVZ was significantly more frequent in Group A (76 out of 293 electrograms, 26%) compared with Groups B (11 of 185, 6%) and C (7 of 135, 5%) ( P < 0.0001 and P < 0.0001, respectively). Fifteen of the 308 electrograms in Group A were excluded from the analysis of the morphology, as these electrograms were considered to represent scars. The percentage of electrograms demonstrating a complex morphology was significantly greater at the LVZ than those at the non-LVZ in Group A (26 vs. 2%, P < 0.0001), but no significant differences were found for the percentages between the LVZ and non-LVZ in Group B (6 vs. 3%, P =0.06) and Group C (5 vs. 2%, P = 0.06).
Electrogram characteristics
| Group A | Group B | Group C | |
|---|---|---|---|
| Number of patients | 16 | 19 | 15 |
| Points recorded in the LA, n (points/patient) | 1635 (102 ± 31) | 1825 (96 ± 26) | 1249 (83 ± 16) |
| Points with low-voltage electrograms, n | 308 | 185 | 135 |
| Points demonstrating complex morphology (double or fractionated potentials) in the LVZ, n (%) | 76 (26)* | 11 (6) | 7 (5) |
Groups A, B, and C consist of patients with the smallest amplitude of <0.5, 0.5–0.75, and 0.75–1.0 mV, respectively. The low-voltage electrogram is defined separately for Groups A, B, and C as <0.5, 0.5–0.75, and 0.75–1.0 mV, respectively. LA, left atrium; LVZ, low-voltage zone.
* P = 0.0001 for the comparison of Group A vs. Group B and Group A vs. Group C.
Relationship between the low-voltage zone and radiofrequency ablation
Radiofrequency ablation was performed during AF in 41 patients and during SR in 9 patients. Radiofrequency ablation during on-going AF was performed in 13 out of 16 patients in Group A, 18 out of 19 patients in Group B, and 10 out of 15 patients in Group C. In these patients, AF was terminated during PVAI alone in 6 out of 13 patients in Group A (46%), 13 out of 18 patients (72%) in Group B and 7 out of 10 patients in Group C (70%). Additional RF ablation was performed in patients in whom AF was not terminated after PVAI, using the previously mentioned strategy (seven patients in Group A, five in Group B, and three in Group C). Atrial fibrillation terminated by additional RF application in three of seven patients in Group A, one of five patients in Group B, and one of three patients in Group C.
Atrial fibrillation converted to atrial tachycardia (AT) in four patients during PVAI. A perimitral AT was transformed from AF in one patient in Group C. This AT was then converted to common atrial flutter by burst pacing from coronary sinus, and terminated by RF ablation at cavotricuspid isthmus. A roof-dependent macro-re-entrant AT was detected in another patient in Group C, which was terminated by burst pacing from the coronary sinus. Focal AT from the left superior PV occurred during left PVAI in another patient in Group C, which was terminated by subsequent left PVAI. Atrial tachycardia from the right inferior PV was detected in one patient in Group A, which terminated spontaneously. Non-PV triggers initiating AF were detected at the superior vena cava in three patients, the interatrial septum in one patient, and the coronary sinus ostium in one patient. Additional RF applications to these areas eliminated AF triggers.
During 14 ± 4 months of follow-up, 46 of 50 patients (92%) were free of AF. There was no significant difference in the AF free rate among the three groups [14 of 16 patients in Group A (88%), 17 of 19 patients in Group B (89%), and 15 of 15 patients in Group C (100%)]. Atrial tachycardia occurred 4 months after ablation in one patient in Group C, and was well controlled with sotalol.
Discussion
Main findings
There were several main findings from this study. First, the regional distributions of the LVZ in the LA were similar in all patients irrespective of the magnitude of the lowest electrogram amplitude, and LVZ was consistently found at the septal, anterior, and posterior LA. Second, the total activation time in the LA was significantly prolonged in those with the LVZ defined as <0.5 mV compared with those with the LVZ defined as 0.5–1.0 mV, and the local conduction through the LVZ defined as <0.5 mV was significantly delayed compared with that through the non-LVZ. However, the local conduction through the LVZ defined as 0.5–0.75 or 0.75–1.0 mV was similar to that through the non-LVZ. Third, there were more fractionated or double potentials in the LVZ defined as <0.5 mV compared with the non-LVZ for those with the LVZ defined as <0.5 mV and with both the LVZ and non-LVZ in those with the LVZ defined as 0.5–0.75 and 0.75–1.0 mV.
Relationship between the presence of the low-voltage zone and patient clinical characteristics
Patient clinical characteristics were similar among the three groups, including type of AF, AF duration, LA dimension, left ventricular fractional shortening, LA surface area, and percentage of structural heart disease. However, mean electrogram amplitudes in the LA were significantly lower, and the total activation time in the LA was significantly longer in those with the LVZ defined as <0.5 mV than those with the LVZ defined as 0.5–1.0 mV. These findings suggest that those with the LVZ defined as <0.5 mV have global electrical impairment of the LA in addition to local electrical impairment, which precedes the LA structural remodelling, as anatomical parameters of the LA were similar among the three groups.
This study showed that both ageing and female gender were associated with a decrease in the electrogram amplitude consistent with some previous studies. 14 The electrogram amplitude was reported to decrease with ageing due to senile changes of the LA, such as interstitial fibrosis. 15 The reason why females frequently had LVZ defined as <0.5 mV is unclear, although it may be related to the fact that the mean age of women was higher than that of men in this study.
Regional distributions of the low-voltage zone
Low-voltage zone has been defined as a site with a bipolar electrogram amplitude of <0.5 mV, and the distribution in the present study was similar to other previous reports. 6 , 8 , 16 Interestingly, the locations of sites with relatively low-amplitude electrograms were consistently found at the septal, anterior, and posterior LA, not only in patients with the LVZ defined as the lowest amplitude electrogram amplitude of <0.5 mV but also in those with the lowest amplitude electrogram amplitude of 0.5–0.75 and 0.75–1.0 mV, although the former seemed to have global electrical impairment. These findings suggest that the septal, anterior, and posterior left atria are vulnerable sites for electrical impairment in patients with AF.
Genesis of the low-voltage electrogram
A low-voltage electrogram has been reported to come from diverse mechanisms, in which atrial fibrosis has been suggested as a primary cause. 17–19 The low-amplitude electrogram may reflect poor tissue coupling, discontinuous conduction, and non-uniform anisotropic tissues caused by fibrosis. 20 Amyloidosis, inflammation, fat infiltration, and cellular degeneration were also reported to be related to the low-voltage electrograms. 21 In addition to these histological/anatomical factors, functional factors such as reduced function of the G-protein-gated atrial K + channel (Ik Ach ) were reported to contribute to a low-voltage electrogram. 22
A complex electrogram morphology of fractionated or double potentials was frequently observed with the LVZ defined as <0.5 mV. Lellouche et al . 22 demonstrated that a fractionated electrogram pattern may also be caused by atrial fibrosis. Atrial fibrosis is generated by fibrillar collagen deposits and separates remaining myocytes, contributing to the slowing of conduction and heterogeneity of the atrial refractory period. 22 , 23 Low-amplitude and fractionated electrogram may reflect very slow and/or zig-zag conduction within interstitial space having fibrosis. 24
Conduction velocity through the low-voltage zone
Oakes et al . 7 recently reported that patients with LVZ have a relatively high recurrence rate after PVAI and suggested that the LVZ in the LA is a cause of the abnormalities in atrial activation that underlie the initiation and perpetuation of AF. The present study demonstrated conduction disturbance in the LVZ, and might contribute to AF recurrence after PVAI. The local conduction through the LVZ defined as <0.5 mV was more delayed compared with that through the non-LVZ in Group A, and the local CV in the non-LVZ was similar among the three groups. The local CV in the LVZ defined as 0.5–0.75 mV tended to be slower, but was not statistically different compared with the non-LVZ. In addition, the LVZ defined as <0.5 mV had more electrograms with complex morphologies compared with the LVZ defined as 0.5–0.75 and 0.75–1.0 mV, and non-LVZ in any of the groups. It has been reported that electrograms with complex morphologies were observed in regions with the LVZ and slowed conduction. 25 The complex morphology of fractionated or double potentials may represent not only delayed conduction but also local conduction disturbance due to turning activation at a pivot point and local conduction block. Therefore, the LVZ defined as <0.5 mV may include the site with local conduction disturbance as well as delayed conduction. Some studies have reported conduction slowing in patients who had lower mean electrogram voltage in the LA; however, they have not assessed regional CV in the LVZ. 8 , 16 Park et al . 12 reported that CV in LA was slower at the LVZ in patients with AF. The definition of LVZ was, however, only <2.0 mV in that study. The present study examined in detail how the cut-off value of the LVZ was related to local conduction slowing by dividing LVZ criteria as <0.5, 0.5–0.75, and 0.75–1.0 mV. In addition, we examined electrogram morphologies in the LVZ compared with the non-LVZ in each group.
As mentioned earlier, the LA total activation time was significantly prolonged in Group A compared with Groups B and C. The mechanism for this is unclear, although the underlying mechanism might be related to the delayed conduction in the LVZ defined as <0.5 mV. A local conduction delay was observed through the LVZ defined as <0.5 mV, and CV was preserved in the non-LVZ in the same group. Therefore, the longer total activation time in Group A may have been due to a longer activation course of detour to pass around the LVZ, which may cause rotating activation and facilitate AF perpetuation. 8
Low-voltage zone in the LA may also contribute to the genesis of abnormal automaticity and triggered activity due to cell damage. 26 Low-voltage zone may also serve as the substrate for the non-PV trigger of AF. 5 , 6
Relationship between the low-voltage zone and radiofrequency ablation
Radiofrequency ablation was performed during on-going AF in 41 patients and during SR in 9 patients in this study. The percentage of AF termination by PVAI alone was 46% in Group A, 72% in Group B, and 70% in Group C. AF termination during PVAI alone followed by non-inducibility suggests that the substrate maintaining AF was not located in the LA body but rather confined to PV. In contrast, AF persistence after PVAI alone suggests that the substrate maintaining AF is present in the LA body. 27 , 28 Therefore, these findings suggest that PVAI alone was not enough to eliminate AF in patients with the LVZ defined as <0.5 mV; this also implies that no additional ablation procedure beyond PVAI might be required in patients without the LVZ defined as <0.5 mV.
Recurrence of AF is mainly due to PV reconnection. 29 Other potential causes include residual non-PV foci, the AF substrate in LA, and effects of the autonomic nervous system. 5 , 6 Although PV reconnection is thought to be the main cause of AF recurrence, the presence of the LVZ may also be a predictive factor as shown by Oakes et al . 7 The AF recurrence rate was expected to be higher in patients with the LVZ defined as <0.5 mV; however, it was similar among the three groups in this study. This result was probably due to different ablation strategies depending on the presence of the LVZ defined as <0.5 mV. If AF persisted after PVAI, additional RF ablation was performed for the LA roof line in patients of Groups B and C. On the other hand, more intensive additional RF ablation was performed for the LA bottom line, the coronary sinus, and/or areas with complex fractionated atrial electrograms in patients of Group A. As Oakes et al . 7 reported, the AF recurrence rate is higher in patients with the LVZ defined as <0.5 mV than that in those without the LVZ when PVAI alone is employed.
Limitations
A decrease in the electrogram amplitude may not represent electrically impaired atrial myocardium but may simply represent differences in tissue mass, fibre orientation, and/or magnitude of catheter contact to the LA wall. Low-voltage zone in the present study was not confirmed by another objective imaging techniques such as magnetic resonance imaging. 7 However, this issue is unlikely, as the conduction was delayed in the LVZ defined as <0.5 mV. If LVZ simply represented thin myocardial wall, fibre orientation, and/or the magnitude of catheter contact, the CV would be preserved within the normal range. An 8 mm tip electrode catheter was used for voltage mapping in this study, and the amplitude might be augmented compared with a standard 4 mm tip electrode catheter. When the data are applied to a voltage map using a 4 mm tip electrode, the cut-off value of 0.5 mV might be reduced to a little smaller value. An electrode with a 4 mm tip is more appropriate for sensing and analysing bipolar signals than one with an 8 mm tip. However, we used an 8 mm tip bidirectional ablation catheter to optimize RF energy delivery to the LA endocardium. The electrogram might be affected by the contact force of the catheter in the LA. However, we confirmed catheter contact using three-dimensional co-ordinates and fluoroscopy. Conduction velocity was affected not only by LVZ but also by myocardial fibre orientation, amount of depolarizing cells, and the expression and distribution of connexin. 30 , 31 It is unclear how these factors affected CV in this study. A trend towards a higher percentage of patients having persistent AF and/or structural heart disease was evident in Group A, although the difference was not significant among the three groups. The small number of patients with persistent AF and/or structural heart disease in this study might have influenced the statistical analysis. In addition, we performed AF ablation in patients with persistent AF in whom the LA diameter was not large. We did not analyse the electrophysiological properties of the LA in patients who had a normal LA without AF. Therefore, we do not know whether an area with a relatively small electrogram amplitude consistently distributed throughout septal, anterior, and posterior LA was present in patients without AF.
Conclusions
An area with a relatively small electrogram amplitude was consistently distributed at the septal, anterior, and posterior LA, irrespective of the smallest LA electrogram amplitude for patients with AF. Thus, these areas appeared to be vulnerable to electrical impairment. Local conduction delay was observed in the LVZ defined as <0.5 mV and was frequently associated with fractionated or double potentials. Low-voltage zone defined as <0.5 mV may be caused by fibrosis and generate conduction disturbance, which favours the genesis of re-entry and perpetuation of AF.
Conflict of interest: T.T. has served as a speaker and consultant for Nihon Kohden and St Jude Medical.
