


Abstract
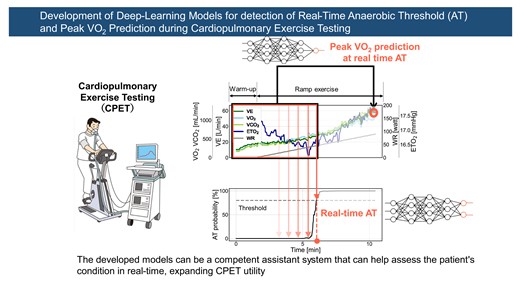
Exercise intolerance is a clinical feature of patients with heart failure (HF). Cardiopulmonary exercise testing (CPET) is the first-line examination for assessing exercise capacity in patients with HF. However, the need for extensive experience in assessing anaerobic threshold (AT) and the potential risk associated with the excessive exercise load when measuring peak oxygen uptake (peak VO2) limit the utility of CPET. This study aimed to use deep-learning approaches to identify AT in real time during testing (defined as real-time AT) and to predict peak VO2 at real-time AT.
This study included the time-series data of CPET recorded at the Department of Cardiovascular Medicine, Kyushu University Hospital. Two deep neural network models were developed to: (i) estimate the AT probability using breath-by-breath data and (ii) predict peak VO2 using the data at the real-time AT. The eligible CPET contained 1472 records of 1053 participants aged 18–90 years and 20% were used for model evaluation. The developed model identified real-time AT with 0.82 for correlation coefficient (Corr) and 1.20 mL/kg/min for mean absolute error (MAE), and the corresponding AT time with 0.86 for Corr and 0.66 min for MAE. The peak VO2 prediction model achieved 0.87 for Corr and 2.25 mL/kg/min for MAE.
Deep-learning models for real-time CPET analysis can accurately identify AT and predict peak VO2. The developed models can be a competent assistant system to assess a patient’s condition in real time, expanding CPET utility.
Lay Summary
Cardiopulmonary exercise testing can be used to evaluate the condition of patients with heart failure during exercise.
Developed deep-learning models can accurately predict a patient’s anaerobic threshold in real time and peak oxygen uptake.
The models can be used by clinicians for more objective and accurate assessments in real time, expanding the utility of cardiopulmonary exercise testing.
See the editorial comment for this article ‘Artificial intelligence and anaerobic threshold: the winner is human physiology’, by P. Agostoni et al., https://doi.org/10.1093/eurjpc/zwae015.
Introduction
Heart failure (HF) is a growing clinical concern in the ageing population of developed countries,1 and its associated mortality rate remains high despite improvements in drug and device therapies.2 Exercise intolerance is a clinical feature of patients with HF3 and is more strongly associated with the prognosis of HF than other factors such as left ventricular ejection fraction (LVEF) and brain natriuretic peptide (BNP).4,5 Recent studies have shown that exercise capacity is the most significant predictor of poor prognosis in patients with HF.6,7 Therefore, assessing exercise capacity is the primary step in treating patients with HF.
Cardiopulmonary exercise testing (CPET) is the first-line examination for quantitative measurement of exercise capacity in patients with HF.8 Gas exchange is co-ordinated with the skeletal muscle, peripheral tissue perfusion, and the heart and lungs; therefore, the overall exercise capacity status in patients with HF can be assessed using CPET, which monitors oxygen uptake (VO2) and carbon dioxide output (VCO2) during exercise.9 Anaerobic threshold (AT) and peak VO2 are the main outcomes of exercise capacity testing in CPET. Anaerobic threshold is defined as the oxygen consumption above which aerobic energy production is supplemented by anaerobic mechanisms, causing a sustained increase in lactate and metabolic acidosis during exercise,10 and peak VO2 is oxygen uptake at a symptomatic limit during exercise. Anaerobic threshold is a clinically important reference for cardiac rehabilitation, and peak VO2 is a critical indicator of prognosis in patients with HF.11
Anaerobic threshold is determined manually according to the following references: (i) the inflexion point of VCO2/VO2 slope (V-slope method), (ii) the time when minute ventilation (VE)/VO2 begins to increase, (iii) the time when the respiratory exchange ratio (R) derived from VCO2/VO2 begins to increase (time-trend method), and (iv) the time when the end-tidal oxygen partial pressure (ETO2) begins to increase.12 Clinicians determine individual AT after completing each CPET. However, the accurate determination of AT requires extensive experience and expertise. Kaczmarek et al.13 reported that a major limitation of CPET is the variability of AT measurement depending on clinicians, and Myers et al.14 showed that even experienced clinicians may have high variability of AT measurement in certain patients. Cardiopulmonary exercise testing has been reported to be safe; however, patients with HF are at potential risk during CPET because maximum exercise is required to measure peak VO2.15 These concerns limit the widespread use of CPET in patients with HF. Therefore, it is imperative to develop an approach to objectively determine AT in real time (herein referred to as real-time AT) and predict peak VO2 without maximum exercise.
Artificial intelligence (AI) is an approach that can overcome the limitations mentioned previously and contribute novel techniques to the medical field.16 For example, computer-aided detection using the deep-learning approach has been introduced for skin cancer diagnosis and diabetic retinopathy screening.17,18 Artificial intelligence has also been applied to the coronary computed tomographic angiography–based measurement of fractional flow reserve in cardiovascular disease.19 Furthermore, deep-learning models have recently been developed to identify patients with potential atrial fibrillation from the electrocardiogram of sinus rhythm.20,21 These applications have already achieved capabilities comparable with or better than those of expert clinicians, and deep-learning approaches are expected to be further applied to overcome the remaining limitations in the medical field, including CPET.
Therefore, the hypothesis of the present study was that the deep-learning model could identify the real-time AT by processing time-series data and predict peak VO2 without maximum exercise. To test this hypothesis, two deep-learning models were developed and evaluated. These models aimed to identify real-time AT and predict peak VO2 at the real-time AT during CPET.
Methods
Data sources
Participants aged 18–90 years who underwent ergometer (Strength Ergo 8 BK-ERG-121, Mitsubishi Electric Engineering Company, Tokyo, Japan) ramp stress tests for CPET at the Department of Cardiovascular Medicine, Kyushu University Hospital between January 2017 and August 2022 were included. The exclusion criteria were as follows: (i) patients with a ventricular assist device, (ii) indeterminable AT, and (iii) inadequate loading during CPET (average rotational speed <40 rpm during ramp loading or maximum loading <30 W). This study was approved by the Institutional Review Board of the Kyushu University Hospital (approval number: 22290-00) and conducted in accordance with the Declaration of Helsinki. The participants were given the opportunity to opt out.
The gas analyser was calibrated in advance. The CPET parameters were measured breath-by-breath during exercise using a CPET system (AE-310S Minato Medical Science, Osaka, Japan).
Outcomes
The primary outcome was AT identification in real time using breath-by-breath data. The secondary outcome was the prediction of peak VO2 from the data obtained at the real-time AT time point. The measured AT was determined based on the time-trend method with reference to the V-slope method, as agreed upon by the three CPET experts.22 The peak VO2 values were taken at the maximum value during the ramp exercise test. The AT and peak VO2 values were derived from ninth-order moving averages of VO2.
Predictive factors
The predictive factors obtained during CPET were VE, VO2, VCO2, ETO2, end-tidal carbon dioxide concentration (ETCO2), respiratory rate (RR), ratio of inspiratory time to the total respiratory cycle time (Ti/Ttot), heart rate (HR), revolutions per minute (RPM), and work rate (WR). Percutaneous oxygen saturation was excluded from this analysis due to a high number of missing values during continuous measurement. Breath-by-breath data were median-filtered and standardized to a mean of 0 and a standard deviation of 1. Basic characteristics, such as age, sex, height, and weight, were also analysed to improve the predictive accuracy of the deep-learning model.
Deep-learning models for analysing cardiopulmonary exercise testing
Figure 1 shows a schematic illustration of the analysis flow. The breath-by-breath CPET time-series data from the last 10 samples at rest to the end of the exercise were used. The of each time-series data was padded with 1023 samples at the resting data. These data were cropped with a fixed window of 1024 samples and shifted one by one for real-time analysis. The cropped data were annotated with the corresponding labels indicating whether the end of the cropped data reached AT (post-AT) or not (pre-AT; Figure 1A). The main model calculated the probability that the end of cropped data would exceed the AT (real-time AT model). Using this model, the time of real-time AT was identified as the point when this probability first reached a threshold, and AT values were derived from VO2 filtered with ninth-order moving averages at that time. This threshold was set to minimize the mean absolute error (MAE) of real-time AT in the training cohort. In addition, another model with the same architecture but an alternative output to predict peak VO2 at real-time AT (peak VO2 prediction model) was developed (Figure 1B and Graphical Abstract). The model parameters were fine-tuned with the developed real-time AT model. The details of these two models are presented in Supplementary material online, S1.
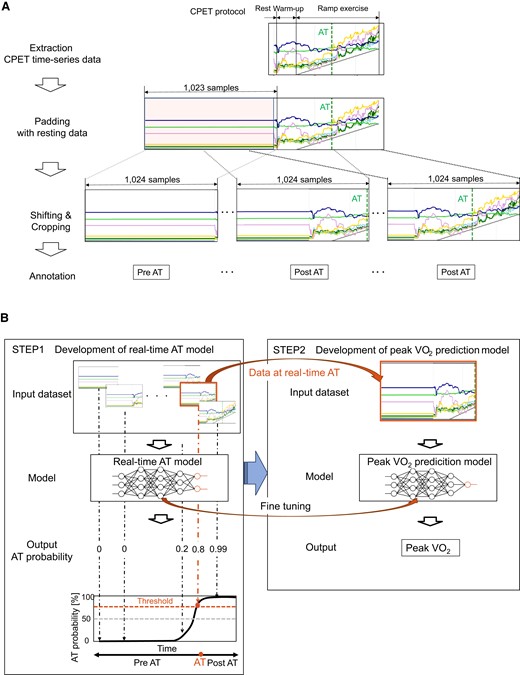
Data pre-process and deep-learning models for anaerobic threshold and peak oxygen uptake prediction from cardiopulmonary exercise testing data. (A) The pre-processing flow of the input data for real-time anaerobic threshold model. The head of each time-series data was padded with the 1023 samples at the resting data. The data were cropped with a fixed window of 1024 samples and shifted one by one for real-time analysis. The cropped data were annotated with the corresponding labels indicating whether the end of the data reached anaerobic threshold (post-anaerobic threshold) or not (pre-anaerobic threshold). (B) The left panel shows the real-time anaerobic threshold model, which calculates the probability that the end of the cropped data will exceed the anaerobic threshold. Using this model, real-time anaerobic threshold is determined at the time when this probability first reached a threshold. The right panel shows the peak oxygen uptake prediction model, which directly calculates the value of peak oxygen uptake from the data at real-time anaerobic threshold. This model has the same structure as the real-time anaerobic threshold model except for the output.
For the development and evaluation of the models, the dataset was randomly divided into training and test cohorts (4:1) to avoid assigning the same participants to both cohorts. Furthermore, one-eighth of the training cohort was used for hyper-parameter tuning. Two deep-learning models were developed using TensorFlow 2.6.5.
Statistics
The absolute standardized mean difference (ASMD) was used for the statistical evaluation of differences between groups. Differences were considered small if ASMD < 0.2. Each model evaluation was performed on data obtained from the test cohort. The real-time AT model was evaluated based on all cropped data and all examinations, respectively. The peak VO2 prediction model was assessed based on all examinations. In the assessment of peak VO2, participants with a maximum R < 1.1 were excluded on the basis of inadequate exercise.23 Discrimination metrics were a receiver operating characteristic (ROC) curve and the area under the curve (AUC), and calibration metrics were a calibration plot and the Brier score. In addition, these models were evaluated using Pearson’s correlation coefficient (Corr), coefficient of determination (CD), MAE, and the Bland–Altman plot. Bland-Altman analysis showed the difference between the predicted and the measured data relative to the average of the predicted and measured data. The incremental MAE of the models was evaluated by excluding one parameter from the CPET input (VE, VO2, VCO2, ETO2, ETCO2, RR, Ti/Ttot, HR, RPM, and WR) to clarify the contribution of each parameter to the real-time AT model. In addition, the performance of the real-time AT model was compared with the approach for AT identification based on an R value >1.0 (R-based AT).24 Subgroup analyses of sex and ejection fraction categories [HF with reduced/mid-range/preserved ejection fraction (HFrEF, HFmrEF, and HFpEF)] were performed. Analyses were performed using Python version 3.8 (Python Software Foundation, Wilmington, DE, USA).
Results
Participant characteristics
A total of 1472 CPET data from 1053 participants were analysed, excluding 263 participants with ventricular assist devices, 96 with indeterminable AT, and 35 with inadequate CPET loading (Figure 2). The analysed data were divided into a training cohort of 1194 examinations (843 participants) and a test cohort of 278 examinations (210 participants). Table 1 shows the clinical characteristics and respiratory gas data obtained during CPET. The participants were predominantly male (60%), with a median age of 47 [inter-quartile range (IQR): 32–63] years. With regard to cardiovascular disease, 91% of participants had HF, 12% had ischaemic heart disease, and 31% had congenital heart disease. The median BNP was 67 (IQR: 26–220) pg/mL, the LVEF was 41.7 (IQR: 30.9–54.4) %, and the proportion of HFrEF (EF < 40%) was 47%. With regard to the CPET data, the median AT was 11.2 (IQR: 9.5–13.2) mL/kg/min. Peak VO2 was 17.8 (IQR: 14.6–21.6) mL/kg/min. While the percentage of device implantation (pacemaker/implantable cardioverter defibrillator/cardiac resynchronization therapy) was different (ASMD: 0.273) between the training and the test cohorts, the other parameters, including the ASMD of AT (<0.001) and that of peak VO2 (0.019), were not significantly different.
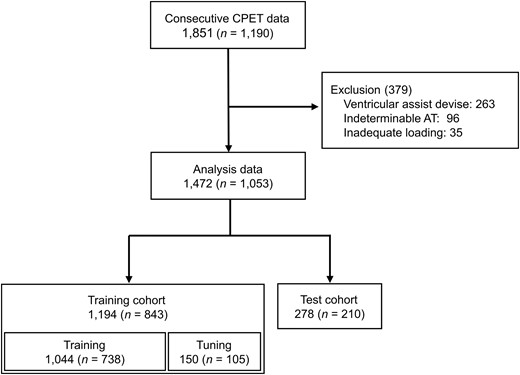
Flow diagram of data selection. CPET, cardiopulmonary exercise testing; AT, anaerobic threshold.
Participant characteristics
| All participants | Training cohort | Test cohort | ASMD | |
|---|---|---|---|---|
| Examination | 1472 | 1194 | 278 | |
| Participants | 1053 | 843 | 210 | |
| Age, years | 47 (32–63) | 47 (31–63) | 48 (32–65) | 0.052 |
| Male | 886 (60) | 736 (62) | 150 (54) | 0.156 |
| Body mass index, kg/m2 | 22.1 (19.7–25.0) | 22.3 (19.8–24.9) | 21.6 (19.6–25.6) | 0.004 |
| Hypertension | 393 (27) | 308 (26) | 85 (31) | 0.106 |
| Diabetes mellitus | 223 (15) | 179 (15) | 44 (16) | 0.023 |
| Chronic obstructive pulmonary disease | 46 (3) | 41 (3) | 5 (2) | 0.103 |
| Heart failure | 1342 (91) | 1085 (91) | 257 (92) | 0.054 |
| Ischaemic heart disease | 172 (12) | 130 (11) | 42 (15) | 0.125 |
| Adult congenital heart disease | 455 (31) | 384 (32) | 71 (26) | 0.147 |
| PM/ICD/CRT | 103 (7) | 97 (8) | 6 (2) | 0.273 |
| Heart transplantation | 65 (4) | 43 (4) | 22 (8) | 0.186 |
| Heart rate at rest, b.p.m. | 76 (68–85) | 76 (67–85) | 78 (69–89) | 0.194 |
| Systolic blood pressure, mmHg | 111 (99–127) | 111 (99–126) | 113 (100–129) | 0.114 |
| Diastolic blood pressure, mmHg | 67 (59–76) | 67 (60–76) | 68 (59–77) | 0.076 |
| Laboratory data, n = 530 | ||||
| BNP, pg/mL | 67 (26–220) | 71 (28–237) | 61 (24–141) | 0.154 |
| Echocardiography data, n = 1000 | ||||
| LVDd, mm | 55 (47–64) | 55 (48–64) | 52 (47–62) | 0.173 |
| LVEF, %, n = 842 | 41.7 (30.9–54.4) | 41.6 (30.7–53.9) | 42.4 (32.3–55.8) | 0.073 |
| LVEF < 40% | 392 (47) | 319 (47) | 73 (44) | 0.058 |
| Moderate or severe MR | 155 (16) | 129 (16) | 26 (13) | 0.071 |
| CPET data | ||||
| Max WR, W | 86 (70–109) | 86 (70–109) | 89 (69–106) | 0.010 |
| AT, mL/kg/min | 11.2 (9.5–13.2) | 11.2 (9.4–13.3) | 11.3 (9.8–13.1) | <0.001 |
| Peak VO2, mL/kg/min | 17.8 (14.6–21.6) | 17.8 (14.6–21.7) | 18.0 (14.9–21.4) | 0.019 |
Data are expressed as the median (inter-quartile range) or n (percentage).
ASMD, absolute standardized mean difference; PM, pacemaker; ICD, implantable cardioverter defibrillator; CRT, cardiac resynchronization therapy; BNP, brain natriuretic peptide; LVDd, left ventricular end-diastolic diameter; LVEF, left ventricular ejection fraction; MR, mitral regurgitation; CPET, cardiopulmonary exercise testing; WR, working rate; AT, anaerobic threshold; VO2, oxygen uptake.
Overall performance of the real-time anaerobic threshold model
The real-time AT model was evaluated based on all cropped data with 43 750 pre-AT and 35 518 post-AT on the test cohort. This model achieved an ROC–AUC of 0.99 and a Brier score of 0.052 (Figure 3A and B). The real-time AT based on each examination was identified using this developed model. Figure 3C shows a representative execution of the real-time AT model. The predicted AT probability increased sharply around the time of AT, and the real-time AT was close to the measured AT in the V-slope method, indicating that the real-time AT model detected the ground truth of AT reasonably well.
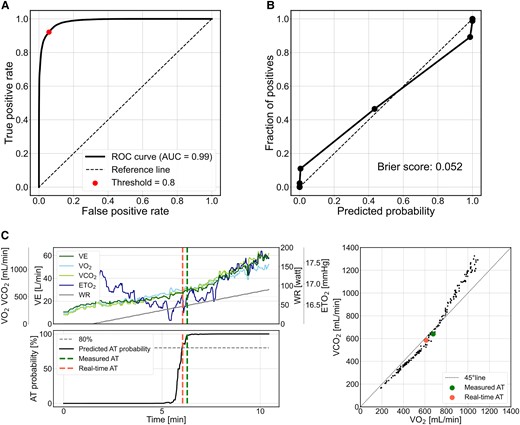
Performance of the real-time anaerobic threshold model on the test data. (A) Receiver operating characteristic curve of the deep-learning model for anaerobic threshold identification. (B) Calibration plot of the data binned into ten segments vs. the percentage occurrence of measured anaerobic threshold against the predicted probability of anaerobic threshold. (C) Relationship between anaerobic threshold probability predicted by real-time anaerobic threshold model, real-time anaerobic threshold, and measured anaerobic threshold for cardiopulmonary exercise testing time-series data. The upper left panel shows the actual cardiopulmonary exercise testing time-series data, and the lower left panel shows the transition of anaerobic threshold probability predicted by real-time anaerobic threshold model. The right panel shows the relationship between oxygen uptake and carbon dioxide output used in the V-slope method. AUC, area under the curve; VE, minute ventilation; ETO2, end-tidal oxygen concentration; WR, work rate.
Accuracy of real-time anaerobic threshold
The accuracy of the real-time AT and the timing across all examinations in the test cohort are shown in Figure 4. There was one case where AT could not be identified because the predicted probability of AT did not exceed the threshold (80%). The metrics on the real-time AT were 0.82 for Corr, 0.67 for CD, 1.20 mL/kg/min for MAE, and 0.01 for bias mL/kg/min (Figure 4A and B). The metrics on the timing of real-time AT were 0.86 for Corr, 0.74 for CD, 0.66 min for MAE, and 0.17 min for bias (Figure 4C and D).
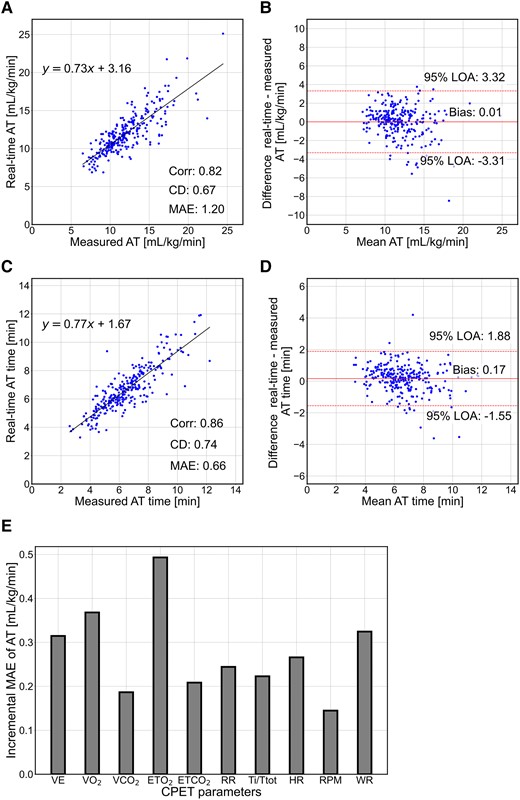
Prediction performance of the anaerobic threshold and the timing on the test cohort. (A and C) Real-time anaerobic threshold and timing relationships between measured and predicted values. (B and D) Bland–Altman plots for real-time anaerobic threshold and timing, respectively. (E) Contribution of parameters to the real-time anaerobic threshold model. Corr, correlation coefficient; CD, coefficient of determination; MAE, mean absolute error; LOA, limits of agreement; VE, minute ventilation; VO2, oxygen uptake; VCO2, carbon dioxide output; ETO2, end-tidal oxygen concentration; ETCO2, end-tidal carbon dioxide concentration; RR, respiratory rate; Ti/Ttot, ratio of inspiratory time to the total respiratory cycle time; HR, heart rate; RPM, revolutions per minute; WR, work rate; CPET, cardiopulmonary exercise testing.
Contribution of each parameter to the real-time anaerobic threshold
The contribution of each CPET parameter to the accuracy of the real-time AT model was examined. The increased MAE of the model was evaluated by excluding one parameter from the input parameters on the test cohort. As shown in Figure 4E, the largest contribution among the parameters was ETO2, with an increased MAE of 0.49, followed by VO2 (0.37), WR (0.32), VE (0.31), and HR (0.27).
Comparison of real-time anaerobic threshold with R-based anaerobic threshold
The performance of real-time AT identification in the developed model was compared with that of R-based AT. In total, 54 of the 278 cases in the test cohorts already had R over 1.0 at baseline and 2 cases did not achieve R over 1.0 during exercise; these data were excluded from this analysis. The metrics on the R-based AT values were 0.64 for Corr, 0.41 for CD, and 2.29 mL/kg/min for MAE, and those of AT timing were 0.53 for Corr, 0.28 for CD, and 1.58 min for MAE (see Supplementary material online, S2). The real-time AT model was obviously more accurate than the R-based model.
Subgroup analysis
Subgroup analyses of the real-time AT model were performed for sex and ejection fraction categories. The results are shown in Supplementary material online, S3 and S4. In the sex category, the MAEs for real-time AT were 1.25 and 1.16 mL/kg/min and those for AT time were 0.67 and 0.65 min for females and males, respectively. In the ejection fraction category, the MAEs for real-time AT were 0.99, 1.09, and 1.39 mL/kg/min and those for AT time were 0.61, 0.53, and 0.87 min for HFrEF, HFmrEF, and HFpEF, respectively.
Peak oxygen uptake prediction
In the test cohort, 261 examinations with a maximum R ≥ 1.1 were evaluated. The representative execution of the peak VO2 prediction model is shown in Figure 5A. The predictive metrics on the peak VO2 were 0.87 for Corr, 0.76 for CD, 2.25 mL/kg/min for MAE (Figure 5B), and −0.06 mL/kg/min for bias (Figure 5C), indicating that the predicted peak VO2 using time-series data until the real-time AT timing was close to the measured peak VO2.
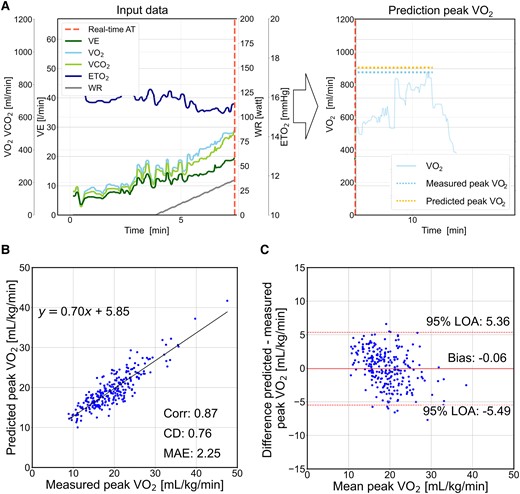
Prediction performance of the peak oxygen uptake on the test cohort. (A) The model predicts the peak oxygen uptake using time-series cardiopulmonary exercise testing data at the real-time anaerobic threshold. The left panel shows the input data. The right panel shows the relationship between the predicted and the measured peak oxygen uptake. The translucent line shows the measured oxygen uptake data, which are not used in the prediction model. (B) Relationship between the predicted and the measured peak oxygen uptake. (C) Bland–Altman plot of the predicted and measured peak oxygen uptake. VE, minute ventilation; VCO2, carbon dioxide output; ETO2, end-tidal oxygen concentration; WR, work rate; Corr, correlation coefficient; CD, coefficient of determination; MAE, mean absolute error; LOA, limits of agreement.
Discussion
The deep-learning model developed in this study accurately identified real-time AT during CPET. In addition, the other model predicted the peak VO2 using CPET data at the real-time AT.
Model performance
The deep-learning model achieved an MAE for real-time AT of 1.20 mL/kg/min and for time of 0.66 min. With regard to the R-based AT approach, the MAE of the R-based AT and the time were 2.29 mL/kg/min and 1.58 min, respectively. It should also be noted that the R-based approach failed to identify AT in ∼20% of cases because of high R values at baseline, whereas our proposed model was able to identify AT in all but one case. These results suggest that the deep-learning model for real-time AT was superior to the R-based approach. In contrast, the MAE of the deep-learning model for peak VO2 prediction was 2.25 mL/kg/min. Peak VO2 is unsurprisingly more difficult than AT identification because it is a future value prediction and it can be influenced by several factors, including cardiovascular and respiratory conditions, skeletal muscle, and participant motivation.25,26 In addition, accurate measurement is often difficult in some patients with low motivation for CPET. Therefore, more comprehensive data are needed to improve the accuracy of the prediction model for peak VO2.
To assess the robustness of the model, subgroup analyses were conducted for sex and ejection fraction categories. The influence of these categories was not evident, as shown in the subgroup analysis (see Supplementary material online, S3 and S4). Nonetheless, the MAE at the AT time was slightly larger in patients with HFpEF. This may be explained by the fact that HFpEF is a complex disease comprising ageing and abnormalities in vascular function, skeletal muscle, and other organ functions.27
Comparison with previous models
Miura et al.28 recently developed a deep-learning model for identifying the timing of AT from electrocardiography data. This model has the advantage of identifying the timing of AT without a respiratory gas analyser; however, peak VO2 values cannot be determined in real time. In addition, this model requires patients to complete the CPET with maximum load exercise. On the other hand, Shiraishi et al.29 demonstrated an algorithm to determine the timing of AT with the HR variability in real time. The predicted AT substantially correlated with the AT in healthy participants and patients with myocardial infarction (Corr: 0.921 and 0.867, respectively). Furthermore, the biases were 0.53 mL/kg/min in healthy participants and −0.72 mL/kg/min in patients with myocardial infarctions. However, it is difficult to directly compare the present results with these findings because the findings of Shiraishi et al. were not validated with patients who have various types of HF. Considering the difficulty in assessing HR variability after heart transplantation or pacemaker implantation, the present model, which is less dependent on HR, may be suitable for clinical use.
Potent predictive parameters for real-time anaerobic threshold
The effect of input parameters on real-time AT prediction was examined by excluding each parameter one by one from the deep-learning model (Figure 4E). The results revealed that the largest deterioration of the model was induced by the exclusion of ETO2, followed by VO2.
Minute ventilation, VCO2, VO2, ETO2, and the combinations are the conventional references for AT determination. In particular, ETO2 begins to decrease as VO2 increases because of ATP production in the skeletal muscle at the onset of exercise. ETO2 increases after AT because AT is the onset of metabolic acidosis caused by an imbalance between oxygen demand and supply.9 Thus, ETO2 can determine AT by reference to the elevated time point. As for VO2, bicarbonate-derived CO2 increases alveolar CO2 output relative to O2 uptake. Therefore, the relationship between VO2 and VCO2 is considered to be critical in determining AT.12 Other parameters also contributed to prediction accuracy but did not differ significantly among them in the increments of MAE. There is a possibility that the developed model could have achieved accurate performance by comprehensively evaluating each parameter obtained during the CPET examination.
Perspective of the developed model
The developed models could automatically identify AT and predict the peak VO2 using data at the real-time AT. The combination of the developed models is expected to have the following advantages. First, in clinical applications, continuously inputting CPET data into the model during CPET would enable an automatic identification of AT in real time. This deep-learning model will be beneficial in assisting less experienced clinicians in objectively determining AT, particularly in cases where making decisions based solely on V-slope analysis are challenging. Second, the present deep-learning model enables clinicians to inform patients when they have reached AT during CPET, allowing patients to understand the level of fatigue and exercise intensity associated with AT. Given that exercise intensity at the level of AT is important for cardiac rehabilitation, it should be useful for patients to recognize the level of exercise intensity at the AT.30 Third, maximum loading is required for an accurate assessment of peak VO2. However, predicting peak VO2 without maximum loading may be useful in cases with a potential risk of cardiovascular accidents.
Additional large-scale data may improve the accuracy of real-time AT and peak VO2 prediction. In particular, the models can be optimized for each CPET expert institution by incorporating their preferences into the models developed in this study. These further developments will make the proposed models more practical and thus help in the management of patients with HF.
Study limitations
This study had several limitations. First, this was a single-centre study, and the models should be prospectively evaluated in a multicentre setting with a wider range of participant backgrounds. Second, participants with ventricular assist device and inadequate loading were excluded from this study. It should be noted that the performance of the proposed models in these patients needs to be further investigated. Third, the validities of AT and peak VO2 may be potential limitations. The AT in this study was determined through a consensus among three CPET experts. The validity of the measured AT was limited to the experience and knowledge of three CPET experts in a single centre. On the other hand, for peak VO2, the termination of the CPET loading was not standardized due to the retrospective design of the study, suggesting that the value may differ among CPET examiners. Fourth, resting spirometry data were not provided in this study because most of the patients with HF were not simultaneously assessed for respiratory function. Further prospective studies are needed to clarify the effect of respiratory function on the model.
Conclusion and clinical implications
The models developed in this study demonstrated high accuracy in identifying real-time AT and predicting peak VO2 using data obtained at the real-time AT. These models increase the usefulness of CPET by allowing for accurate evaluations in real time with minimal loading.
Supplementary material
Supplementary material is available at European Journal of Preventive Cardiology.
Acknowledgements
We would like to thank Ms. Taeko Hotta and her colleagues in the Physiology Department for their co-operation in collecting CPET data and Ms. Yukari Tanaka for collecting clinical data.
Author contribution
T.W., T.T., M.I., and T.I. contributed to the conception or design of this work. T.W., T.T., T.F., and T.H. contributed to the acquisition of data. T.T., M.I., and T.I. contributed to the cleaning and annotation of the data. T.W., T.T., M.I., and T.I. contributed to the analysis or interpretation of the data for the work. T.W., T.T., T.I., and M.I. drafted the manuscript and prepared the figures. T.T. and J.K. made statistical proposals. S.M., K.T., S.K., and H.T. critically revised the manuscript. All authors gave final approval and agreed to take responsibility for all aspects of the work and to ensure integrity and accuracy.
Funding
This work was supported by the Uehara Memorial Foundation (T.T.).
Data availability
The data underlying this article cannot be shared publicly for reasons of maintaining the privacy of individuals who participated in the study. The data will be shared on reasonable request to the corresponding author.
References
Author notes
Conflict of interest: T.W. is an employee of Nihon Kohden Inc., Tokyo, Japan. T.I. received research funding from SBI Pharmaceuticals and Pfizer Japan Co., Ltd. H.T. received remunerations from Daiichi Sankyo, Viatris, Ono Pharmaceutical, Bayer Yakuhin, Otsuka Pharmaceutical, AstraZeneca, Novartis Pharma, and Nippon Boehringer Ingelheim. Research funding was received from MEDINET, Kowa, Nippon Boehringer Ingelheim, Daiichi Sankyo, IQVIA Services Japan, Johnson & Johnson, NEC Corporation, and Medical Innovation Kyushu. Scholarship funds or donations were received from Otsuka Pharmaceutical, Boston Scientific Japan, Ono Pharmaceutical, Teijin Pharma, Zeon Medical, Bayer Yakuhin, Nippon Boehringer Ingelheim, St. Mary’s Hospital, Teijin Home Healthcare, Daiichi Sankyo, Mitsubishi Tanabe Pharma, Abbott Medical Japan, and Japan Lifeline. T.T., M.I., T.F., T.H., S.M., J.K., K.T., S.K., and T.I. declare no conflict of interest.

Comments