


Abstract
Poor exercise capacity and muscle strength in early adulthood are risk factors for cardiovascular disease (CVD). However, it is unclear how these factors relate to subclinical atherosclerosis due to a lack of longitudinal studies. This study investigated whether early adulthood exercise capacity and muscle strength associated with later adulthood subclinical atherosclerosis.
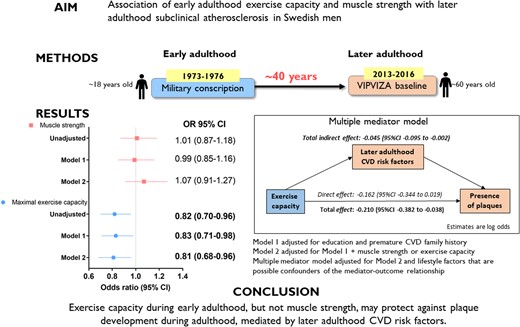
This study included Swedish men (n = 797) who were eligible for military conscription (at ∼18-years of age) and who participated in the baseline assessment of the visualization of asymptomatic atherosclerotic disease for optimum cardiovascular prevention trial between 2013 and 2016 (at 60 years of age). At conscription, isometric muscle strength (dynamometer) and maximum exercise capacity (maximal load cycle ergometer test) were measured. During later adulthood (at 60 years old), the presence of carotid plaques and intima media thickness were measured by using high-resolution ultrasound. At follow-up, plaques were present in 62% (n = 493) of men. Exercise capacity in early adulthood associated with 19% lower odds of plaques [odds ratio (OR) 0.81, 95% confidence interval (CI) 0.68–0.96], independent of muscle strength. This association was not mediated by any single CVD risk factor. However, the total indirect effect of later, but not early, adulthood CVD risk factors was significant, while the direct effect was non-significant (OR 0.85, 95% CI 0.71–1.02). Associations between muscle strength and subclinical atherosclerosis were non-significant.
Higher exercise capacity during early adulthood, but not muscle strength, may protect against carotid plaque development during adulthood mediated by the combination rather than a single later adulthood CVD risk factors.
Abbreviations: VIPVIZA, visualization of asymptomatic atherosclerotic disease for optimum cardiovascular prevention; cardiovascular disease risk factors are body mass index, systolic blood pressure, non-HDL cholesterol, triglycerides, and glucose tolerance status.
Lay summary
Swedish men who had high fitness at ∼18 years of age (early adulthood) had a lower prevalence of atherosclerotic plaques 40 years later (later adulthood), independent of muscle strength.
The underlying mechanism of this protective association of higher fitness on the presence of plaques may be through the combination of later adulthood body mass index, systolic blood pressure, glucose tolerance status, non-HDL cholesterol, and triglycerides instead of through any single risk factor.
Muscle strength during early adulthood was not associated with atherosclerosis during later adulthood.
Introduction
Atherosclerosis is evident from an early age such as adolescence and young adulthood.1 Carotid intima media thickness (cIMT) and the presence of plaques, measures of subclinical atherosclerosis, predict future cardiovascular disease (CVD) events independent of traditional CVD risk factors.2,3 Identifying modifiable risk factors of atherosclerosis at an early age may be paramount to halt atherosclerosis and lower CVD risk. In addition, early prevention strategies may reduce the burden of older people with asymptomatic atherosclerosis, and as such, lessen the burden on the healthcare system.
Both exercise capacity4,5 and muscle strength4,6 are predictors of future CVD risk and mortality. Importantly, it has been shown that sarcopenia, of which muscle strength is a component, and CVD share common pathogenic pathways, with atherosclerosis playing a central role.7 Nevertheless, the association of exercise capacity and muscle strength with subclinical atherosclerosis is less clear. A recent study showed, after adjustment for confounders, that higher exercise capacity associated with a lower risk of subclinical atherosclerosis.8 In addition, evidence has shown that muscle strength associates with subclinical atherosclerosis in different populations,9,10 even independent of other CVD risk factors.10 However, these studies are cross-sectional and are limited by the risk of reverse causality. Clearly, there is a lack of longitudinal studies with sufficient follow-up that evaluated the associations of early adulthood exercise capacity and muscle strength with later adulthood subclinical atherosclerosis. Also, since studies have shown that middle-aged athletes have a higher prevalence of coronary atherosclerosis compared with their less active counterparts,11 our study may contribute additional information on how higher exercise capacity during early adulthood may relate to subclinical atherosclerosis in middle-age men.
Therefore, this study first aimed to determine the associations of early adulthood maximal exercise capacity and muscle strength with later adulthood presence of plaques and cIMT and second to examine whether these associations were mediated by CVD risk factors during early adulthood or later adulthood in Swedish men.
Methods
Study population
The present study included young Swedish men who were eligible for military conscription during 1973–1976 and who participated in the baseline assessment of the visualization of asymptomatic atherosclerotic disease for optimum cardiovascular prevention (VIPVIZA) study between 2013 and 2016 when they were 60 years of age. VIPVIZA is integrated in the Västerbotten Intervention programme (VIP). Conscription was compulsory for all men aged 18 years old in Sweden. In VIP, a population-based screening and intervention programme, inhabitants of Västerbotten are invited to participate when they turn 40, 50, and 60 years of age. In brief, at each visit, the VIP participants receive a comprehensive health screening and an individual motivational interview based on traditional risk factors to promote a healthy lifestyle.12 Annually, about two-thirds of the eligible population participate in VIP. VIPVIZA is a pragmatic open-label randomized controlled trial that compares the effect of a traditional individual CVD risk factor–based communication with adding pictorial information about an individual’s subclinical atherosclerosis on CVD prevention.13 The inclusion criteria for VIPVIZA determined at the VIP visit, differed by age group. The age-specific inclusion criteria were: (i) 40 years old and a first degree relative with a history of premature CVD (n = 136), (ii) 50 years old and at least one CVD risk factor or a first degree relative with a history of premature CVD (n = 472), or (iii) aged 60 years (n = 1054). Each of these age groups represents different populations, and therefore, a pragmatic decision was made to include only the 60-year-old age group in the current study. Moreover, in this study, early adulthood will refer to the time period when men were ∼18 years of age and later adulthood will refer to the time period when they were 60 years of age. We excluded participants with missing data on exercise capacity and muscle strength (n = 227, 21.5%), and an additional 30 participants were excluded due to missing values in other covariates. A total of 797 participants with complete data remained. We assumed that exercise capacity and muscle strength were missing completely at random due to factors outside of the study, e.g. injury, illness, or abnormal electrocardiogram findings.14
Research ethics
This study was approved by the Swedish Ethical Review Authority (Ref. Dnr 2011-441-31 M, Amendment Dnr 2018-482-32 M). All participants provided written informed consent.
Early adulthood procedures
At military conscription, an examination was performed that included height and weight measurements and resting systolic and diastolic blood pressure. Isometric muscle strength (hand grip strength, knee extension strength, and elbow flexion strength) was measured in three attempts by a dynamometer in Newtons using standardized procedures.15 The maximal muscle strength was used for analysis. If the third attempt was the highest, then additional measurements were done until muscle strength measurement stabilized. Combined muscle strength was calculated using the following formula = (1.7×hand grip strength) + (1.3×knee extension) + (0.8×arm flexion).16
Exercise capacity was measured using a well-validated maximal test.17 The maximal workload (measured in Watts) was determined using a stationary cycle ergometer (Elema–Schönander Model AM 368 or similar). After a warm-up conducted at a light work rate, determined by body weight, the work rate was increased by 25 Watts/minute until the subject was unable to continue due to exhaustion. The maximum heart rate was noted to confirm maximal effort. This maximum exercise workload test correlates well with directly measured VO2max tests18 and has high repeatability with a test–retest correlation of 0.95.19
Later adulthood parameters and outcomes assessment
VIPVIZA baseline assessments, which were performed within VIP, included the completion of a detailed self-administered questionnaire that included information on physical activity, smoking, alcohol consumption, dietary intake, family history of premature CVD, education, and the measurement of height, weight, systolic and diastolic blood pressure, measures of dyslipidaemia (total-, HDL-, and LDL cholesterol and triglycerides), and an oral glucose tolerance test. Body mass index (BMI) was calculated as weight (kg) divided by height (m) squared.
At inclusion in VIPVIZA, the presence of plaques and cIMT were measured by using high-resolution ultrasound (CardioHealth Station, Panasonic Healthcare Corporation of North America, Newark, NJ, USA). The presence of plaques in the left and right carotid arteries (including the segments, common, bulb, internal, and external) was identified according to the Mannheim consensus20 as a focal structure encroaching into the arterial lumen of at least 0.5 mm or >50% of surrounding IMT or a thickness of >1.5 mm. Next, cIMT of both the left and the right common carotid artery—the mean over a 1 cm wide segment—was automatically measured by using edge detection on the far wall at predefined insonation angles (240°, 210°, and 150° and 120° for the left and right carotid arteries, respectively) based on Meijer arc. The maximal value of the individual mean cIMT measurements from all four projections was used as the outcome measure.
The inter-operator variability of the automatic cIMT measurement has previously been shown to be excellent (intra-class correlation coefficient of 0.95)21 and the inter-operator reproducibility of plaque detection in this cohort has been shown to be substantial (a kappa value of 0.70).22
Statistical analysis
In the descriptive analysis, early and later adulthood characteristics were explored across low and high exercise capacity and across low and high muscle strength, with dichotomization based on the median value. A Mann–Whitney test (non-normally distributed) or an independent t-test (normally distributed) was performed on continuous variables. A χ2 test was used for categorical variables.
In the main analysis, logistic regression models were used to determine whether exercise capacity and muscle strength were associated with the presence of plaques. Associations of exercise capacity and muscle strength with cIMT were evaluated using two approaches: (i) linear regression with cIMT as continuous and (ii) logistic regression with cIMT dichotomized using ≥ the 75th percentile as the presence of subclinical atherosclerosis; this corresponded to a value of 0.91 mm. Model 1 was adjusted for education and premature CVD family history. Model 2, in addition to Model 1 covariates, included both exercise capacity and muscle strength, to determine the independent association of these predictors on subclinical atherosclerosis. The narrow age range during military conscription (mean 18 years ± SD 1)14 and during follow-up (median 59.9 years, range 59.1–60.9) may be regarded as a form of restriction on age, and therefore, no adjustments were made for age in the models.
Mediation analyses were done. First, to determine whether the associations of exercise capacity and muscle strength with subclinical atherosclerosis may be mediated through early adulthood BMI and systolic blood pressure. Model 2 covariates were included in this analysis based on the suggested relationships depicted in a directed acyclic graph (see Supplementary material online, Figure S1). A second mediation analysis was conducted to determine whether associations may be mediated through later adulthood BMI, systolic blood pressure, non-HDL cholesterol, triglycerides, and glucose tolerance status. In addition to Model 2 covariates, variables that may be confounders of the mediator–outcome relationships were also included, such as smoking status (current, former, never), alcohol consumption (total abstainers, minimal alcohol consumption, moderate alcohol consumption, high alcohol consumption), meeting recommendations for daily vegetable and fruit intake (consuming at least 500 g/day), meeting physical activity recommendations (150 min of moderate-to-vigorous physical activity or 75 min of vigorous activity per week), and medication use (blood pressure- and cholesterol-lowering medication). These relationships are depicted in a directed acyclic graph (see Supplementary material online, Figure S2). The process user-defined macro (version 4.1.1) for R was used to determine the indirect effect estimate and 95% percentile bootstrapped confidence intervals based on 5000 simulations were generated. The indirect effect estimate was regarded as significant if the confidence interval did not contain zero.
Nonlinear relationships were evaluated by including quadratic terms of exercise capacity and muscle strength in the adjusted linear regression model (Model 1). The quadratic term for maximal exercise capacity was significant (P = 0.018). Restricted cubic spline regression was then used to further assess the associations of maximal exercise capacity with cIMT. Knots were placed, according to Harrell’ suggestion, at the 10th, 50th, and 90th centiles.23 The rms package (version 6.3–0) from R was used for this analysis.
Interactions were assessed between muscle strength and maximal exercise capacity as well as between each of these main exposures with early adulthood weight and BMI. No significant interactions were found.
A complete case analysis was conducted. We compared participants with missing data with those without (see Supplementary material online, Table S1). The groups did not differ significantly with regard to the outcomes, presence of plaques (P = 0.438), and cIMT (P = 0.524).
Further analyses include a secondary analysis that assessed the association of each of the muscle strength variables (handgrip, knee extension, and elbow flexion) with the presence of plaques and cIMT. Models were adjusted for the same covariates used in the main analysis. In the main analysis, we assumed that maximal exercise capacity and muscle strength were antecedent of BMI. However, BMI, body weight, or height may also be confounders in the associations of muscle strength and maximal exercise capacity with subclinical atherosclerosis. The following sensitivity analyses were therefore done: (a) including either early adulthood BMI, or (b) early adulthood weight, or (c) early adulthood weight and height in all the models, (d) in the event that data may be missing at random, we imputed missing values using the functional conditional specification multiple imputation approach. Twenty-five imputed datasets were generated, and estimates were combined using Rubin’s rules. Nonlinear associations were considered by using aregImpute from the Hmisc package (version 4.7–0) from R.
Stata 17.0 (StataCorp LP, College Station, TX, USA) was used to perform the analyses, unless otherwise indicated.
Results
Descriptive characteristics
At follow-up, 62% (n = 493) of the participants had plaques present and had a median cIMT of 0.78 mm [interquartile range (IQR) 0.23]. The characteristics at early and later adulthood stratified by low and high exercise capacity or muscle strength are given in Table 1. During early adulthood, 82% (n = 654) of the men had normal weight (BMI ≥18.5 and <25 kg/m2) and only 6% (n = 48) had overweight or obesity (BMI ≥25 kg/m2). Notably, men with high exercise capacity and high muscle strength were taller and with higher BMI compared with their counterparts with lower exercise capacity and lower muscle strength, a difference that remained during later adulthood. In addition, the men with high exercise capacity in early adulthood had higher HDL cholesterol, lower triglycerides, and were more likely to meet recommended physical activity recommendations in later adulthood compared with those with lower exercise capacity. Moreover, those with high exercise capacity were also more likely not to have plaques present (41.4%, n = 171) compared with men with low exercise capacity (34.6%, n = 133, P = 0.049).
Characteristics of participants at early (∼18 years of age) and later (after 40 years of follow-up) adulthood
| Maximal exercise capacity | Muscle strength | ||||||
|---|---|---|---|---|---|---|---|
| Total n = 797 | Low n = 384 | High n = 413 | P-valuea | Low n = 447 | High n = 350 | P-valuea | |
| Early adulthood | |||||||
| Height (cm) | 178.3 ± 6.5 | 176.8 ± 6.5 | 179.8 ± 6.2 | <0.001 | 177.0 ± 6.7 | 180.1 ± 5.9 | <0.001 |
| Weight (kg) | 67.0(11.0) | 63.0(9.0) | 70.0(11.0) | <0.001 | 63.0(9.0) | 70.0(10.0) | <0.001 |
| Body mass index (kg/m2) | 20.9(2.8) | 20.3(2.5) | 21.6(2.7) | <0.001 | 20.3(2.5) | 21.7(2.7) | <0.001 |
| Systolic blood pressure (mm/Hg) | 130.0(16.0) | 128.0(14.0) | 130.0(16.0) | 0.002 | 130.0(16.0) | 130.0(14.0) | 0.119 |
| Diastolic blood pressure (mm/Hg) | 72.0(14.0) | 70.0(14.0) | 72.0(14.0) | 0.862 | 72.0(12.0) | 72.0(14.0) | 0.318 |
| Muscle strengthb (n) | 2030.0(360.0) | 1940.0(340.0) | 2100.0(350.0) | <0.001 | 1870.0(220.0) | 2240.0(220.0) | <0.001 |
| Muscle strength (N/kg) | 30.4 ± 3.8 | 30.7 ± 3.7 | 30.1 ± 3.8 | 0.026 | 29.0 ± 3.3 | 32.1 ± 3.7 | <0.001 |
| Handgrip strength (n) | 610.0(120.0) | 590.0(120.0) | 630.0(110.0) | <0.001 | 570.0(80.0) | 680.0(90.0) | <0.001 |
| Elbow strength (n) | 390.0(90.0) | 370.0(80.0) | 410.0(100.0) | <0.001 | 360.0(70.0) | 440.0(80.0) | <0.001 |
| Knee strength (n) | 510.0(130.0) | 490.0(115.0) | 540.0(120.0) | <0.001 | 470.0(100.0) | 580.0(110.0) | <0.001 |
| Maximal exercise capacity (Watts) | 243.0(41.0) | 229.0(29.0) | 269.0(36.0) | <0.001 | 241.0(46.0) | 255.0(36.0) | <0.001 |
| Maximal exercise capacity (Watts/kg) | 3.7(0.6) | 3.5(0.4) | 4.0(0.7) | <0.001 | 3.8(0.6) | 3.7(0.7) | 0.002 |
| Later adulthood | |||||||
| Age (years) | 59.9(0.2) | 60.0(0.2) | 59.9(0.2) | 0.225 | 59.9(0.2) | 60.0(0.2) | 0.115 |
| Height (cm) | 178.5 ± 6.7 | 177.0 ± 6.6 | 179.8 ± 6.5 | <0.001 | 177.1 ± 6.9 | 180.2 ± 6.1 | <0.001 |
| Weight (kg) | 86.0(16.0) | 83.0(14.5) | 89.0(17.0) | <0.001 | 83.0(15.0) | 90.0(17.0) | <0.001 |
| Body mass index (kg/m2) | 27.0(4.5) | 26.8(4.8) | 27.4(4.8) | <0.001 | 26.6(4.4) | 27.8(4.9) | <0.001 |
| Waist circumference (cm) | 99.0(13.0) | 99.0(12.0) | 100.0(14.0) | 0.012 | 98.0(12.0) | 101.0(14.0) | <0.001 |
| Systolic blood pressure (mm/Hg) | 131.0(18.0) | 132.0(18.0) | 131.0(19.0) | 0.942 | 131.0(19.0) | 131.0(18.0) | 0.949 |
| Diastolic blood pressure (mm/Hg) | 84.0(11.0) | 83.0(12.0) | 84.0(10.0) | 0.189 | 83.0(12.0) | 84.0(10.0) | 0.129 |
| Total cholesterol (mmoL/L) | 5.5 ± 1.4 | 5.5 ± 1.4 | 5.4 ± 1.5 | 0.349 | 5.5 ± 1.1 | 5.4 ± 1.0 | 0.425 |
| HDL cholesterol (mmoL/L) | 1.2(0.4) | 1.2(0.4) | 1.2(0.4) | 0.022 | 1.2(0.4) | 1.2(0.4) | 0.823 |
| Non-HDL cholesterol (mmol/L) | 4.2(1.5) | 4.2(1.4) | 4.1(1.5) | 0.240 | 4.1(1.5) | 4.2(1.5) | 0.859 |
| Triglycerides (mmoL/L) | 1.4(0.9) | 1.4(1.0) | 1.3(0.8) | 0.016 | 1.4(0.9) | 1.4(0.8) | 0.949 |
| Education status (%) | 0.001 | 0.006 | |||||
| ȃBasic (1–9 schooling years) | 100(12.5) | 64(16.7) | 36(8.7) | 56(12.5) | 44(12.6) | ||
| ȃMiddle (10–12 schooling years) | 480(60.2) | 230(59.9) | 250(60.5) | 250(55.9) | 230(65.7) | ||
| ȃTertiary (≥13 years) | 217(27.2) | 90(23.4) | 127(30.8) | 141(31.5) | 76(21.7) | ||
| Diabetes status n (%) | 0.178 | 0.328 | |||||
| ȃNo diabetes | 608(76.3) | 285(74.2) | 323(78.2) | 338(75.6) | 270(77.1) | ||
| ȃIsolated or combined IFG/IGTc | 119(14.9) | 58(15.1) | 61(14.8) | 64(14.3) | 55(15.7) | ||
| ȃDiabetes | 70(8.8) | 41(10.7) | 29(7.0) | 45(10.1) | 25(7.1) | ||
| Smoking status n (%) | <0.001 | 0.354 | |||||
| ȃNever | 374(46.9) | 154(40.1) | 220(53.3) | 200(44.7) | 174(49.7) | ||
| ȃFormer | 328(41.2) | 185(48.2) | 143(34.6) | 190(42.5) | 138(39.4) | ||
| ȃCurrent | 95(11.9) | 45(11.7) | 50(12.1) | 57(12.8) | 38(10.9) | ||
| Alcohol consumption n (%) | 0.223 | 0.711 | |||||
| ȃTotal Abstainers | 33(4.1) | 19(4.9) | 14(3.4) | 19(4.3) | 14(4.0) | ||
| ȃMinimal alcohol consumption | 419(52.6) | 212(55.2) | 207(50.1) | 242(54.1) | 177(50.6) | ||
| ȃModerate alcohol consumption | 230(28.9) | 104(27.1) | 126(30.5) | 122(27.3) | 108(30.9) | ||
| ȃHigh alcohol consumption | 115(14.4) | 49(12.8) | 66(16.0) | 64(14.3) | 51(14.6) | ||
| Meeting daily fruit and vegetable consumption recommendations n (%) | 0.260 | 0.223 | |||||
| ȃNo | 598(75.0) | 295(76.8) | 303(73.4) | 328(73.4) | 270(77.1) | ||
| ȃYes | 199(25.0) | 89(23.2) | 110(26.6) | 119(26.6) | 80(22.9) | ||
| Meeting physical activity recommendations n (%) | 0.005 | 0.397 | |||||
| ȃYes | 437(54.8) | 191(49.7) | 246(59.6) | 251(56.2) | 186(53.1) | ||
| ȃNo | 360(45.2) | 193(50.3) | 167(40.4) | 196(43.8) | 164(46.9) | ||
| Hypertension status n (%) | 0.908 | 0.433 | |||||
| ȃNo hypertension | 301(37.8) | 140(36.5) | 161(39.0) | 179(40.0) | 122(34.9) | ||
| ȃControlled hypertension | 156(19.6) | 77(20.1) | 79(19.1) | 81(18.1) | 75(21.4) | ||
| ȃUncontrolled Hypertension | 154(19.3) | 76(19.8) | 78(18.9) | 86(19.2) | 68(19.4) | ||
| ȃHypertension without treatment | 186(23.3) | 91(23.7) | 95(23.0) | 101(22.6) | 85(24.3) | ||
| Family history of premature CVD n (%) | 0.925 | 0.521 | |||||
| ȃNo | 630(79.0) | 303(78.9) | 327(79.2) | 357(79.9) | 273(78.0) | ||
| ȃYes | 167(21.0) | 81(21.1) | 86(20.8) | 90(20.1) | 77(22.0) | ||
| Using medication with lipid effectsdn (%) | 0.788 | 0.118 | |||||
| ȃNo | 446(56.0) | 213(55.5) | 233(56.4) | 261(58.4) | 185(52.9) | ||
| ȃYes | 351(44.0) | 171(44.5) | 180(43.6) | 186(41.6) | 165(47.1) | ||
| Carotid intima media thickness (mm) | 0.78(0.23) | 0.78(0.22) | 0.78(0.23) | 0.658 | 0.78(0.23) | 0.78(0.24) | 0.543 |
| Presence of plaques n (%) | 0.049 | 0.508 | |||||
| ȃNo | 304(38.1) | 133(34.6) | 171(41.4) | 175(39.1) | 129(36.9) | ||
| ȃYes | 493(61.9) | 251(65.4) | 242(58.6) | 272(60.9) | 221(63.1) | ||
Normally distributed variables expressed as mean ± SD (early and late adulthood height and relative combined muscle strength). All other continuous variables are non-normally distributed and expressed as median (interquartile range).
P-values are derived from a Mann–Whitney U test for non-normally distributed continuous variables and an independent t-test for normally distributed continuous variables and from a χ2 test for categorical variables.
Muscle strength = (1.7×hand grip strength) + (1.3×knee extension) + (0.8×arm flexion).
IFG/IGT refers to impaired fasting glucose and impaired glucose tolerance.
Includes blood pressure- and cholesterol-lowering medication.
Associations of the presence of plaques with exercise capacity and muscle strength
Higher exercise capacity associated with 17% lower odds (odds ratio (OR) 0.83 [95% confidence interval (CI) 0.71–0.98, P = 0.024] of having plaques in later adulthood in Model 1, adjusted for education and a family history of premature CVD (Figure 1). This association remained after adjusting for muscle strength, P = 0.017 (Model 2). No significant association was found between muscle strength and the presence of plaques in any of the models (Figure 1).
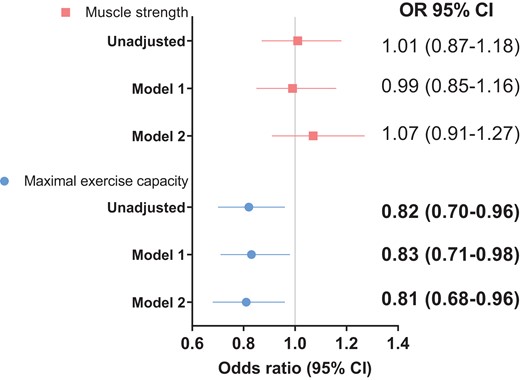
Associations of maximal exercise capacity and muscle strength with the presence of plaques. Model 1 was adjusted for education and premature CVD family history. Model 2 was adjusted for Model 1 covariates and including both maximal exercise capacity and muscle strength.
Associations of carotid intima media thickness with exercise capacity and muscle strength
We found a significant nonlinear association between exercise capacity and continuous cIMT, independent of muscle strength (nonlinear P-value = 0.027) but no significant association with dichotomized cIMT (Table 2). No significant associations were found between muscle strength and either continuous or dichotomized cIMT (Table 2).
Associations of exercise capacity (Watts) and muscle strength (N) with carotid intima media thickness (cIMT)
| cIMT continuous | cIMT ≥75th percentile | |||||
|---|---|---|---|---|---|---|
| Nonlinear P | OR | 95% CI | P-value | |||
| Maximal exercise capacity | ||||||
| Unadjusted | 0.035 | 0.98 | 0.81–1.17 | 0.794 | ||
| Model 1 | 0.029 | 0.97 | 0.81–1.15 | 0.701 | ||
| Model 2 | 0.027 | 0.91 | 0.75–1.11 | 0.363 | ||
| Slope | 95% CI | P | OR | 95% CI | P | |
| Muscle strength | ||||||
| Unadjusted | −0.0002 | −0.013 to 0.013 | 0.971 | 1.10 | 0.92–1.30 | 0.302 |
| Model 1 | 0.001 | −0.012 to 0.014 | 0.904 | 1.11 | 0.94–1.33 | 0.221 |
| Model 2 | −0.003 | −0.018 to 0.012 | 0.707 | 1.15 | 0.95–1.39 | 0.139 |
Slope is interpreted as per 1 SD, OR, odds ratio; CI, confidence interval.
Model 1: adjusted for education and premature CVD family history.
Model 2: adjusted for Model 1 covariates and including both maximal exercise capacity and muscle strength.
Mediation analysis
In the multi-mediator analysis, the association between exercise capacity and the presence of plaques was not mediated through early adulthood BMI and systolic blood pressure, the 95% confidence intervals of the total indirect effect contained zero, and the direct effect remained significant (OR 0.80, P = 0.011) (Table 3). Interestingly, the association of exercise capacity on the presence of plaques was mediated by the combination of later adulthood BMI, systolic blood pressure, non-HDL cholesterol, triglycerides, and glucose tolerance status [the total indirect effect was significant, and the direct effect was not significant (OR 0.85, P = 0.080)], but this association was not mediated by any single factor (Table 3).
Mediation analysis for the association between exercise capacity and the presence of plaques n = 797
| Indirect effect | Direct effect | ||||||
|---|---|---|---|---|---|---|---|
| Single-mediator analysis | Estimate | LLCI | ULCI | Estimate | LLCI | ULCI | P-value |
| Early adulthood mediators | |||||||
| BMI | 0.001 | −0.038 | 0.039 | −0.210 | −0.386 | −0.035 | 0.019 |
| SBP | 0.024 | 0.003 | 0.055 | −0.235 | −0.408 | −0.062 | 0.008 |
| Later adulthood mediators | |||||||
| BMI | −0.013 | −0.038 | 0.007 | −0.188 | −0.365 | −0.010 | 0.038 |
| SBP | −0.002 | −0.022 | 0.014 | −0.199 | −0.376 | −0.021 | 0.028 |
| Non-HDL cholesterol | −0.022 | −0.054 | 0.001 | −0.182 | −0.361 | −0.004 | 0.045 |
| Triglycerides | −0.004 | −0.025 | 0.010 | −0.196 | −0.373 | −0.019 | 0.030 |
| Glucose tolerance status | 0.004 | −0.007 | 0.019 | −0.204 | −0.381 | −0.027 | 0.024 |
| Multiple mediator analysis | |||||||
| Early adulthood mediators | |||||||
| BMI and SBP | 0.017 | −0.027 | 0.066 | −0.228 | −0.405 | −0.052 | 0.011 |
| Later adulthood mediators | |||||||
| BMI, SBP, non-HDL cholesterol, triglycerides, glucose tolerance status | −0.045 | −0.095 | −0.002 | −0.162 | −0.344 | 0.019 | 0.080 |
LLCI, lower limit confidence interval; ULCI, upper limit confidence interval; BMI, body mass index; SBP, systolic blood pressure.
Estimates are log-odds obtained from process, a user-defined macro from R, with 95% percentile bootstrapped confidence intervals, generated from 5000 simulations. Odds ratios can be obtained by exp(log-odds). The estimate for the multiple mediator analysis is the total estimate for the indirect effect based on more than one parallel mediator.
Early adulthood mediator models are adjusted for education, premature CVD family history, and muscle strength.
Later adulthood mediator models are adjusted for education, smoking status, alcohol consumption, premature CVD family history, meeting daily recommended vegetable and fruit intake, meeting recommended physical activity, medication use (blood pressure- and cholesterol-lowering), and muscle strength.
Secondary analysis
No significant associations were found of handgrip strength, knee extension, and elbow flexion with the presence of plaques or cIMT (see Supplementary material online, Tables S2 and S3).
Sensitivity analysis
In the multiple imputation analysis, the significant association of exercise capacity with the presence of plaques remained (see Supplementary material online, Table S4), but the nonlinear association with cIMT was no longer significant (see Supplementary material online, Table S5). The non-significant associations between muscle strength and subclinical atherosclerosis remained after missing values were imputed, except for the associations with dichotomized cIMT. Muscle strength associated with 21% increased odds of having a cIMT >75th percentile (OR 1.21, 95% CI 1.03–1.42, P = 0.018), independent of exercise capacity (see Supplementary material online, Table S5).
Including early adulthood BMI, as a possible confounder, in all models, did not alter the association between exercise capacity and the presence of plaques compared with the main complete case analysis (see Supplementary material online, Table S6). Contrastingly, adjusting for early adulthood weight alone (OR 0.84, P = 0.058, Model 2) or together with early adulthood height (OR 0.85, P = 0.072, Model 2) attenuated the estimates (see Supplementary material online, Table S6). The association between muscle strength and the presence of plaques remained non-significant regardless of adjusting for early adulthood BMI or weight alone or with height (see Supplementary material online, Table S6). After adjusting for early adulthood BMI, the nonlinear association of exercise capacity with cIMT was attenuated (nonlinear P = 0.051 in Model 2), but after inclusion of early adulthood weight alone or with height, the nonlinear association prevailed in Model 2 (see Supplementary material online, Table S7). The non-significant association with exercise capacity and cIMT ≥75th percentile was unaltered after adjusting for early adulthood BMI, weight alone, or with height (see Supplementary material online, Table S8). Adjusting for either early adulthood BMI or weight alone or with height did not change the non-significant association between muscle strength and cIMT (see Supplementary material online, Tables S7 and S8).
Discussion
This cohort study that followed men for approximately 40 years from early adulthood found that exercise capacity at early adulthood was consistently associated with a lower prevalence of carotid plaques at later adulthood independent of muscle strength. This beneficial association of exercise capacity on the presence of plaques was mediated through the combination of later, but not early, adulthood CVD risk factors. However, the associations of exercise capacity with cIMT and muscle strength with subclinical atherosclerosis were inconsistent.
There is a paucity of evidence from longitudinal studies on the association of exercise capacity with subclinical atherosclerosis, in particular the presence of plaques. A study conducted in Finnish men, 42–60 years of age, found that higher maximal exercise capacity associated with a slower progression of cIMT and plaque height after four years of follow-up.24 Our study extends these findings by showing that maximal exercise capacity as early as young adulthood (18–19 years old) may predict plaque development in ∼60-year-old men, adjusted for education and CVD family history.
The salutary effects of early adulthood exercise capacity on the presence of plaques in later adulthood may in part be explained by a reduction in the prevalence of traditional risk factors. Evidently, numerous studies have shown that higher exercise capacity lowers the risk of diabetes, hypertension, and dyslipidaemia.25 Also, higher exercise capacity is essential for maintenance of a favourable body composition.26 Indeed, the protective association between higher exercise capacity and the presence of plaques in our study was mediated by later adulthood BMI, systolic blood pressure, glucose tolerance status, non-HDL cholesterol, and triglycerides. Of note, the indirect effect was only significant in the later adulthood multi-mediator and not the single-mediator analysis, indicating an additive mediation effect. This may explain why none of the traditional CVD risk factors had a significant mediation effect on the association between physical activity and CVD incidence in 60-year-old Swedish men and women after 20 years of follow-up.27 We need to keep in mind that the mechanism that underlies the protective association of higher exercise capacity on the presence of plaques may involve multiple pathways of which only some were explored in this study. The balance between risk factors and counter factors may be important in the development of an atherosclerotic plaque.28 Higher exercise capacity may not only lower the triggers for atherosclerosis but may also enhance vascular repair ability. Endothelial injury is regarded as an integral step in the pathogenesis of atherosclerotic plaques.29 The effect of higher exercise capacity on vascular repair ability may also be through putative mechanisms such as maintaining or enhancing antioxidant ability and promoting an anti-inflammatory milieu.30 Indeed, exercise training has been shown to increase antioxidant activity as well as reduce the concentration of oxidized LDL.31 We therefore postulate that the long-term effects of a high exercise capacity during early adulthood may be due to an enhanced antioxidant ability and greater resilience against oxidative stress. In addition, favourable adaptations in the skeletal muscle and in the cardiorespiratory system, amongst others, may protect against the development of CVD risk factors and thus slow the progression of plaque formation. However, we should also consider that those with higher exercise capacity during early adulthood may also be more likely to maintain a healthier lifestyle over time.
The nonlinear association between exercise capacity and cIMT was inconsistent. After missing values were imputed, the nonlinear association was no longer significant. This suggests that the nonlinear association may have been an artefact driven by sparse data at the extremes. In addition, there was no association between exercise capacity and dichotomized cIMT. In contrast, a recent cross-sectional study showed an inverse association between exercise capacity and cIMT in Taiwan military recruits aged 18–40 years.32 However, a positive association was observed in a longitudinal study after 12 years of follow-up, with a greater cIMT found in those with higher exposure to moderate and vigorous physical activity.33 A higher cIMT may be due to atherosclerotic but also non-atherosclerotic processes such as exercise-induced sheer stress, which may explain the heterogeneity in findings, amongst others. Also, a higher cIMT may be more likely amongst those who maintain higher exercise capacity over time compared with those in whom exercise capacity may fluctuate.33 A possible reason for our null association may be that changes in exercise capacity over time may have obscured associations with cIMT.
Our study found no association between muscle strength and the presence of plaques and continuous cIMT. Although we found a positive association with cIMT ≥ the 75th percentile after missing values were imputed, this association was no longer significant after the inclusion of early adulthood BMI in an additional analysis. A few studies concur with our results, but others do not. No association was found between handgrip strength and cIMT in Indian and Japanese adults aged 40 years and older.34 Also in older men aged 73–91 years, handgrip and leg strength were not associated with cIMT and the presence of plaques at baseline,35 and in older women (56–62 years old), no association was found between sit-to-stand time, a proxy of lower body muscle strength, with cIMT and plaques.36 This is in juxtaposition to studies that have shown inverse associations between handgrip strength and cIMT.9,34,37 Notably, all these results are cross-sectional. Possible reasons for these discrepant findings may be due to the diverse study populations with varying underlying risk for atherosclerosis. Most of the studies that found no association were conducted in older people, while the two studies that found an inverse association were conducted in 21-year-old women9 and in children aged 11–12 years.37 Muscle strength associated with a lower risk of various CVD outcomes in longitudinal Swedish conscript studies, and the mean age of the participants at the end of follow-up was ∼45 years of age.16,38 In comparison, the median age in our cohort is 60 years of age. Age is the strongest predictor of atherosclerosis.28 In addition, age is also a major contributor towards the decline in muscle strength,39 most importantly from the age of 60 years.40 The benefits of high muscle strength present during early adulthood may therefore wane over time and as such confer less protection on the development of atherosclerosis, especially in people 60 years and older.
The strength of our study is its longitudinal design with a long follow-up. In addition, maximal exercise capacity and muscle strength at different locations were objectively measured. In the mediation analysis with later adulthood CVD risk factors, we were able to control for factors that may confound the association between the risk factors and the outcome such as alcohol consumption, smoking, medication use, consumption of fruit and vegetable intake, and habitual physical activity. Our study also had limitations. Due to the observational nature of this study, causality cannot be inferred. We did not repeat muscle strength and maximal exercise capacity in later adulthood and could therefore not control for changes in these variables. This needs to be addressed in future studies. Also, lipids during young adulthood were not measured, only at later adulthood, and we were unable to control for these. This study was done on Swedish men; our findings may therefore not be generalized to women or other populations.
Our study highlights the beneficial association of higher exercise capacity in early adulthood with subclinical atherosclerosis in later adulthood. It is therefore concerning that exercise capacity has been decreasing in the Swedish population over the last 20 years with the greatest decline seen in men and in those between 18 and 34 years of age.41 This worrying trend may threaten prevention efforts to lower or stabilize the CVD burden in the future. Thus, promoting activities to increase exercise capacity during early adulthood as well as over the life course that may slow the development of atherosclerosis and also CVD events should be regarded as a public health priority.
In conclusion, our results suggest that high exercise capacity, but not muscle strength, during early adulthood may protect against the development of plaques in men during adulthood, which were mediated through the combination of later adulthood traditional CVD risk factors. A concerted effort to optimize exercise capacity at an early age, such as advocating the incorporation of more high intensity activities during adolescence,42 is therefore imperative.
Authors’ contributions
M.N. and C.G. was involved in the conceptualization of the VIPVIZA trial. M.F.-d.S., F.B., C.G., A.H., M.N., M.W., and P.W. designed and planned the current study. M.F.-d.S. and P.W. drafted the manuscript and M.F. did the statistical analysis. All authors critically reviewed the manuscript and approved the final manuscript.
Margareta Norberg, Maria Wennberg, Patrik Wennberg, Andreas Hult, Melony C Fortuin-de Smidt, Frida Bergman, and Christer Grönlund
Supplementary material
Supplementary material is available at European Journal of Preventive Cardiology online.
Acknowledgements
We thank all the participants, the research nurses, Carola Sundholm and Maria Backlund, and the ultrasound technicians at the Department of Clinical Physiology, Heart Centre, Umeå University Hospital. We also acknowledge Wolfgang Lohr, the database manager, for his contribution and Per Liv for his statistical assistance on this project.
Funding
This study is funded by the Västerbotten County Council (Central ALF Dnr ALFVLL-298001, ALFVLL-643391), the Swedish Research Council (Dnr 521-2013-2708, 2016-01891), the Heart and Lung Foundation (Dnr 20150369, 20170481), and the Swedish Society of Medicine. An unconditional donation was received from Carl Bennet Ltd, Sweden. In addition to major grants, VIPVIZA was funded by the Heart Foundation in Northern Sweden; STROKE, the national association; the Foundation for Stroke Research in Northern Sweden; The Swedish Insurance Society, Visare Norr (the four Northern County Councils); and the Swedish and the Västerbotten Heart and Lung Associations.
Data availability
This study used military conscript data received from the National Archives Database and may not be shared with a third party. We also used the baseline data from the VIPVIZA trial. Data requests need to be submitted to the VIPVIZA steering committee for approval.
References
Author notes
Conflict of interest: All authors have nothing relevant to declare.

Comments