


Abstract
To provide a comprehensive overview of the current evidence on objectively measured neighbourhood built environment exposures in relation to cardiovascular disease (CVD) events in adults.
We searched seven databases for systematic reviews on associations between objectively measured long-term built environmental exposures, covering at least one domain (i.e. outdoor air pollution, food environment, physical activity environment like greenspace and walkability, urbanization, light pollution, residential noise, and ambient temperature), and CVD events in adults. Two authors extracted summary data and assessed the risk of bias independently. Robustness of evidence was rated based on statistical heterogeneity, small-study effect, and excess significance bias. Meta-meta-analyses were conducted to combine the meta-analysis results from reviews with comparable exposure and outcome within each domain. From the 3304 initial hits, 51 systematic reviews were included, covering 5 domains and including 179 pooled estimates. There was strong evidence of the associations between increased air pollutants (especially PM2.5 exposure) and increased residential noise with greater risk of CVD. Highly suggestive evidence was found for an association between increased ambient temperature and greater risk of CVD. Systematic reviews on physical activity environment, food environment, light pollution, and urbanization in relation to CVD were scarce or lacking.
Air pollutants, increased noise levels, temperature, and greenspace were associated with CVD outcomes. Standardizing design and exposure assessments may foster the synthesis of evidence. Other crucial research gaps concern the lack of prospective study designs and lack of evidence from low-to-middle-income countries (LMICs).
PROSPERO: CRD42021246580
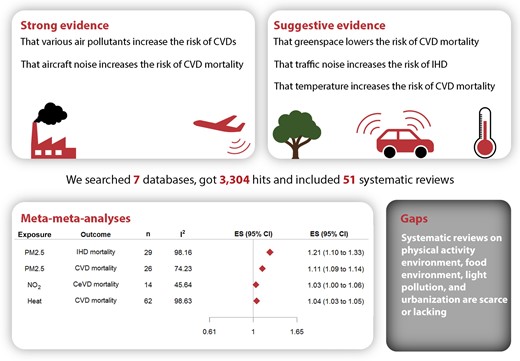
The built environment and cardiovascular disease. IHD, ischaemic heart disease; CeVD, cerebrovascular disease; CVD, cardiovascular disease.
Lay Summary
This study is a review of published systematic reviews on the relation between the neighbourhood built environment and cardiovascular disease (CVD) in adults.
There was strong evidence of a relation between increased air pollutants and a greater risk of CVD. There was also strong evidence of a relation between increased residential noise and a greater risk of CVD. There was highly suggestive evidence of a relation between increased ambient temperature and a greater risk of CVD.
Systematic reviews that examined other aspects of the built environment, such as the physical activity environment, food environment, light pollution, and urbanization, were scarce or lacking.
Introduction
Cardiovascular diseases (CVD) are the leading cause of the global disease burden.1 Worldwide CVD cases have doubled in the past 20 years. In 2019, 523 million cases led to 18.6 million deaths and 34.4 million years lived with disability.2 The burden of CVD is not only an individual health issue but also a societal burden that strains healthcare and economic systems. The World Heart Federation estimates that the global cost of CVD will rise from roughly $863 billion in 2010 to $1044 billion in 2030.3 Therefore, it is important to deepen our understanding of the determinants of CVD in individuals and populations and develop sustainable strategies for reduction and prevention.
Lifestyle behaviours, like physical inactivity and unhealthy diet, are important risk factors of CVD.1,2,4 Ecological models suggest that these behavioural risk factors are driven by contextual characteristics in the social, policy, and built environments, also known as ‘upstream determinants’.5–7 The paradigm in CVD research has shifted, with the focus moving to these upstream determinants as promising entry points for population-level action to prevent CVD.8 The majority of the world’s population resides and spends most of its time in highly organized built environments. The built environment is a subset of the exposome, which is the sum of all environmental drivers of health and disease throughout life.9 The built environment is defined as all aspects of a person’s surroundings that are man-made or modified, such as buildings, parks, facilities, and infrastructure.10 Its direct effects, like air pollution, noise levels, and ambient temperature, are often included.11
The mechanisms by which the built environment might affect CVD are not well established. Conceptually, there are two main pathways proposed.12 The first pathway is between active built environmental exposure and behavioural risk factors.12 For active exposure, one needs to actively use of the environment to be exposed. Attributes such as walkability, which is comprised of individual elements like sidewalks, connected streets, and proximity to key destinations, can facilitate a more active lifestyle.13,14 Access to and availability of certain food resources may either improve or diminish diet quality, depending on whether these food resources are greengrocers or fast-food outlets, for example.15 The second pathway is between passive built environmental exposure and CVD. This includes exposures that occur when one is simply present in the environment, such as air pollution, residential noise, and ambient temperature.12 Exposure to increased levels of air pollution can promote systemic inflammation and oxidative stress. As a result, a variety of pathological processes, such as increased thrombosis, hypercoagulability, and endothelial dysfunction, could eventually lead to CVD.16,17 Noise and ambient temperature may cause typical physiological responses including hypertension, vasoconstriction, and tachycardia that may lead to CVD.18,19
The two aforementioned pathways are not mutually exclusive, which increases complexity of research in this field.11 Many environmental aspects may be interrelated. For example, the benefits of living in a dense, walkable environment might be diminished by increased exposure to traffic-related air pollution.20 Attributes may also operate at multiple scales or contexts, from neighbourhoods to entire regions or from rural to urban areas. Consequently, the same built environmental aspects may have different effects from different perspectives or contexts. Urbanization, a context indicator of the urban development level, serves as a container of the abovementioned built environmental aspects. It is worthwhile to study urbanization as a proxy of a built environment and its confounding or interaction effect with other aspects. Furthermore, 55% of the world's population lives in urban areas, a proportion that is expected to increase to 68% by 2050.21 It is therefore relevant to understand what this means in terms of CVD risk.
Over the past two decades, a significant number of systematic reviews have examined the relationship between the built environment and CVD. However, these studies often address single (sub)domains of exposures, or the built environment was not the primary focus of the reviews. It is difficult for readers to assess and synthesize the piecemeal published evidence. As such, we aimed to provide a comprehensive overview of the current evidence, identify crucial research gaps, and determine the implications for public health, clinical medicine, policy, and regulation. To accomplish this, we conducted an umbrella review of systematic reviews and meta-analyses to investigate associations between the built environment and CVD events in adults. This review may also serve as a reference point for those who are new to the field.
Methods
The current umbrella review was conducted according to the protocol published in the International Prospective Register of Systematic Reviews (PROSPERO; ID CRD42021246580) and adheres to the guidelines of Transparent Reporting of Systematic Reviews and Meta-analyses (PRISMA) (see Supplementary material online, Appendix S1, for PRISMA checklist).
Literature search
We searched seven databases on 16 April 2021: Medical Literature Analysis and Retrieval System Online (MEDLINE), Excerpta Medica Database (EMBASE), Cumulative Index for Nursing and Allied Health Literature (CINAHL), Scopus, the Cochrane Database of Systematic Reviews (CDSR), the Joanna Briggs Institute (JBI) Database of Systematic Reviews and Implementation Reports, and PROSPERO. We built a search algorithm using search terms based on definitions and synonyms of the built environment, its attributes, and definitions of CVD events. A detailed search strategy for each database is presented in Supplementary material online, Appendix S2. We also screened the reference lists of the included reviews to identify additional eligible reviews.
Inclusion and exclusion criteria
We included systematic reviews of primary studies of the general population if they (i) reported on objectively measured long-term neighbourhood environmental exposures and covered at least one domain, including air pollution [e.g. particulate matter (PM), carbon monoxide (CO), nitrogen oxides (NO and NO2), sulphur dioxide (SO2), and ozone (O3)], food environment (e.g. neighbourhood fast-food outlet density), physical activity environment (e.g. greenspace and walkability), urbanization, light pollution (light at night), residential noise from road, rail, and/or air traffic, and ambient temperature; (ii) reported associations between these factors and CVD events [i.e. prevalence, incidence, or mortality of coronary heart disease (CHD), stroke, transient ischaemic attack (TIA), peripheral arterial disease (PAD), atrial fibrillation (AF), aortic disease, and heart failure (HF) but not congenital heart disease) in adults (i.e. ≥ 18 years); (iii) used a systematic literature search, i.e. a reproducible search strategy with search strings corresponding to databases; and (iv) were published between 1 January 2000 and 16 April 16 2021 in English. In the domain of temperature, the studies of short-term and long-term were mixed and meta-analysed in systematic reviews. Therefore, the criteria of long-term exposure were not applied too strictly for temperature.
We excluded reviews if they (i) only focused on specific populations such as children, pregnant women, CVD patients, or patients whose CVD risk may be influenced by other conditions (e.g. cancer, diabetes, and chronic renal failure); (ii) were published as conference abstracts, case reports, editorials, and letters to editors; (iii) reviewed studies on the indoor built environment (e.g. home environment), occupational environment (e.g. workplace environment), or subjective assessments of environmental characteristics (e.g. perceptions of neighbourhood safety); or (iv) only examined acute (short-term) exposure.
Study selection and data extraction
After removing duplicate records, two authors (M.L. and P.M.) screened all titles and abstracts independently. Then, these authors screened the full texts of potentially eligible articles separately and cross-checked a sample of each other’s work. Screening was done using Rayyan software, a non-commercial, web-based application.22 The two authors resolved any disagreements with discussion or, if no consensus could be reached, with discussion with other authors (T.M.L., E.J.T., I.V., and J.L.). Two authors (M.L. and P.M.) conducted the data extraction and verified each other’s work. For each eligible review, they extracted the following information: first author, year of publication, study design, study population, countries in which primary data were collected, exposure domain and type of environmental exposures, measures of the exposures, type and measure of the outcome studied, and summary of the (stratified) results. In the event that an included review was based on a meta-analysis, the following information was also extracted (where available): the pooled effect estimates and 95% confidence intervals (CIs), the effect size (ES) in the study with the largest study sample, the between-study heterogeneity using I²-statistic, the results of the Egger’s regression asymmetry test and excess statistical significance test, and the 95% prediction interval (PI).
Overlap of primary studies assessment
We assessed the overlap of primary studies across included reviews by a measure of corrected covered area (CCA).23 The first occurrence of a primary study in included reviews was defined as the index study. We created a cross-table of index studies and reviews for each built environmental domain (see Supplementary material online, Appendix S4). The CCA-score was categorized into limited overlap (score: 0–5), moderate overlap (score: 6–10), high overlap (score: 11–15), and very high overlap (score: > 15).23
Risk of bias assessment
We assessed the risk of bias in included systematic reviews using the validated Risk of Bias in Systematic Reviews (ROBIS) tool.24 Any disagreements in the assessment were resolved with discussion.
Statistical analysis
For the syntheses of quantitative research, we used statistical methods in accordance with the most up-to-date recommendations.25–28 Specifically, to rate the robustness of evidence for each review that reported pooled results from a meta-analysis, we considered the following statistics:
Statistical heterogeneity. The extent of statistical heterogeneity was evaluated using the I2-statistic. When the I2-statistic exceeded 50%, heterogeneity was considered large. We also evaluated heterogeneity using the 95% PI. This measure assesses the uncertainty of expected outcomes in new studies of the same association.29
Small-study effect. The small-study effect refers to the observation that studies that include smaller sample sizes tend to yield larger ES than studies with larger study samples. The potential reasons for this include publication bias, reporting bias, and real heterogeneity. The Egger’s regression asymmetry test was used to assess whether or not a small-study effect was present. A P value <0.10 with a more conservative effect in larger studies was considered evidence of small-study effect.30
Excess significance bias. This measure was used to evaluate whether there is evidence of an excessive number of studies with statistically significant results in the meta-analysis. It may result from reporting bias and data dredging.31 The excess statistical significance test was used, with a P value <0.10 considered to be evidence of excess significance bias.
When these statistics were not available, a re-estimate based on the ES of primary studies in the included review was conducted. In line with up-to-date recommendations, the level of robustness for each pooled result was based on the following criteria28:
Strong evidence: P value <10−6 of the pooled estimate of meta-analysis, > 1000 individuals of the total number of participants in the primary studies that were included in the review, P value <0.05 of the largest study in the meta-analysis, I2-statistic <50%, no evidence of small-study effects, no evidence of excess significance bias, and the null value does not fall in the 95% PI.
Highly suggestive evidence: P value <10−6 of the meta-analysis, > 1000 individuals in the review, and P value <0.05 of the largest study in the meta-analysis.
Suggestive evidence: P value <10−3 of the meta-analysis and > 1000 individuals in the review.
Weak evidence: P value <0.05 of the meta-analysis.
Within each category, all criteria had to be met.
We conducted meta-meta-analyses to combine the results from meta-analyses with comparable exposure and outcome.27 We selected meta-analyses with comparable study populations, exposure and outcome assessment methods, and measure of association [relative risk (RR) or hazard ratio (HR)]. By matching meta-analyses, we extracted the unique primary ES included in the pooled analyses. After the removal of duplicates, random-effect meta-analyses were conducted with restricted maximum likelihood approach for the estimation of variance components. The Wald method was used for estimating 95% CIs. Heterogeneity was investigated with the I2-statistic. The Egger’s regression asymmetry test was conducted to examine the small-study effect, and excess statistical significance was tested for. To account for variability of covariate adjustment, we conducted sensitivity analyses by only including primary ES with similar covariate adjustment sets. All statistical analyses were conducted with the metaphor package in R software.32,33
Results
Literature search results
The literature search identified 3304 unique publications (Figure 1). After screening all titles and abstracts, we excluded a total of 3164 studies. After reading the full texts, we included a total of 51 eligible. Additional details are presented in the PRISMA article selection process flow chart. A full list of included reviews is presented in supplementary material online, Appendix S3.
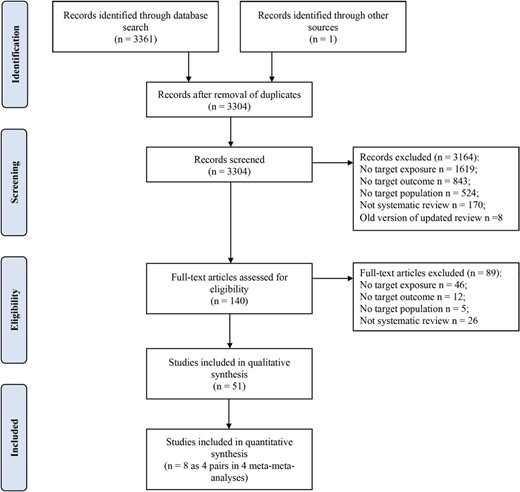
Flowchart of study selection.
Characteristics of included reviews
The characteristics and a summary of the results of all 51 included systematic reviews are presented in Table 1. The number of relevant primary studies included in the reviews ranged from 2 to 67. Most reviews (n = 43) were not restricted to specific countries or regions in the search, but most evidence was obtained in Europe (n = 43), East and South Asia (n = 38), and North America (n = 37); relatively few studies were based in South America (n = 10), Middle East (n = 8), Oceania (n = 8), and Africa (n = 6). A variety of designs were used in primary studies, including ecological studies, cohort studies, cross-sectional studies, case-control studies, case-crossover studies, small-area studies, panel studies, and time-series studies. Over one-third of the reviews (n = 20) included only longitudinal studies.
Summary of included systematic reviews (n = 51)
| First author and year by domaina | Population, year coverage, and country/region | Study design | Exposuresb | Summary of results | Percentage of results in expected direction | Quality assessment (ROBIS) |
|---|---|---|---|---|---|---|
| Air pollution | ||||||
| Alexeeff et al.34 | General population, till 31 December 2019, country not restricted: Europe, Canada, USA, UK, Australia, China, South Korea, and Israel | 42 CS | PM2.5 | Per 10 μg/m3 increase in long-term exposure, the pooled RRs and 95% CIs were 1.23 (1.15–1.31) for IHD mortality, 1.08 (0.99–1.18) for incident acute MI, 1.24 (1.13–1.36) for CeVD mortality, and 1.13 (1.11–1.15) for incident stroke. | 83% | High risk of bias |
| Atkinson et al. 2016 | General population, till October 2015, country not restricted: USA, UK, China (Taiwan), and France | Total 22 studies, relevant 8 studies: 8 CS | O3 | HRs expressed per 10 ppb increase in O3. For long-term annual O3 concentrations, the standardized effect estimates (HRs and 95% CIs) were 1.01 (0.99–1.03) for CVD mortality, 1.02 (1.00–1.04) for IHD mortality, and 1.01 (0.97–1.05) for stroke mortality. For long-term annual O3 concentrations, the random-effects summary estimates (HR and 95% CI) were 0.98 (0.93–1.04) for CVD mortality and 1.00 (0.92–1.09) for IHD mortality. For the warm season/peak O3, random-effects summary estimates were 1.01 (1.00 to 1.02). | 42% | High risk of bias |
| Atkinson et al.35 | General population, 1996–October 2016 (Medline, EMBASE), 1970–October 2016 (Web of Science), 1966–October 2016 (PubMed), country not restricted: Europe, North America, China (mainland and Taiwan), and Japan | Total 48 studies, relevant 22 studies: 22 CS | NO2 (annual or multi-year averages) | Per 10 µg/m3 increase in long-term exposure, the pooled HRs and 95% CIs were 1.03 (1.02–1.05) for CVD mortality, 1.05 (1.03–1.06) for CHD mortality, and 1.01 (0.98–1.03) for CeVD mortality. | 91% | High risk of bias |
| Chen et al. 2008 | Adults, 1 January 1950–31 December 2007, country not restricted: USA, Norway, France, the Netherlands, Canada, and Germany | Total 32 studies, relevant 17 studies: 14 CS, 3 CCS | O3, SO2, NO/NO2, black smoke, PM10, PM2.5, CO, benzene, and polycyclic aromatic hydrocarbons | RR per 10 µg/m3 increase. For PM2.5, the pooled RRs and 95% CIs were 1.14 (1.09–1.18) for CVD mortality and 1.16 (0.96–1.40) for CHD mortality. For other particulate and gaseous pollutants, the paucity of data precludes drawing conclusions. | 79% | High risk of bias |
| Chen et al. 2020 | General population, till 9 October 2018, country not restricted: Europe, Canada, UK, USA, Israel, New Zealand, South Korea, Japan, and China (mainland, Taiwan, and Hong Kong) | 67 CS | PM2.5 and PM10 | Per 10 µg/m3 increase in long-term PM2.5 exposure, the pooled RRs and 95% CIs were 1.11 (1.09–1.14) for CVD mortality, 1.16 (1.10–1.21) for IHD mortality, and 1.11 (1.04–1.18) for stroke mortality. The estimates of PM10 were 1.04 (0.99–1.10) for CVD mortality, 1.06 (1.01–1.10) for IHD mortality, and 1.01 (0.83–1.21) for stroke mortality. The certainty of evidence was high for PM2.5 and CVD mortality and was moderate for PM10 and CVD mortality, as measured by GRADE framework. | 81% | Low risk of bias |
| Chen et al.36 | General population, till October 2019, country not restricted: South Korea, UK, Denmark, Sweden, and Canada | Total 18 studies, relevant 6 studies: 6 CS | PM2.5, PM10, NO2, SO2, O3, and CO | Per 10 μg/m3 increase in long-term exposure, the pooled HRs, and 95% CIs of AF were 1.116 (1.031–1.207) for PM2.5, 1.034 (1.032–1.035) for PM10, 1.017 (1.001–1.033) for NO2, 1.005 (1.004–1.007) for SO2, 1.017 (1.013–1.022) for CO, and 1.007 (0.927–1.094) for O3. | 83% | Low risk of bias |
| Faustini et al. 2014 | General population, January 2004–January 2013, country not restricted: identified countries: Japan, China, Canada, USA, UK, Italy, Germany, Sweden, the Netherlands, and Norway | Total 23 studies, relevant 17 studies: 2 CCS, 15 CS | NO2 | RR per 10 µg/m3 increase. The pooled RRs and 95% CIs for CVD mortality were 1.13 (1.09–1.18) for NO2 and 1.20 (1.09–1.31) for PM2.5. | 94% | High risk of bias |
| Hak-Kan et al. 2013 | Chinese population, till 30 June 2012, 80 major Chinese cities in Mainland China, Hong Kong, and Taiwan | Total 48 studies, relevant 3 studies: 3 CS | PM10, NO2, SO2, and O3 | RR per 10 µg/m3 increase. In one cohort study examining PM10 and NO2, the corresponding RRs and 95% CIs were 1.0155 (1.0151–1.0160) and 1.0246 (1.0231–1.0263) for CVD mortality and 1.0149 (1.0145–1.0153) and 1.0244 (1.0227–1.0262) for CeVD mortality. In another cohort study examining SO2 and CVD, the corresponding RR was 1.032 (1.023–1.040). | 100% | High risk of bias |
| Hoek et al. 2013 | Not specified (adults), till January 2013, country not restricted: identified countries: USA, Germany, the Netherlands, Switzerland, Canada, China, New Zealand, Japan, Italy, France, and Denmark | Total 67 studies, relevant 34 studies: 34 CS | Long-term exposure to fine particulate matter (PM2.5, PM10, NO2, elemental carbon, and coarse particles) | RR per 10 µg/m3 increase. For PM2.5, the pooled RR and 95% CI was 1.11 (1.05–1.16) for CVD mortality. There was no consistent evidence that long-term exposure to coarse PM or elemental carbon is associated with CVD mortality. Several studies found positive associations between NO2 exposure and fatal MI, but not non-fatal MI. The evidence for an association between air pollution and CeVD mortality was inconsistent. | 88% | High risk of bias |
| Huang et al. 2021 | General population, till 2020.02.29, country not restricted: USA, Canada, Norway, the Netherlands, UK, Italy, Denmark, France, Spain, Japan, China, South Korea, Australia, Sweden, Norway, Germany, Austria, Switzerland, France, Italy, Spain, Greece, and Finland | 32 CS | NO2 | Per 10 ppb increase in annual NO2 concentration, the pooled HR and 95% CI was 1.11 (1.07–1.16) for cardiovascular mortality. | 71% | High risk of bias |
| Jadambaa et al.37 | Mongolian population (adults and children), till April 2014, Mongolia | Total 59 studies, relevant 2 studies: 2 CSS | NO2 and PM2.5 | Two studies found an increased risk of CVD with increased exposure to NO2 and PM2.5. | 100% | Unclear |
| Jaganathan et al.38 | General population, 1 January 1948–6 March 2018, country restricted to low- and middle-income countries, Mexico (Mexico City), Brazil (São José dos Campos, Cuiabá, and Várzea Grande), China, and India (Varanasi) | Total 17 studies, relevant 12 studies: 8 LS, 2 CSS, 1 CCR, 1 CS | PM2.5 (annual average or average measure of more than 3 days) | Eight out of nine studies (91%) reported significant effects on CVD mortality. Per 10 µg/m3 increase in long-term exposure, the effect estimates of CVD mortality ranged from 0.24 to 6.11%. All four studies reported significant effects of long-term exposure on CVD hospitalization. Few studies have evaluated this association in LMICs. No studies were found in North and Sub-Saharan Africa. | 92% | Low risk of bias |
| Kan et al. 2005 | General population, 1990–2002, China and worldwide | Total 26 studies, relevant 7 studies: 7 CS | Effects of particulate air pollution. PM10 was selected as the indicator particulate matter. | RR per 10 µg/m3 increase. For PM10, the pooled RRs and 95% CIs were 1.0095 (1.0060–1.0130) for CHA, 1.013 (1.007–1.019) for CHA based on four European studies, and 1.008 (1.004–1.011) for CHA based on three US and Canadian studies. | 100% | High risk of bias |
| Karimi et al. 2019 | Iran population, January 1980–January 2018, country restricted to Iran | Total 38 studies, relevant 28 studies: 27 CSS, 1 ES | O3, PM2.5, PM10, NO2, NOx, SO2, and CO measured by environmental protection organization and air quality control centre | Per 10 µg/m3 increase in all air pollutants, the pooled increased risk (95% CI) in CVD mortality was 0.5% (0.4–0.6%). The estimate for PM2.5 and PM10 was 0.7% (0.4–1%). | NA | Unclear |
| Liu et al. 2018 | General population, adults, January 1974–July 2017, country not restricted: USA, UK, Italy, Canada, China (mainland and Hong Kong), Europe, New Zealand, and Japan | 16 CS | PM2.5 and PM10 | Per 10 μg/m3 increase in long-term exposure, the pooled HRs and 95% CIs of CVD mortality were 1.12 (1.08–1.16) for PM2.5, 1.02 (0.89–1.16) for PM10, and 1.10 (1.06–1.14) for combined. In subgroup analyses, there is no difference in the association stratified by categories of WHO PM levels or smoking status. The estimates of PM2.5 were 1.19 (1.11–1.27) for studies with ≥ 11 years of follow-up, higher than those <11 years: 1.07 (1.04–1.11). | 88% | Low risk of bias |
| Lu et al. 2015 | Chinese population (adults only), 1990–2013, Mainland China, Hong Kong, and Taiwan | Total 59 studies, relevant 2 studies: 2 CS | PM10 and PM2.5 | RR per 10 μg/m3 increase. For the annual average concentration of PM10, the RR and 95% CI was 1.23 (1.19–1.26) for CVD mortality in one study and 1.55 (1.51–1.60) for CVD mortality in another study. | 100% | High risk of bias |
| Luben et al. 2017 | Adults, till 15 June 2017, country not restricted: USA, China (mainland and Taiwan), the Netherlands, Canada, South Korea, Spain, and Italy | Total 24 studies, relevant, 3 studies: 2 CS, 1 LS | Ambient black carbon | There are generally modest, positive associations of long-term exposure to black carbon and elemental carbon with cardiovascular hospital admissions and mortality. | 100% | High risk of bias |
| Niu et al. 2021 | General population, till 1 February 2020, country not restricted: China, Europe, England, Japan (Shizuoka), USA (California), Ghana, India, Mexico, Russia, and South Africa | Total 68 studies, relevant 13 studies: 13 CS | PM2.5, PM10, and NO2 | Per 10 μg/m3 increase in long-term exposure, the pooled HRs and 95% CIs of stroke incidence were 1.081 (0.971–1.023) for PM2.5, 1.033 (0.907–1.175) for PM10, and 1.005 (0.977–1.034) for NO2; the HRs and 95%CI of stroke mortality were 1.047 (0.995–1.101) for NO2. | 82% | High risk of bias |
| Prueitt et al.39 | General population, 1 January 2006–4 November 2013, country not restricted: USA, UK, Canada (Toronto), and China (Liaoning) | Total 25 studies, relevant 11 studies: 8 CS, 2 CSS, 1 ES | O3 | For long-term O3 exposure and CVD morbidity, studies were rare and reports were inconsistent. For CVD mortality, of 10 high-quality studies, 5 reported positive association, and the other 5 reported null or negative association. | 17% | High risk of bias |
| Scheers et al. 2015 | General population, till 20 July 2015, country not restricted: Japan, China, UK, the Netherlands, Switzerland, Greece, USA, Canada, Finland, Norway, Sweden, Denmark, Germany, Austria, Italy, Greece, and France | Total 20 studies, relevant 20 studies: 14 CS, 6 ES | PM10 or PM2.5 | HR per 10 μg/m3 increase. For PM10, the pooled HRs and 95% CIs were 1.061 (1.018–1.105) for overall stroke events and 1.080 (0.992–1.177) for stroke mortality. For PM2.5, the pooled HRs and 95% CIs were 1.064 (1.021–1.109) for overall stroke events and 1.125 (1.007–1.256) for stroke mortality. | 50% | High risk of bias |
| Shin et al. 2014 | Not specified (adults), from 1990, country not restricted: USA and UK | Total 20 studies, relevant 4 studies: 4 CS | PM2.5 | RR per 10 μg/m3 increase. In the frequentist meta-analysis, the pooled RR and 95% CI for long-term exposure to PM2.5 was 1.06 (1.00–1.13) for non-fatal strokes. The Bayesian meta-analysis found a posterior mean 1.08 (0.96–1.26) from a normal prior and 1.05 (1.02–1.10) from a gamma prior. | 100% | High risk of bias |
| Stieb et al.40 | General population, till 25 February 2020, country not restricted: Canada, USA, UK, Europe, China (mainland, Hong Kong, and Taipei), Australia, South Korea (Seoul), and Japan (Shizuoka) | 49 CS | NO2 | Per 10 ppb increase in long-term exposure, the pooled HRs and 95% CIs were 1.139 (0.997–1.301) for CVD mortality, 1.128 (1.076–1.182) for IHD mortality, and 1.167 (0.936–1.456) for CeVD mortality. After excluding studies with probably high or high risk of bias, the pooled HRs and 95% CIs were 1.058 (1.026–1.091) for CVD mortality, 1.111 (1.079–1.144) for IHD mortality, and 1.014 (0.997–1.032) for CeVD mortality. | 74% | Low risk of bias |
| Wang et al. 2020 | Older adults aged ≥ 55 years, till January 2020, country not restricted: USA (Steubenville, Eastern Massachusetts, Boston), Germany (Erfurt), Finland (Helsinki), the Netherlands (Amsterdam), UK (Scotland: Aberdeen), and China (Beijing and Taipei) | Total 19 studies, relevant 10 studies: 10 LS | Concentration of PM2.5 | Per 10 mg/m3 increase in long-term exposure, the pooled estimates and 95% CIs of HRV were −0.92% (−2.14 to 0.31%) for SDNN, −1.96% (−3.48 to −0.44%) for RMSSD in time-domain measurements, −2.78% (−4.02 to −1.55%) for LF, and −1.61% (−4.02 to 0.80%) for HF in frequency domain measurements. | 68% | High risk of bias |
| Yang et al. 201941 | General population, till 25 April 2018, country not restricted: Europe, UK, Canada, USA, South Korea, China, Ghana, India, Mexico, Russia, South Africa, and Japan | 35 CS | PM2.5, PM10, O3, and NO2 | Per 10 μg/m3 increase in long-term PM2.5 exposure, the pooled RRs and 95% CIs were 1.11 (1.07–1.15) for CVD events, 1.12 (1.05–1.19) for stroke incidence, 1.12 (1.08–1.16) for stroke events, 1.19 (1.09–1.30) for IHD incidence, and 1.14 (1.08–1.21) for IHD events. The estimates of CVD mortality were 1.11 (1.07–1.15) for PM2.5, 1.09 (1.02–1.16) for PM10, 1.23 (1.15–1.31) for NO2, and 1.03 (1.02–1.05) for O3. The estimates of NO2 and IHD events were 1.05 (1.04–1.06). No significant associations were found between PM10 and CVD, stroke and IHD incidence. | 87% | High risk of bias |
| Yuan et al. 2019 | General population, 1980–December 2018, country not restricted: Europe, USA, China (Hong Kong), Ghana, India, Mexico, Russia, South Africa, UK, Sweden (Gothenburg), and Italy | 16 CS | PM2.5 | Per 5 μg/m3 increase in long-term exposure, the pooled HRs and 95% CIs were 1.11 (1.05–1.17) for stroke incidence and 1.11 (1.05–1.17) for stroke mortality. In subgroup analysis, the estimates of stroke incidence were 1.09 (1.05–1.14) for North America (5 CS), 1.07 (1.05–1.10) for Europe (4 CS), and 2.31 (0.49–10.95) for Asia (2 CS). The associations were insignificant in both sex and significant in both ischaemic and haemorrhagic stroke. The estimates of stroke incidence were 1.08 (1.03–1.13) for never smokers, 1.11 (1.01–1.22) for former smokers, and 1.08 (0.94–1.25) for current smokers. | 95% | Low risk of bias |
| Zhao et al. 2017 | General population, 1990–2016, country not restricted: USA, Israel, Japan, UK, China, Italy, Norway, Greece, Canada, Denmark, France, South Korea, Iran, Germany, Finland, Sweden, Spain, and the Netherlands | Total 48 studies, relevant 48 studies: 25 CS, 23 LS | PM10, PM2.5, SO2, NO2, CO, and O3 | HR per 10 μg/m3 increase. For CHD mortality, the pooled HRs and 95% CIs were 1.12 (1.04–1.20) for PM10, 1.17 (1.12–1.22) for PM2.5, 1.03 (1.00–1.07) for SO2, 1.04 (1.01–1.06) for NO2, 1.04 (0.98–1.10) for CO, and 1.06 (1.01–1.11) for O3 (10 mg/m3 increase). For CHD incidence, the pooled HRs and 95% CIs were 1.01 (1.00–1.02) for PM10, 1.02 (1.00–1.03) for PM2.5, 1.01 (1.00–1.02) for SO2, 1.04 (1.03–1.06) for NO2, 1.01 (0.97–1.04) for O3, and 1.03 (1.00–1.05) for CO (10 mg/m3 increase). | NA | High risk of bias |
| Zhao et al. 2021 | General population, time and country not restricted: China, Norway, UK, the Netherlands, China (Hong Kong), and Canada (Ontario) | 7 CS | PM2.5 acquired through satellite-based model (5 studies) and outdoor-automated monitoring stations (2 studies) | Per 1.4–10 μg/m3 increase in long-term PM2.5 exposure, the pooled HRs and 95% CIs of haemorrhagic stroke were 1.16 (1.03–1.30) for total, 1.41 (0.92–2.15) for current smoker, and 1.04 (0.74–1.46) for never and former smoker. | 71% | Low risk of bias |
| Zhu et al. 2021 | General population, till 2 August 2020, country not restricted: Canada, Denmark, the Netherlands, China, USA, South Korea, Israel, and UK (London) | 12 CS | PM2.5 | Per 10 μg/m3 increase in long-term PM2.5 exposure, the pooled HRs and 95% CIs were 1.10 (1.02–1.18) for MI incidence and 1.07 (1.04–1.09) for post-MI mortality. | 75% | Unclear |
| Zou et al.42 | General population, till September 2019, country not restricted: USA, South Korea, UK, Canada, Sweden, Israel, Italy, the Netherlands, Switzerland, and Finland | 27 CS | PM2.5 and PM10 | Per 10 μg/m3 increase in long-term exposure, the pooled RRs and 95% CIs of MI were 1.18 (1.11–1.26) for PM2.5 and 1.03 (1.00–1.05) for PM10. | 91% | Unclear |
| Physical activity environment | ||||||
| Gascon et al. 2016 | Adults, till 14 November 2014, country not restricted: USA, UK, New Zealand, Lithuania, and Canada | Total 12 studies, relevant 8 studies; 4 ES, 2 CS, 1 CSS | Residential natural outdoor environments, particularly green and blue spaces | For each 10% increase of greenness, the RR and 95% CI was 0.993 (0.985–1.001) for CVD mortality. For high vs. low categories of greenness, the RR and 95% CI was 0.96 (0.94–0.97) for CVD mortality. | 75% | Unclear |
| Twohig-Bennett et al.43 | General population, till January 2017, country not restricted: USA, UK, and Lithuania | Total 143 studies, relevant 4 studies: 3 CS, 1 ES | Greenspace measured by residential NVDI, distance to the nearest greenspace, and proportion of city area covered by green land | Comparing higher to lower greenspace exposure, the pooled ORs and 95% CIs were 0.82 (0.61–1.11) for stroke (3 studies), 0.84 (0.76–0.93) for CVD mortality (2 studies), and 0.92 (0.78–1.07) for CHD (2 studies). | 86% | High risk of bias |
| Yuan et al. 2020 | Older adults (mostly ≥ 60 years), 1 January 2000–1 July 2020, country not restricted: Japan, Canada, USA, Finland, China, Rome, Australia, the Netherlands, Lithuania, Brazil, Israel, South Korea, Iran, and UK | Total 22 studies, relevant 17 studies:12 CS, 5 CSS | Greenspace measured by NDVI (mostly), percent of greenspace coverage, distance to the nearest green space, park visitation and length of stay, and loss of trees from emerald ash bore disease | Of 8 studies in total CVD, 7 found beneficial effects of green space, and the other study showed a lower risk of CVD with higher percentage of tree canopy, but not total green space. Evidence for stroke and MI was less consistent. Only cohort studies measuring NDVI and mortality were included in meta-analysis. Per 0.1 unit increase in NDVI, the pooled HRs and 95% CIs were 0.99 (0.89–1.09) for CVD mortality, 0.96 (0.88–1.05) for IHD mortality, and 0.77 (0.59–1.00) for stroke mortality. | 67% | Low risk of bias |
| Urbanization | ||||||
| Angkurawaranon et al.44 | Southeast Asian populations, till April 2013, SE Asia countries: Brunei Darussalam, Cambodia, Indonesia, Laos PDR, Malaysia, Myanmar, Philippines, Singapore, Thailand, Timor Leste, and Vietnam | Total 37 studies, relevant 7 studies: 7 CSS | Urban exposure | For urban exposure, the pooled ORs and 95% CIs were 1.01 (0.56–1.82) for stroke, 1.19 (0.35–4.07) for non-specific heart disease in the elderly, 2.48 (1.20–5.11) for CHD, and 0.31 (0.13–0.76) for RHD. | 56% | Unclear |
| Residential noisec | ||||||
| Babisch et al.45 | Not specified (adults), time and country not restricted: identified countries: UK, the Netherlands, Canada, Denmark, Germany, Sweden, and Japan | 5 CS, 4 CCS, 5 CSS | Road traffic noise. L Aeq16hr, L Aeq24hr, L DEN, LDay, LNight | Relative risk per increase of the traffic noise level of 10 dB. For road traffic noise, the pooled OR and 95% CI was 1.08 (1.04–1.13) for CHD. | 71% | High risk of bias |
| Banerjee et al. 2014 | Adult population, 1980–2010, country not restricted: the Netherlands, UK, Germany, Serbia, Sweden, Austria, Italy, Lithuania, Portugal, Switzerland, France, Slovakia, and Hungary | 14 CSS | Transportation noise exposure | (No information on unit) For traffic noise (all sources), the pooled RRs and 95% CIs were 1.04 (0.96–1.12) for CVD, 1.01 (0.89–1.14) for MI, 1.08 (0.80–1.36) for AP, and 1.00 (0.73–1.26) for IHD. The estimates for air traffic noise exposure were 1.00 (0.91–1.09) for CVD, 1.04 (0.80–1.28) for AP, 1.02 (0.89–1.14) for MI, and 0.96 (0.80–1.12) for IHD. The pooled RR for road traffic noise was 1.03 (0.97–1.09) for CVD, 1.23 (0.38–2.09) for AP, 0.85 (−0.58 to 2.29) for MI, and 1.35 (0.78–1.92) for IHD. | 73% | High risk of bias |
| Cai et al. 2021 | Adults, general population, 1 January 2000–5 October 2020, country not restricted: Denmark (Copenhagen and Aarhus), France (Paris, Lyon, and Toulouse), Switzerland, Sweden (Gothenburg), Spain (Barcelona), the Netherlands, UK (London), and Canada (Vancouver) | Total 12 studies, relevant 10 studies: 8 CS, 1 CSS, 2 ES | Residential traffic noise from road, rail, and aircraft, measured or modelled: mostly Lden, LAeq24hr, LAeq16hr, LDN, Lday, Lnight | For road traffic, per 10 dB increase in Lden, the pooled HRs and 95% CIs were 1.01 (0.98–1.05) for CVD mortality, 1.03 (0.99–1.08) for IHD mortality, and 1.05 (0.97–1.14) for stroke mortality. For aircraft traffic, the estimates based on three studies were 1.17 (1.10–1.25) for CVD mortality, 1.03 (0.82–1.29) for IHD mortality, and 1.06 (0.93–1.20) for stroke mortality. For rail traffic, the estimates were 0.98 (0.94–1.01) for CVD mortality (1 study) and 1.02 (0.91–1.14) for IHD mortality (2 studies). | 68% | Unclear |
| Dzhambov et al. 2016 | Adults, till 24 November 2015, country not restricted: the Netherlands, UK, Denmark, Germany, France, Switzerland, USA, Canada, Sweden, Greece, and Italy | 7 CS, 2 CSS, ES 4 | Traffic noise | RR per 10 dB noise increase. For road traffic noise, the pooled RR and 95% CI was 1.03 (0.87–1.22). For air traffic noise, the pooled RR was 1.05 (1.00–1.10). | 72% | High risk of bias |
| Khosravipour et al. 2020 | General population, time and country not restricted: till 29 November 2019, UK, Germany, Sweden, Lithuania, Denmark, and the Netherlands | 7 CS, 5 CCS, 1 CSS | Road traffic noise | Comparing highest to lowest category of noise exposure (results from categorical analysis), the pooled RR and 95% CI of MI were 1.03 (0.93–1.13). Per 10 dB increment (results from exposure–response analysis and transformed from categorical analysis), the pooled estimate was 1.02 (1.00–1.05). In subgroup analysis, pooled estimates were significant for CCS and CSS, but not for CS. Estimates for the exposure–response analyses were 1.03 (1.00–1.05) after excluding two conference papers and 1.02 (1.01–1.03) after further excluding the studies with only results from categorical analysis. | 57% | Low risk of bias |
| van Kempen et al. 2002 | Adults, 1970–1999, country not restricted: Iran, Belgium, Germany, Canada, India, Finland, Italy, the Netherlands, Russia, USA, Poland, Japan, Israel, China, France, South Africa, China (Taiwan), and UK. | Total 43 studies, relevant 10 studies: 6 CSS, 2CCS, 2 CS | Community noise exposure (road and air traffic) assessed by calculations, personal dosimeter, or sound level meter | RR per 5 dB(A) noise increase. For road traffic noise, the pooled RRs and 95% CIs were 1.09 (1.05–1.13) for IHD, 0.99 (0.84–1.16) for AP, and 1.03 (0.99–1.09) for MI. For air traffic noise, the pooled RR was 1.03 (0.90–1.18) for AP. | 25% | High risk of bias |
| van Kempen, et al.46 | European, 2000–October 2014, European countries | Total 61 studies, relevant 32 studies: 14 CSS, 5 ES, 8 CS, 5 CCS | Noise from road, rail, and air traffic and wind turbines: LDEN | Road, rail, and air traffic noise in relation to prevalence, incidence, and mortality of IHD and stroke were analysed, respectively. Number of studies for each analysis is small. Per 10 dB increase in exposure, the pooled RR and 95% CI of IHD was 1.08 (1.01–1.15) for road traffic. Estimates for other associations were of low quality or from <3 studies, and mostly insignificant. | NA | Low risk of bias |
| Vienneau et al.47 | Not specified (general population), January 1994–January 2014, country not restricted: Germany, UK, the Netherlands, Sweden, Switzerland, Denmark, Canada, and USA | 3 CCS, 5 CS, 2 LS | Transportation noise exposure | RR per 10 dB increase in exposure. The pooled RR and 95% CI for IHD was 1.06 (1.03–1.09). | 75% | High risk of bias |
| Weihofen et al.48 | General population, till 31 August 2017, country not restricted: USA, France (Paris, Lyon Saint, and Toulouse), Canada (Vancouver), UK (London), Switzerland, Germany (Berlin and Frankfurt), the Netherlands (Amsterdam), Sweden (Stockholm), Greece (Athens), and Italy (Milan) | 3 CSS, 1 ES, 4 CS, 1 CCS | Aircraft noise: LAeq, LDay, LNight, LDN, Lden, LDENAEI | Per 10 dB increase in Lden, the pooled RR and 95% CI of stroke was 1.013 (0.998–1.028) from seven studies. | 71% | Low risk of bias |
| Ambient temperature | ||||||
| Bunker et al.49 | Elderly (65+), 1 January 1975–24 July 2015, country not restricted: USA, Bangladesh, China (mainland, Taiwan, and Hong Kong), Portugal, UK, Denmark, Australia, Russia, Italy, Hungary, Brazil, Vietnam, Sweden, Thailand, Norway, South Korea, and Germany | Total 60 studies, relevant 47 studies; 47 LS | Ambient hot and cold temperature | Per 1°C temperature change, for heat, the pooled percentage changes and 95% CIs were 3.79 (3.40–4.18) for CVD mortality, 1.62 (0.24–3.03) for IHD mortality, 1.40 (0.06–2.75) for CeVD mortality, 0.33 (−0.09 to 0.75) for IS, −0.66 (−2.13 to 0.84) for ICH, −0.17(−0.96 to 0.63) for CeVD, −0.16(−2.05 to 1.77) for MI, and 0.30(−0.12 to 0.81) for CVD. For cold, the estimates were 1.84 (0.85–2.84) for CVD mortality, 0.45 (−0.01 to 0.91) for IHD mortality, 1.21 (0.66–1.77) for CeVD mortality, 3.63 (−3.94 to 11.8) for IS, 1.49 (1.04–1.94) for ICH, −0.46 (−1.12 to 0.2) for CeVD, 0.66 (−0.14 to 1.48) for MI, −0.80 (−2.21 to 0.64) for AP, −0.67 (−2.15 to 0.83) for HF, and −0.28 (−1.39 to 0.84) for CVD. | 73% | High risk of bias |
| Kofi Amegah et al. 2016 | Sub-Saharan African populations, till December 2014, Sub-Saharan Africa | Total 23 studies, relevant 5 studies: 4 LS, 1 CSS | Temperature | One study found that low temperature was associated with increased risk of CVD. Two studies found associations of low and high temperatures with CVD mortality. One study found no association between mean monthly temperature and CVD mortality. One study found 5°C change in the monthly mean temperature to be associated with decreased risk of hospitalization for venous thromboembolism, stroke, and acute MI. | 56% | High risk of bias |
| Ma et al. 2020 | Chinese population, January 2010–January 2020, country restricted to China | Total 175 studies, relevant 19 studies: 19 LS | (i) Every 1°C temperature increase/decrease beyond certain reference points (ii) Comparison between extreme temperatures and reference normal temperatures | Pooled RRs and 95% CIs of CVD were 1.089 (1.062–1.116) and 1.171 (1.125–1.218), respectively, for hot and cold temperatures as compared with normal temperatures. | 100% | High risk of bias |
| Moghadamnia et al.50 | General population, January 2000–31 December 2015, country not restricted: China (mainland, Taiwan, and Hong Kong), Australia, Thailand, Philippines, South Korea, Germany, and Spain | 26 LS | Ambient temperature | RR per 1°C change of temperature. For CVD mortality, the RRs and 95% CIs were 1.055 (1.050–1.060) for cold exposure and 1.013 (1.011–1.015) for heat exposure. Coefficient per 1°C change in mean annual temperature. For CVD mortality, the pooled estimates were 0.026 (−0.019 to 0.072) for cold exposure and 0.008 (−0.015 to 0.031) for heat exposure. | 96% | High risk of bias |
| Odame et al. 2018 | Rural population, till April 2018, country not restricted: Bangladesh (MATLAB), Czech Republic, and China (Naidong and Jiangzi in Tibet) | All 14 studies, relevant 3 studies: 3 LS | Daily mean temperature | Per 1°C increase, the pooled RR and 95% CI of CVD mortality was 1.111 (1.045–1.181). The associations were significant in subgroup analyses of both developing and developed countries. | 100% | High risk of bias |
| Turner et al. 2012 | Not specified (general population), time and country not restricted: South Korea (Incheon), USA, UK (London and Scotland), Europe, Australia (Brisbane), and Thailand (Muang) | Total 21 studies, relevant 18 studies: 18 LS | Effects of ambient temperature. Maximum, minimum, and mean daily temperature | RR per 1°C increase in temperature. The pooled RRs and 95% CI were 0.999 (0.982–1.016) for CVD morbidities, 0.990 (0.887–1.105) for stroke, and 1.010 (0.930–1.097) for ACS/MI. | 43% | High risk of bias |
| Wang et al. 2016 | Adults, till 16 October 2015, country not restricted: Japan, UK, Russia, Spain, China, Portugal, Italy, South Korea, China (Taiwan), Mozambique, USA, France, and Australia | 7 CS, 13 LS, 1 CSS | Ambient temperature | OR per 1°C increase in mean ambient temperature. The pooled ORs and 95% CIs were 0.97 (0.94–1.00) for ICH, 1.00 (0.99–1.01) for IS, and 1.00 (0.98–1.01) for SAH. The pooled estimates for ambient minimum and maximum temperature and IS were OR 0.99 (0.96–1.01) and 0.98 (0.94–1.02), respectively. | 19% | Unclear |
| Zafeiratou et al. 2021 | General population, 1990–2020, country not restricted: Serbia (Belgrade), China (Hong Kong), UK (London), USA (New England), Finland (Helsinki), Switzerland, and South Korea | Total 34 studies, relevant 6 studies: 4 ES, 2 CS | Mean annual temperature or variability, seasonal temperature or variability, annual temperature categories, and mean annual degrees above/below minimum mortality temperature | In temporal comparisons within the same area, increased cardiovascular mortality was associated with both increased and decreased temperature. Stronger association was found with cold rather than hot temperature. In geographical comparison in just one study, people living in areas with higher temperature were found a lower rate of IHD mortality, though no dose–response. | 5 studies on CVD mortality: 60% | High risk of bias |
| Multiple domains | ||||||
| Rugel et al. 2020 | Urban residents, 1 January 2003–November 2019, country not restricted: the Netherlands, Sweden (Skåne), UK (London), Canada, Denmark (Copenhagen and Aarhus), Germany (Bochum, Essen, and Mülheim/Ruhr), South Korea (Seoul, Ulsan, and Cheonan), France, Spain, Norway, Greece, Italy (Rome and Verona), Switzerland, USA (California), and China (Shenyang, Anshan, Jinzhou, and Taiwan) | Total 51 studies, relevant 21 studies: 15 CS, 5 CSS, 1 ES | Traffic-related air pollution; natural spaces, neighbourhood walkability; noise | Based on the Grading of Recommendations, Assessment, Development, and Evaluation (GRADE) system for assessing the quality of the synthesized evidence base, evidence was sufficient for higher noise exposure with increased CVD. And evidence was sufficient for no association between traffic-related air pollution and CVD. | NA | High risk of bias |
ES, ecological studies; CS, cohort studies; CSS, cross-sectional studies; CCS, case-control studies; CCR, case-crossover studies; SAS, small-area studies; longitudinal study, LS (e.g. panel study and time-series); RR, relative risk; HR, hazard ratio; MI, myocardial infarction; AP, angina pectoris; CHA, cardiovascular hospital admission; ACS, acute coronary syndrome; CVD, cardiovascular disease; CHD, coronary heart disease; AF, atrial fibrillation; IHD, ischaemic heart disease; CeVD, cerebrovascular disease; RHD, rheumatic heart disease; HRV, heart rate variability; SDNN, the standard deviation of NN intervals; RMSSD, root mean square of successive RR interval differences; LF, low-frequency bands; HF, high-frequency bands; RE, risk estimate; events include both morbidity and mortality; ICH, intracerebral haemorrhage; IS, ischaemic stroke; SAH, subarachnoid haemorrhage; HF, heart failure. The significant pooled results are in bold.
A bibliography of all included reviews is presented in Supplementary material online, Appendix S3.
There were no systematic reviews found in the domains of food environment and light pollution.
LAeq16hr, annual non-weighted 16 h average noise level during the day; LAeq24hr, the annual non-weighted day–night average noise level; LDEN, the annual weighted (day + 0 dB, evening + 5 dB, and night + 10 dB) day–evening–night average noise level; LAeq, A-weighted average of an energy-equivalent continuous sound level over a period of time (A-weighting: in noise research, typically, the A filter is used which adjusts for deep and high frequencies, as these are perceived as less loud); LDay, LAeq for the day (usually 7:00 a.m.–7:00 p.m.) for all day periods of a year; LNight, LAeq for the night (usually from 11:00 p.m. to 7:00 a.m.) for all night periods of a year; LDN, all 24 h LAeq periods of a year with additional 10 dB for nighttime noise annoyance (usually from 11:00 p.m. to 7:00 a.m.); LDENAEI, see LDEN, but in addition, weighted average exposure on municipal level.
Thirty-three reviews studied the domain of air pollution, 4 studied physical activity environment, 1 studied urbanization, 10 studied residential noise, and 8 studied ambient temperature. There were no systematic reviews found in the domains of food environment and light pollution. Most reviews (n = 46) conducted one or multiple meta-analyses. Seven reviews only conducted narrative syntheses of the primary studies. In total, the meta-analyses summarized 180 pooled estimates of the association between specific built environmental factors and CVD events. The CCA-score for each domain was below 1, indicating only limited overlap of primary studies (see supplementary material online, Appendix S4).
Domain-specific results
Air pollution
Overall, long-term increased air pollution was associated with a higher risk of CVD events, based on a total of 105 meta-analyses. Among them, three reviews contained pooled results classified as strong evidence.34,36,41 Four air pollutants were associated with a higher risk of CVD events (Table 2). Chen et al.36 found that both a 10 μg/m3 higher ambient SO2 (HR, 1.005; 95% CI, 1.004–1.007) and CO concentration (HR, 1.017; 95% CI, 1.013–1.022) were associated with an increased incidence of AF. Furthermore, Yang et al.41 found that a 10 μg/m3 higher ambient NO2 concentration was associated with an increased risk of ischaemic heart disease (IHD) events (RR, 1.05; 95% CI, 1.04–1.06). Alexeeff et al.34 found that a 10 μg/m3 higher PM2.5 concentration was associated with an increased risk of incident stroke (RR, 1.13; 95% CI, 1.11–1.15). Among these three reviews that provide strong evidence, Chen et al. and Yang et al. had a low risk of bias, while Alexeeff et al. had a high risk of bias for study eligibility criteria, identification, and selection (Table 2).
Robustness of evidence assessment and ROBIS quality assessment per review by domaina
| Strong evidence by domainb | Robustness of evidence | ROBIS quality assessment (comments) | |||||||||||
|---|---|---|---|---|---|---|---|---|---|---|---|---|---|
| Level of comparison | Random-effects summary ES (95% CI); P value | Sample size; N of included studies | ES (95%CI) in the largest study | I2 (%) | Egger’s test P value | Excess statistical significance test P value | 95% prediction interval | Study eligibility criteria | Identification and selection of studies | Data collection, appraisal | Synthesis and findings | Overall | |
| Air pollution | |||||||||||||
| Chen et al.36 | RR per 10 μg/m3 increase in SO2 for AF | 1.005 (1.004–1.007); < 0.000001 | >1000; 2 studies | 1.005 (1.003–1.006) | 0.0% | NA | 0.53 | 1.004–1.007 | Low risk | High risk (no additional methods to database search) | Low risk | Low risk | Low risk |
| Chen et al.36 | RR per 10 μg/m3 increase in CO for AF | 1.017 (1.013–1.022); < 0.000001 | >1000; 2 studies | 1.017 (1.013–1.022) | 0.0% | NA | 0.53 | 1.013–1.022 | Low risk | High risk (no additional methods to database search) | Low risk | Low risk | Low risk |
| Alexeeff et al.34 | RR per 10 μg/m3 increase in PM2.5 for incident stroke | 1.13 (1.11–1.15); < 0.000001 | >1000; 14 studies | 1.12 (1.08–1.16) | 0.0% | 0.46 | 0.52 | 1.11–1.15 | High risk | High risk | High risk | Low risk | High risk |
| Yang et al. 201941 | RR per 10 μg/m3 increase in NO2 for IHD events (incidence and mortality) | 1.05 (1.04–1.06); < 0.000001 | >1000; 4 studies | 1.05 (1.03–1.06) | 0.0% | 0.68 | 0.27 | 1.04–1.07 | Low risk | Unclear risk | Unclear risk | High risk | High risk |
| Residential noise | |||||||||||||
| Cai et al. 2021 | HR per 10 dB increase in aircraft traffic noise (Lden) for CVD mortality | 1.17 (1.10–1.25); < 0.000001 | >1000; 3 studies | 1.18 (1.10–1.26) | 0.0% | 0.82 | 0.77 | 1.10–1.25 | Low risk | High risk (search strategy is simple and no MeSH terms used; language restricted to English; no information for two independent screeners) | Unclear risk | High risk | Unclear risk |
RR, relative risk; HR, hazard ratio; MI, myocardial infarction; AP, angina pectoris; CHA, cardiovascular hospital admission; ACS, acute coronary syndrome; CVD, cardiovascular disease; CHD, coronary heart disease; AF, atrial fibrillation; IHD, ischaemic heart disease; CeVD, cerebrovascular disease; RHD, rheumatic heart disease; HRV, heart rate variability; SDNN, the standard deviation of NN intervals; RMSSD, root mean square of successive RR interval differences; LF, low-frequency bands; HF, high-frequency bands; RE, risk estimate; events include both morbidity and mortality; ICH, intracerebral haemorrhage; IS, ischaemic stroke; SAH, subarachnoid haemorrhage; HF, heart failure.
Here, only results of strong evidence are presented. For complete assessment, please refer to Supplementary material online, Appendix S4.
A bibliography of the abovementioned reviews is presented in Supplementary material online, Appendix S3.
Thirteen specific pooled results were supported by highly suggestive evidence (Table 3). Associations were found between a higher ambient PM2.5 concentration and higher risk of myocardial infarction (MI), IHD mortality, cerebrovascular disease (CeVD) mortality, CVD mortality, and stroke events. Associations were also found between a higher ambient PM10 concentration and higher risk of AF and for NO2 with CVD, ICH, and CHD mortalities. All evidence was limited by small-study effects, excess significance bias, or high heterogeneity. Only the studies by Alexeeff et al.34 and Zou et al.42 had a high risk of bias. Furthermore, 32 pooled estimates were found to be non-significant (Table 3); most of these included a small number of studies (i.e. 2–4 studies).
Summary of evidence based on robustness and qualitya
| Robustness of evidence by domainb | Specific exposure and outcome |
|---|---|
| Air pollution (positive association) | |
| Strong (n = 4) | PM2.5 and stroke (c,dAlexeeff et al.34), SO2 and AF (2 studies, Chen et al.36), CO and AF (2 studies, Chen et al.36), NO2 and IHD events (4 studies, Yang et al.41) |
| Highly suggestive (n = 13) | PM2.5 for MI (d,eZou et al. 2021), IHD mortality (c,d,f,gAlexeeff et al.34) (gChen et al. 2020), CeVD mortality (c,d,gAlexeeff et al.34), CVD mortality (eYang et al.41) (e,f,gLiu et al. 2018) (g, Chen et al. 2020), CVD events (eYang et al.41), stroke events (eYang et al.41) PM10 and AF (4 studies, e,fChen et al.36) NO2 for CVD mortality (gHuang et al. 2021), ICH mortality (gStieb et al. 202140), CHD mortality (Atkinson et al. 201835) |
| Non-significant (n = 32) | PM2.5 for CHD mortality (d,gChen et al. 2008), MI (c,d,gAlexeeff et al.34), CVD (gYang et al.41), HRV (c,dWang et al. 2020) PM10 for stroke (gYang et al.41), stroke mortality (gYang et al.41) (gChen et al. 2020), stroke events (gYang et al.41), IHD (2 studies, Yang et al.41), IHD mortality (4 studies, gYang et al.41), IHD events (6 studies, gYang et al.41), CVD (3 studies, gYang et al. 201941), CVD mortality (e,f,gLiu et al. 2018) (gChen et al. 2020), CVD events (e,gYang et al.41) NO2 for stroke (4 studies, Yang et al.41), stroke mortality (2 studies, Yang et al.41), stroke events (6 studies, Yang et al.41), CVD (2 studies, Yang et al.41), CeVD mortality (13 studies, Stieb et al.40) (dAtkinson et al.35) O3 for AF (3 studies; Chen et al.36), stroke (2 studies, gYang et al.41), stroke mortality (3 studies, Yang et al.41) (dAtkinson et al. 2016), stroke events (5 studies, gYang et al.41), CVD mortality (d,eAtkinson et al. 2016), CVD events (e,gYang et al.41), IHD mortality (d,eAtkinson et al. 2016) |
| Physical activity environment (negative association) | |
| Suggestive (n = 2) | Greenspace and CVD mortality (dGascon et al. 2016) (2 studies, Twohig-Bennett et al.43) |
| Non-significant (n = 6) | Greenspace and CVD mortality (gYuan et al. 2020) (dGascon et al. 2016), IHD mortality (3 studies, Yuan et al. 2020), stroke mortality (4 studies, e,gYuan et al. 2020), stroke (eTwohig-Bennett et al.43), CHD (2 studies, Twohig-Bennett et al. 201843) |
| Urbanization (insufficient and mixed evidence) | |
| Weak (n = 2) | Positive association: Urban exposure and CHD (c,eAngkurawaranona et al. 2014), Negative association: Urban exposure and RHD (cAngkurawaranona et al. 2014) |
| Non-significant (n = 2) | Urban exposure for stroke (cAngkurawaranona et al. 2014), non-specific heart disease (c,f,gAngkurawaranona et al. 2014) |
| Residential noise (positive association) | |
| Strong (n = 1) | Aircraft traffic noise and CVD mortality (c,dCai et al. 2021) |
| Suggestive (n = 2) | Road traffic noise and CHD (c,aBabisch et al.45), Traffic noise for IHD (c,dVienneau et al.47) |
| Non-significant (n = 17) | Traffic noise and CVD (dBanerjee et al. 2014) Road traffic noise and MI (dBanerjee et al. 2014) (dKhosravipour et al. 2020), stroke (d,gDzhambov et al. 2016), AP (dBanerjee et al. 2014), CVD mortality (dCai et al. 2021), IHD mortality (dCai et al. 2021), stroke mortality (d,eCai et al. 2021) Aircraft traffic noise and MI (dBanerjee et al. 2014), AP (dBanerjee et al. 2014), IHD (d,eBanerjee et al. 2014), stroke (dDzhambov et al. 2016) (7 studies, Weihofen et al.48), IHD mortality (d,gCai et al. 2021), stroke mortality (dCai et al. 2021) Rail traffic noise and IHD mortality (d,gCai et al. 2021) |
| Ambient temperature (positive association) | |
| Suggestive (n = 8) | Temperature and CVD mortality (dOdame et al. 2018) Heat and CVD mortality (d,e,gBunker et al.49) (d,e,f,gMoghadamnia et al.50), combined CVD mortality (d,e,gBunker et al.49) Cold and CVD mortality (d,e,f,gMoghadamnia et al.50), CeVD mortality (dBunker et al.49), ICH morbidity (dBunker et al.49), combined CVD mortality (d,e,gBunker et al.49) |
| Non-significant (n = 22) | Temperature and CVD (c,d,gTurner et al. 2012), stroke (c,d,gTurner et al. 2012), ACS/MI (c,d,gTurner et al. 2012), IS (c,gWang et al. 2016), SAH (cWang et al. 2016) Heat and IS (c,gWang et al. 2016) (d,e,f,gBunker et al.49), CeVD (d,e,f,gBunker et al.49), CVD (d,e,f,gBunker et al.49), MI (d,e,gBunker et al.49), ICH mortality (d,gBunker et al.49), combined CVD (d,f,gBunker et al.49) Cold and CVD (d,eBunker et al.49), combined CVD (d,gBunker et al.49), AP (d,gBunker et al.49), HF (d,gBunker et al.49), IHD mortality (d,gBunker et al.49), MI (d,gBunker et al.49), CeVD (d,e,f,gBunker et al.49), combined CeVD (d,f,gBunker et al.49), IS (c,gWang et al. 2016) (d,gBunker et al.49) |
MI, myocardial infarction; AP, angina pectoris; CHA, cardiovascular hospital admission; ACS, acute coronary syndrome; CVD, cardiovascular disease; CHD, coronary heart disease; AF, atrial fibrillation; IHD, ischaemic heart disease; CeVD, cerebrovascular disease; RHD, rheumatic heart disease; HRV, heart rate variability; SDNN, the standard deviation of NN intervals; RMSSD, root mean square of successive RR interval differences; LF, low-frequency bands; HF, high-frequency bands; RE, risk estimate; events include both morbidity and mortality; ICH: intracerebral haemorrhage; IS: ischaemic stroke; SAH; subarachnoid haemorrhage; HF: heart failure.
A bibliography of the abovementioned reviews is presented in Supplementary material online, Appendix S3.
There were 17 suggestive, 16 weak, and 23 unclear associations in the domain of air pollution; 10 unclear associations in residential noise; and 6 weak and 1 unclear associations in ambient temperature. For complete summary, please refer to Supplementary material online, Appendix S5, and Table S1.
High risk or unclear risk in study eligibility criteria.
High risk or unclear risk in identification and selection.
Small-study effect.
Excess significance bias.
High heterogeneity.
We identified three specific exposure and outcome analyses suitable for meta-meta-analyses (studies presented in bold in Table 3). Firstly, a meta-meta-analysis of 29 unique primary studies from Alexeeff et al. and Chen et al.34,51 showed that a 10 µg/m3 increase in PM2.5 was associated with increased IHD mortality (RR, 1.21; 95% CI, 1.10–1.33; I2, 98.16%) (Figure 2) with a large degree of heterogeneity across studies (high I2-statistic and larger 95% PI than the 95% CI) (Table 4). As a sensitivity analysis, we conducted the meta-meta-analysis excluding studies that did not adjust for smoking, which decreased the degree of heterogeneity, but did not affect the results (Table 4 and see Supplementary material online, Figure S1). Secondly, a meta-meta-analysis of 26 unique primary studies from Yang et al. and Chen et al.41,51 showed that each 10 µg/m3 increase in PM2.5 was associated with increased CVD mortality (RR, 1.11; 95% CI, 1.09–1.14; I2, 74.23%) (Figure 3) with a large degree of heterogeneity across these 26 studies (Table 4). Excluding studies that did not adjust for any lifestyle behaviour did not result in any substantial change in effect estimates (Table 4 and see Supplementary material online, Figure S2). Lastly, a meta-meta-analysis of 14 unique primary studies from Stieb et al. and Atkinson et al.35,40 showed a non-significant association of NO2 with CeVD mortality (HR, 1.03; 95% CI, 1.00–1.06; I2, 45.64%) (Figure 4). There was no evident small-study effect or excess significance bias in these three meta-analyses.
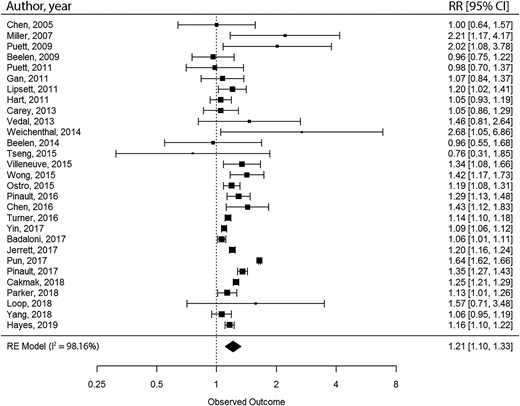
Meta-meta-analysis of the relative risk of ischaemic heart disease mortality per 10 µg/m3 in long-term fine particulate matter <2.5 μm in diameter exposure. A bibliography of included studies is presented in supplementary material online, Appendix S3.
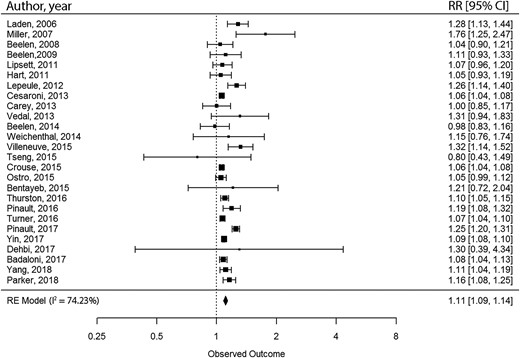
Meta-meta-analysis of the relative risk of cardiovascular disease mortality per 10 µg/m3 in long-term fine particulate matter <2.5 μm in diameter exposure. A bibliography of included studies is presented in supplementary material online, Appendix S3.
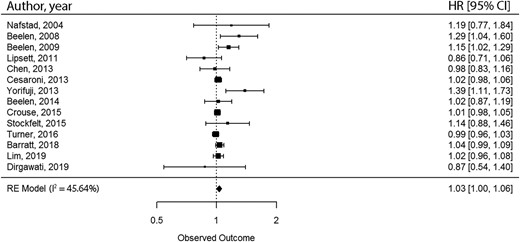
Meta-meta-analysis of the hazard ratio of cerebrovascular disease mortality per 10 parts per billion increase in NO2 exposure. A bibliography of included studies is presented in supplementary material online, Appendix S3.
Meta-meta-analyses and robustness of evidence assessment by domain
| Included reviewsa | Level of comparison | Random-effects summary ES (95% CI); P value | Sample size; N of included studies | ES (95% CI) in the largest study | I2 (%) | Egger’s test P value | Excess statistical significance test P value | 95% prediction interval | Robustness of evidence |
|---|---|---|---|---|---|---|---|---|---|
| Air pollution | |||||||||
| Alexeeff et al.34 Chen et al. 2020 | RR per 10 µg/m3 increase in PM2.5 for IHD mortality | 1.21 (1.10–1.33); < 0.0001 | >1000; 29 studies | 1.64 (1.62–1.66) | 98.16% | 0.36 | 0.21 | 0.7852–1.8617 | Highly suggestive |
| Yang et al.41 Chen et al. 2020 | RR per 10 µg/m3 increase in PM2.5 for CVD mortality | 1.11 (1.09–1.14); < 0.0001 | >1000; 26 studies | 1.06 (1.04–1.08) | 74.23% | 0.08 | 0.37 | 1.0303–1.1959 | Highly suggestive |
| Stieb et al.40 Atkinson et al.35 | HR per 10 ppb increase in NO2 for CeVD mortality | 1.03 (1.00–1.06); 0.07 | >1000; 14 studies | 1.01 (0.98–1.05) | 45.64% | 0.09 | 0.41 | 0.9581–1.1044 | Non-significant |
| Ambient temperature | |||||||||
| Bunker et al.49 Moghadamnia et al.50 | RR per 1°C change of temperature (heat) for CVD mortality | 1.04 (1.03–1.04); < 0.0001 | >1000; 62 studies | 1.013 (1.010–1.015) | 98.63% | < 0.0001 | < 0.01 | 1.0225–1.0538 | Highly suggestive |
RR, relative risk; HR, hazard ratio; CVD, cardiovascular disease; IHD, ischaemic heart disease; CeVD, cerebrovascular disease.
A bibliography of the abovementioned reviews is presented in Supplementary material online, Appendix S3.
Five narrative reviews were found on air pollution with consistent results to other reviews (Table 1).37–39,52,53
Physical activity environment
Three reviews studied associations in the physical activity environment domain including eight meta-analyses. All reviews in this domain studied greenspace exposure. Two associations related to greenspace were supported by suggestive evidence (Table 3). Gascon et al. found an inverse association for 10% higher greenspace exposure and CVD mortality; however, their review was at high risk of bias for study identification.54 Six pooled estimates were not statistically significant. Among these, Yuan et al.55 reviewed the association between greenspace and IHD mortality and Twohig-Bennett et al.43 reviewed the association between greenspace and IHD incidence with no obvious risk of bias, though they comprised a small number of studies (i.e. 2–3 studies).
Urbanization
One review was identified in the urbanization domain.44 Angkurawaranon et al. reviewed studies focusing on Southeast Asian populations and included four meta-analyses. Two associations were supported by weak evidence. One pooled estimate showed that urban exposure was associated with higher odds of CHD (OR, 2.48; 95% CI, 1.20–5.11), while the other showed lower odds of rheumatic heart disease (RHD) (OR, 0.31; 95% CI, 0.13–0.76). The other two pooled estimates for stroke and non-specific heart disease were non-significant. The eligibility criteria were not clearly reported in this review, resulting in an unclear risk of bias (Table 3).
Residential noise
In the residential noise domain, 9 reviews were identified, including 30 meta-analyses (Table 3). Cai et al. found strong evidence of an association between 10 dB higher aircraft traffic noise and increased CVD mortality (HR, 1.17; 95% CI, 1.10–1.25), though this review had a high risk of bias in study eligibility criteria, identification, and selection.56 Two associations were supported by suggestive evidence. Babisch et al.45 found an association between 10 dB higher road traffic noise exposure and higher risk of CHD. Vienneau et al.47 found a similar association between traffic noise exposure and higher risk of IHD. Seventeen pooled estimates were non-significant. Among these, Weihofen et al.48 reviewed seven studies and found a marginal association between 10 dB higher aircraft traffic noise exposure and higher risk of stroke (RR, 1.013; 95% CI, 0.998–1.028). This review did not suffer from obvious risks of bias, heterogeneity, small-study effect, or excess significance bias.
One systematic review covered multiple domains: air pollution, greenspace, walkability, and noise. Using the Grading of Recommendations, Assessment, Development and Evaluation (GRADE) system, Rugel et al. found sufficient evidence of an association between increased noise and higher risk of CVD.57
Ambient temperature
In the ambient temperature domain, eight reviews were included. These reviews included 37 meta-analyses (Table 3). Associations between both higher and lower temperature in relation to higher risk of CVD were supported by suggestive evidence (3 reviews), 6 associations were supported by weak evidence, and 22 pooled estimates were non-significant. All results suffered from a high risk of bias. Two narrative reviews were found in this domain with inconsistent results.
In this domain, we identified one specific exposure and outcome analysis that was suitable for a meta-meta-analysis. Bunker et al.49 and Moghadamnia et al.50 meta-analysed the RR of CVD mortality per 1°C change in temperature. The meta-meta-analysis of 62 unique primary studies showed a significant association between increasing temperature and CVD mortality (RR, 1.04; 95% CI, 1.03–1.04; I2, 98.63%) (Figure 5). Both a small-study effect and excess significance bias were evident in this analysis. As sensitivity analyses, we conducted the meta-meta-analysis excluding studies that did not adjust for any confounders (see Supplementary material online, Appendix S7, and Figure S3), did not adjust for air pollution (see Supplementary material online, Appendix S7, and Figure S4), and adjusted only for air pollution (see Supplementary material online, Appendix S7, and Figure S5). These analyses did not substantially change the results of the main analyses.
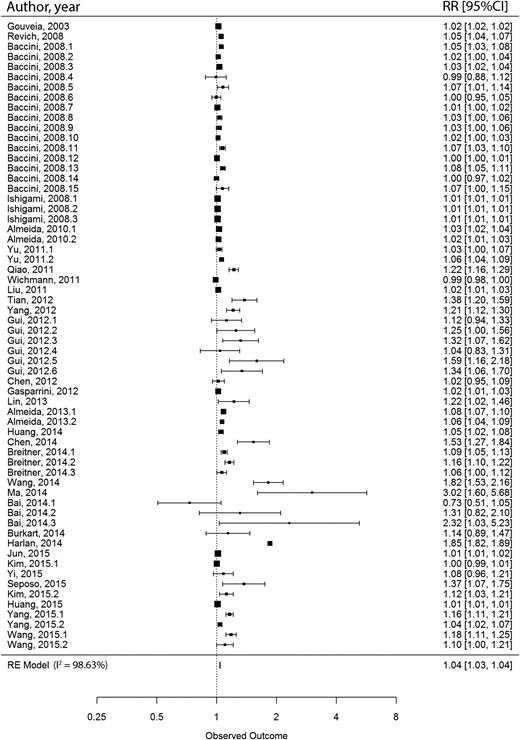
Meta-meta-analysis of the relative risk of cardiovascular disease mortality per 1°C change of temperature (heat). A bibliography of included studies is presented in supplementary material online, Appendix S3.
Discussion
Principal findings
Our umbrella review found strong evidence of an association between increased air pollution, including increased ambient PM2.5, SO2, CO, and NO2 exposure, and CVD outcomes. There was also consistent evidence of associations between increased noise levels and CVD outcomes, including strong evidence for air traffic noise and CVD mortality. An association between increased ambient temperature and CVD mortality was supported by highly suggestive evidence. Review evidence in other domains including physical activity environment, food environment, light pollution, and urbanization in relation to CVD are scarce or lacking. However, the limited available evidence is suggestive of a protective effect of greenspace exposure in terms of CVD mortality.
Strengths and limitations
To the best of our knowledge, this is the first umbrella review to comprehensively summarize the relationship between aspects of the built environment and CVD. Following a pre-specified protocol, we conducted a wide-ranging search across seven databases. The included reviews underwent extensive critical appraisal using a validated risk of bias assessment method. Both methodological quality and statistical evidence were evaluated to determine the robustness of evidence. Finally, meta-meta-analyses were performed where possible to combine all available quantitative evidence.
To contextualize the findings, certain limitations of our umbrella review need to be addressed. Firstly, the search strategy was limited to reviews published in the English language. Therefore, we may have omitted key studies published in other languages. Secondly, we included systematic reviews published between 1 January 2000 and 16 April 2021. The most recently published evidence has not yet been taken up in systematic reviews and is, therefore, not included here. Lastly, many included reviews (and studies to date) report on cross-sectional analyses, which inhibits identification of causality.
Evidence in relation to other studies
Our results were generally consistent with the World Health Organization (WHO) 2021 global air quality guidelines, as well as earlier umbrella reviews investigating air pollution and CVD outcomes.58–62 Positive associations are consistently found for a variety of pollutants, as well as CVD outcomes. However, the association between PM2.5 and CVD was the most widely investigated. NO2 exposure was, thus far, not encompassed in the scope of the WHO guidelines because of the absence of clear quantitative evidence. Our results contribute strong evidence of an association between higher NO2 exposure and a higher risk of IHD and highly suggestive evidence of an association between higher NO2 exposure and a higher risk of CVD mortality. While earlier work demonstrated strong evidence of a positive association between PM2.5 and stroke only in Europe,62 our results show that this holds true when non-European countries are included.
This umbrella review indicates that studies of greenspace were heterogeneous in design and exposure assessment, which partly explains the limited combined evidence of an association between greenspace exposure and CVD. For example, greenspace assessment methods included the Normalized Different Vegetation Index (NDVI), percentage of greenspace coverage, and distance to the nearest greenspace. While the first two may be good indicators of the amount of greenspace in certain areas, they do not reflect access to those greenspaces. For distance to the nearest greenspace, the opposite may be true. Therefore, studies of greenspace using different assessment methods are not directly comparable.63,64 This same issue of limited combined evidence may also hold for other domains like physical activity, food environment, light pollution, and urbanization, although our results did not provide information to support this.
Our findings about traffic noise and CVD events are in line with those from two WHO reports.46,65 The WHO Environmental Noise Guidelines for the European Region (2015) included a systematic review (included in the current review).46 According to an adapted GRADE assessment, high-quality evidence was found on road traffic noise and IHD, and moderate-quality evidence was found for aircraft noise and stroke mortality, and for road traffic noise, IHD mortality, and stroke events. Our study updated the evidence base with strong evidence of an association between air traffic noise and CVD mortality. Furthermore, we observed that the existing evidence on rail traffic noise is still limited.
The 2019 Global Burden of Disease study estimated that global age-standardized CVD disability-adjusted life years (DALYs) attributable to high temperature was 25.59 per 100 000 people.66 The heat-related disease burden was the highest for stroke and was greater in regions with a lower socio-demographic index (SDI). However, the observational evidence on specific outcomes and regional differences, as reported in the current review, was insufficient. The effect estimate found in the current meta-meta-analysis might be small (Figure 5), but increasing temperature has a potentially large and increasing population reach.
Mutual confounding and interaction
Many aspects of the built environment may be interconnected, potentially leading to confounding and/or interaction effects. However, most existing reviews and meta-analyses focus on single (sub)domains of exposure. We only found one systematic review that covered multiple domains. This study observed sufficient evidence of an association between higher noise exposure and increased CVD morbidity, after adjusting for traffic-related air pollution.57 A meta-analysis by Vienneau et al.47 observed an association between higher noise levels and increased IHD which remained robust after including studies that adjusted for air pollution exposure. Despite the substantial amount of studies on the effects of air pollution and temperature on CVD, there is limited research available on their mutual confounding or interaction effects. One systematic review found that long-term air pollution exposure and colder temperatures are independently associated with an increased risk of CVD.67 Additionally, another US cohort study found that the association between higher PM2.5 and CVD was stronger in areas with higher green space, lower O3 levels, and lower temperatures.68 Furthermore, as a proxy for context, urbanization may also have significant confounding or interaction effects with various aspects of the built environment. For example, a Dutch cohort study indicated associations between fast-food restaurant density and CVD in urban areas but not in rural areas.69
Possible mechanisms and explanations
Several potential mechanisms have been theorized that may explain the associations found in this study. Exposure to air pollutants may promote systemic inflammation and oxidative stress in the lungs, which eventually increases systemic inflammation and oxidative stress.17 As a result, a variety of pathological processes could take place that eventually lead to CVD, such as increased thrombosis, hypercoagulability, endothelial dysfunction, atherosclerosis progression, insulin resistance, and dyslipidaemia.16,17 Pollutants can also induce oxidative stress and inflammation in the central nervous system, especially in the hypothalamus, leading to an imbalance in the cardiac autonomic nervous system.17 Moreover, smaller size pollutants can directly enter the circulation and damage the cardiovascular system and organs.17 These mechanisms are better understood for PM exposure than for other pollutants. Carbon monoxide typically hampers oxygenation of tissues via carboxyhaemoglobin production, which has a more significant influence on the myocardium than peripheral tissues.70 These mechanisms may explain the more evident associations found for AF. Atrial fibrillation is an early CVD endpoint that can lead to other CVD outcomes in the long term. For residential noise exposure, both direct and indirect pathways have been theorized.18 The direct pathway is induced by the instant interaction between the acoustic nerve and the central nervous system. The indirect pathway relates to cognitive perception and subsequent cortical activation and emotional response. Both pathways can cause physiological stress responses, and, in the long term, pathophysiologic alterations and CVD. The adverse effect of residential noise has been reported independent of sleep quality and self-reported noise sensitivity. But noise can indeed disturb sleep and subsequently cause reduced immune function and a pro-inflammatory state.21 Changes in temperature can cause typical physiological responses that might lead to MI, including tachycardia and increased blood viscosity.19 Both cold and heat exposure may increase sympathetic activation, which could lead to high blood pressure.19 Lastly, it is hypothesized that greenspace improves air quality. By reducing the concentration of air pollutants, greenspace may reduce the impact of air pollution on CVD.63 Additionally, greenspaces may facilitate physical activity, thereby promoting cardiovascular health.63
Gaps in current knowledge and suggestions for future research
Future primary studies should investigate the effects of PM10, SO2, CO, NO, and PM0.1, especially long-term exposure. As we observed evidence of early-onset CVD (e.g. AF), more studies of other CVD outcomes that occur later (e.g. IHD) are warranted. Research is needed on light pollution. Despite there being multiple primary studies on the food environment, they differ in definition of food environment and vary with regard to buffer size. As such, these studies cannot be meta-analysed. Standard design and exposure assessments should be developed and implemented to foster synthesis of evidence. More studies are also needed for residential noise and ambient temperature, especially from low-to-middle-income countries (LMICs). Future primary studies should preferably use prospective study designs in the domains of physical activity environment, urbanization, and residential noise to increase causal inference power. Furthermore, primary studies on interactions or interrelationships of built environmental aspects in relation to CVD are also warranted.
As for systematic reviews, future work should provide evidence on O3 that is of higher quality. Review evidence on the physical activity environment, food environment, and urbanization was limited. There are primary studies on these domains, but future reviews to harmonize research data (e.g. in terms of the heterogeneity in the definition and measurement of exposures) and synthesize evidence are required. For example, in terms of greenspace, accessibility and composition may be crucial to determining its effects.71 Furthermore, more high-quality review evidence is needed on residential noise and ambient temperature, especially for LMICs. It is highly recommended that future systematic reviews on the built environment adhere to the PRISMA reporting guidelines and pre-register a protocol in a dedicated registry such as PROSPERO to guarantee transparency, prevent overlap in topics, and promote methodological quality. Furthermore, the use of quality assessment should become common practice, using standardized, validated tools, as recommended by sources such as PRISMA and Cochrane.72,73 We also observed that most primary studies and reviews focus on one single built environment aspect. However, these aspects co-exist and act together. Accounting for multiple elements of the built environment may provide a better understanding of the relative contribution of each aspect to CVD risk. Systematic reviews should also consider comparing single-exposure to multi-exposure models to examine potential confounding effects between built environment exposures.
Implications for public health
There was strong evidence of a detrimental effect of air pollution on CVD. Therefore, it is important that governments and individuals take measures to reduce outdoor air pollution. The WHO has developed the 2021 long-term air quality guideline levels with interim targets.61 Each country should establish air quality standards with adapted interim targets, specified measurement, and statistical procedures to reduce CVD events attributable to air pollution. Another strategy could be the development of a framework for clinical recommendations and individual exposure mitigation strategies. The American Heart Association has stated such individual strategies to prevent air pollution, like using portable air cleaners, high-efficiency heating ventilation and air conditioning systems, and N95 respirator.74
We found suggestive evidence of a protective effect of greenspace on CVD. This supports the call for urban planners, city designers, project developers, and policymakers to take greenspace into account.75 There was also clear evidence of increased residential noise being associated with a higher CVD risk. The WHO developed guidelines pertaining to noise levels for the European regions in 2015.46 However, these recommendations may not be directly applicable to other regions. One general public health approach is to address the major sources of pollution (i.e. combustion, traffic, industry, and power generation). Another approach is to develop healthy building guidelines (e.g. including advanced insulation) to reduce the exposure to outdoor air pollution, light pollution, residential noise, and extreme temperatures.
Conclusion
This umbrella review provides a comprehensive overview of the observational evidence on the built environment and CVD. We found strong evidence of associations between increased air pollution, especially PM2.5, and increased residential noise with higher risk of CVD. The present meta-meta-analysis produced highly suggestive evidence of an association between temperature and CVD. Evidence on physical activity environment, food environment, light pollution, and urbanization is scarce or lacking. Our identification of several knowledge gaps and methodological limitations in the current literature may improve and inform future research and contribute to a better understanding of the effect of the built environment on CVD.
Author contributions
M.L., P.M., and J.L. designed the study and developed the review question. M.L. and P.M. performed the literature search and were the primary reviewers. T.M.L., E.J.T., I.V., and J.L. acted as additional reviewers where required. E.J.T., D.E.G., J.W.J.B., I.V., and J.L. supervised the study. M.L. and P.M. drafted the manuscript. All authors reviewed and revised the protocol and manuscript. J.L. acts as guarantor. The corresponding author attests that all listed authors meet authorship criteria and that no others meeting the criteria have been omitted.
Supplementary material
Supplementary material is available at European Journal of Preventive Cardiology.
Funding
M.L. had financial support from China Scholarships Council; all other authors had financial support from NWO Gravitation grant Exposome-NL (Grant/Award Number: 024.004.017). The funders didn’t have any role in the study design; in the collection, analysis, and interpretation of data; in the writing of the report; or in the decision to submit the article for publication. We confirm the independence of researchers from funders and that all authors had full access to all of the data (including statistical reports and tables) in the study and can take responsibility for the integrity of the data and the accuracy of the data analysis.
Data availability
The data underlying this article are available in the article and in its online supplementary material.
References
The Global Economic Burden of Non-communicable Diseases. https://www.weforum.org/reports/global-economic-burden-non-communicable-diseases/.
Author notes
Mingwei Liu and Paul Meijer contributed equally to the study.
Conflict of interest: All authors have completed the ICMJE uniform disclosure form at http://www.icmje.org/disclosure-of-interest/ and declare the following: M.L. had financial support from China Scholarships Council; all other authors had financial support from NWO Gravitation grant Exposome-NL; there are no financial relationships with any organizations that might have an interest in the submitted work in the previous 3 years; and there are no other relationships or activities that could appear to have influenced the submitted work.

Comments