


Abstract
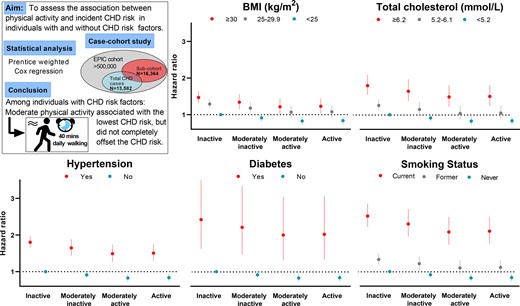
This study aimed to evaluate the association between physical activity and the incidence of coronary heart disease (CHD) in individuals with and without CHD risk factors.
EPIC-CVD is a case-cohort study of 29 333 participants that included 13 582 incident CHD cases and a randomly selected sub-cohort nested within the European Prospective Investigation into Cancer and Nutrition (EPIC) cohort. Self-reported physical activity was summarized using the Cambridge physical activity index (inactive, moderately inactive, moderately active, and active). Participants were categorized into sub-groups based on the presence or the absence of the following risk factors: obesity (body mass index ≥30 kg/m2), hypercholesterolaemia (total cholesterol ≥6.2 mmol/L), history of diabetes, hypertension (self-reported or ≥140/90 mmHg), and current smoking. Prentice-weighted Cox regression was used to assess the association between physical activity and incident CHD events (non-fatal and fatal).
Compared to inactive participants without the respective CHD risk factor (referent), excess CHD risk was highest in physically inactive and lowest in moderately active participants with CHD risk factors. Corresponding excess CHD risk estimates amongst those with obesity were 47% [95% confidence interval (CI) 32–64%] and 21% (95%CI 2–44%), with hypercholesterolaemia were 80% (95%CI 55–108%) and 48% (95%CI 22–81%), with hypertension were 80% (95%CI 65–96%) and 49% (95%CI 28–74%), with diabetes were 142% (95%CI 63–260%), and 100% (95%CI 32–204%), and amongst smokers were 152% (95%CI 122–186%) and 109% (95%CI 74–150%).
In people with CHD risk factors, moderate physical activity, equivalent to 40 mins of walking per day, attenuates but does not completely offset CHD risk.
See the editorial comment for this article ‘In lifestyle and prevention, the whole is surely greater than the sum of its parts’, by Nathalia Gonzalez-Jaramillo et al., https://doi.org/10.1093/eurjpc/zwac086.
Introduction
Cardiovascular disease (CVD) is the largest contributor to global deaths.1 A plethora of evidence suggests that physical activity is associated with a lower risk of CVD morbidity and mortality.2–4 Moreover, physical activity is inversely associated with the risk of coronary heart disease (CHD) in a dose–response manner.5 Importantly, a higher risk of CHD is evident amongst those with obesity, hypercholesterolaemia, hypertension, diabetes and those who smoke compared with those without these risk factors.6 Understanding the association of physical activity with CHD risk in high-risk groups is needed to inform prevention strategies. However, the magnitude and shape of the association between physical activity and CHD risk amongst those at high or intermediate CHD risk (e.g. overweight) have not been fully elucidated. A few studies quantified these associations amongst those with CHD risk factors with some including only women.7,8 Also, due to a small number of incident CHD cases, some studies were restricted to dichotomizing either the risk factors (normal weight vs overweight or low vs high total cholesterol levels)7,8 or physical activity levels.9
The physical activity guidelines for adults are broad, encompassing those with chronic conditions such as hypertension and type 2 diabetes.10 Knowledge of how different physical activity behaviours may modify CHD risk amongst those with specific CHD risk factors would allow more tailored prescription of physical activity by healthcare professionals. Furthermore, most evidence on self-reported physical activity is based on instruments without documented validity. The use of a validated global measure of physical activity11,12 in the current study may aid in the interpretation of results, including translation into public health action.
The aim of the current study was to estimate the association between physical activity and CHD risk overall and in individuals with and without the following established CHD risk factors: (1) overweight/obesity, (2) hypercholesterolaemia, (3) hypertension, (4) type 2 diabetes, and (5) smoking. A secondary aim was to calculate the population preventable fraction (PPF) of CHD associated with physical activity in those with and without CHD risk factors.
Methods
Study population
EPIC-CVD is a prospective case-cohort study nested within the European Prospective Investigation into Cancer and Nutrition (EPIC) study.13 The EPIC study involves over 500 000 men and women, aged 35–70 years old at baseline, recruited between 1992 and 2000 by 23 study centres in 10 European countries. The participants included in EPIC were mostly recruited from the general population except for the following: the French cohort that only included women, school, and university employees, who were members of a health insurance scheme; two Italian centres (Turin and Ragusa) and the Spanish centres recruited blood donors; one Italian centre (Florence) and one centre from The Netherlands (Utrecht) recruited women from a population-based breast cancer screening programme; one UK centre (Oxford) recruited a large proportion of non-meat eaters. The participants were invited by mail or in person. The study populations are convenient samples of those agreeing to participate. Participants in the EPIC study completed questionnaires on diet, lifestyle, and medical history and blood samples were taken at baseline, and data were centralized at the International Agency for Research on Cancer (IARC) in Lyon, France.
A case-cohort study provides an efficient design because costly exposure measurements such as biochemical assays are conducted only on participants with incident CHD events and on the sub-cohort. Sub-cohort participants were randomly selected from amongst those who had blood samples available within the EPIC cohort, stratified by centre.14 After the exclusion of 609 participants with a reported history of myocardial infarction or stroke at baseline, 17 640 participants remained in the sub-cohort.15 Participants in the case-cohort study may fall into one of the following categories: (1) those with CHD events outside the sub-cohort (cases), (2) those with CHD events in the sub-cohort (cases), and (3) those without CHD events in the sub-cohort (non-cases).
The current study involved data from 22 study centres in nine countries: Denmark, France, Germany, Italy, The Netherlands, Norway, Spain, Sweden, and UK. Due to data usage restrictions 1276 participants in the sub-cohort and 382 CHD cases from outside the sub-cohort were excluded. In addition, participants with no physical activity data, 281 in the sub-cohort and 525 CHD cases from outside the sub-cohort, were excluded, including all participants from Norway (n = 60 from the sub-cohort and n = 45 from outside the sub-cohort). Consequently, a total of 13 041 CHD cases, including 597 from the sub-cohort, and 15 486 non-cases from the sub-cohort from eight countries were analysed. See Figure 1 for a flow diagram of included and excluded participants in the case-cohort study. Independent ethical review boards of IARC and local institutions of the study centres provided approval for the study, and all participants gave written informed consent.
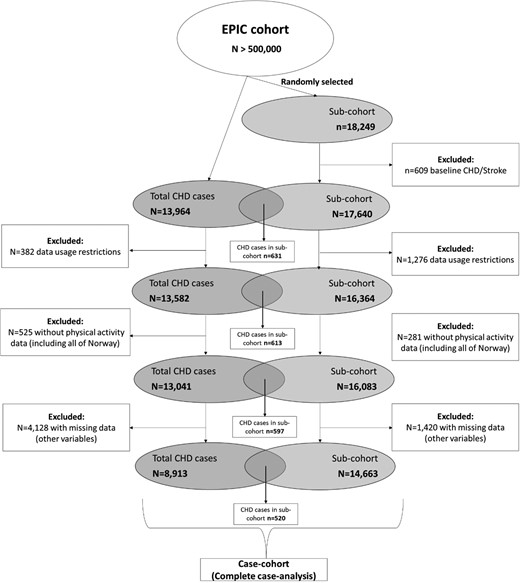
Flow diagram of the study design and the number of included and excluded participants. The sub-cohort includes CHD cases and non-cases where CHD cases refer to those with incident fatal and non-fatal CHD events.
Outcome definition and ascertainment
The first CHD event, including myocardial infarction (fatal or non-fatal), non-fatal angina and chronic ischaemic heart disease, were defined by codes 410–414 of the International Classification of Diseases Ninth Edition (ICD-9) and codes I20–I25 of the Tenth Edition (ICD-10).16 Cases were ascertained by review of medical records and/or linkage with morbidity registries or hospital registries.17 End of follow-up for CHD events varied between centres and ranged between 2003 and 2010.
Physical activity assessment
Physical activity during the past year was self-reported at baseline using validated questionnaires.12 The participants reported the amount of leisure time in hours per week during summer and winter that they spent in physical exercises (e.g. cycling, jogging, and swimming). The Cambridge physical activity index was derived by combining time spent in recreational physical activity (only cycling and other physical exercises) together with occupational activity. The weekly reported recreational activity time was divided by 7 and then categorized (none, some to <0.5 h/day, 0.5–1 h/day, >1 h/day). These categories were cross-tabulated with the occupational activity categories (sedentary, standing, physical work, or heavy manual work) to create four groups: active, moderately active, moderately inactive, and inactive.12 This index has been shown to be well correlated with device-measured physical activity energy expenditure.11
Assessment of Coronary Heart Disease risk factors and relevant covariates
Information on lifestyle factors such as smoking and alcohol consumption (during the past 12 months), socio-demographic factors (including educational level), and medical history were assessed at baseline using self-administered questionnaires. Trained health professionals measured blood pressure, weight, and height during a visit to each study centre. Exceptions occurred at the following centres: Norway and in some participants from France and Oxford, where anthropometry was self-reported, in Norway and in a large proportion of participants from Spain where no blood pressure measurements were available. Hypertension was defined as self-reported hypertension, systolic blood pressure > 140 mmHg or diastolic blood pressure > 90 mmHg, or self-reported use of hypertension medication. Body mass index (BMI) was calculated as weight divided by the square of height in meters. Total cholesterol levels, measured in baseline serum samples, were available in all centres except Norway. Participants were classified as having diabetes if they self-reported a history of diabetes at baseline.
Statistical analyses
The proportion of participants (%) with missing data ranged from ≤1% for most variables (BMI, smoking status, hypertension) to 4.9% for total cholesterol. A complete case analysis was conducted after the exclusion of participants with missing covariate data. Included and excluded participants were compared. Baseline characteristics for the sub-cohort across categories of physical activity are presented as means (standard deviation) or medians (interquartile range) for continuous variables and numbers (percentages) for categorical variables. Cross-sectional analysis between physical activity level and covariates was conducted using Kruskal–Wallis or ANOVA tests for continuous covariates and chi-square test for categorical covariates. To account for the case-cohort design, hazard ratios (HRs) with 95% confidence intervals (CIs) were estimated by Prentice-weighted Cox proportional hazards models with robust standard errors18 with age as the time-scale variable. Entry time was defined as the participant’s age at baseline and exit time as the age at first CHD event or death, loss-to-follow-up or censoring at the end of the follow-up, whichever came first. A two-stage approach was used to account for the multi-centre design: first models were fitted separately within each centre and second, centre-specific estimates were pooled using random-effects meta-analyses. In addition, all models were stratified by sex.
We first assessed the association between incident CHD and physical activity using multiple Cox regression models: (1) age-adjusted model, (2) main model that adjusted for baseline age, highest educational level (no schooling, primary, secondary, vocational/university), alcohol consumption (0, 0.1–5, 5.1–10, 11–40, >40 g/day), smoking (never, former, and current), fruit intake (g/day), vegetable intake (g/day), and (3) the main model was further adjusted for BMI, total cholesterol, hypertension, and diabetes which are considered intermediaries in the association between physical activity and CHD risk. Secondly, we assessed the association between physical activity and CHD risk across different levels of the following CHD risk factors: BMI (<25 kg/m2, 25–29.9 kg/m2, or ≥30 kg/m2), total cholesterol (<5.2 mmol/L, 5.2–6.1 mmol/L, or ≥6.2 mmol/L),19 hypertension (no or yes), history of diabetes (no or yes), and smoking (never, former, or current). To assess the joint association of a specific risk factor and physical activity on CHD risk, independent of other risk factors, we adjusted for the other risk factors in addition to the covariates mentioned in model 2 above. The estimates from the different levels of each risk factor and the estimates from each physical activity category (inactive, moderately inactive, moderately active, and active) were first log-transformed and then combined using the inactive and without the risk factor as the referent. This reference group was chosen to visually highlight the potential beneficial relationship of higher physical activity levels on CHD risk. Also, we want to emphasize the comparison between those who are inactive and without the risk factor and those who are more active and with the risk factor. In addition, we formally tested for multiplicative interaction between physical activity and each of the CHD risk factors.
The PPF was calculated using the adjusted estimate (HR) obtained from the multivariable-adjusted models, with the highest risk group, those who are inactive and with obesity, total cholesterol ≥6.2 mmol/L, hypertension, diabetes, or who currently smoked, as the reference group. The following formula was used: PPF = Pd (1-HR), where Pd refers to the proportion of CHD cases that had the exposure of interest (moderate physical inactivity).20 The PPF represents the proportion of CHD events that could have been prevented if all inactive participants (Category 1) became at least moderately inactive (Category 2). As quantified by our validation study, this 1-category difference corresponds to a difference in activity energy expenditure of 5 kJ/kg/day which would be achievable through, for example, an additional 20 min brisk walk each day, a reasonably realistic goal for inactive individuals. For prospective and long-term goal setting purposes, we also calculated PPF for achieving the next level up (moderate physical activity).
The following sensitivity analyses were performed: (1) excluding the first 2 years of follow-up to reduce the possibility of reverse causation, (2) excluding those with a BMI of <18.5 kg/m2, (3) separate analyses in men and women of the combined associations of physical activity and CHD risk factors on CHD risk, and (4) including non-HDL cholesterol in the models instead of total cholesterol since non-HDL cholesterol may be a stronger predictor of CHD compared with total cholesterol or LDL-cholesterol.21 The following categories were used: <3.7 mmol/L, 3.7–4.7 mmol/L, 4.8–5.6 mmol/L, and ≥5.7 mmol/L. These categories were adapted from Brunner et al. that showed no statistically significant difference in CHD risk between the <2.6 mmol/L and 2.6–3.6 mmol/L categories22 and also due to small number of participants in the <2.6 mmol/L category, these two categories were collapsed in the current study. STATA 15 software (StataCorp LP) was used to perform all analyses.
Results
Baseline characteristics
The complete case-analysis included 14 663 sub-cohort participants and 8913 participants with incident CHD events, of whom 520 were also in the sub-cohort (Figure 1). Sub-cohort participants that were excluded due to missing data were more likely to be inactive, have hypertension and a history of diabetes, compared with those that were included (see Supplementary material online, Table S1). Total cholesterol levels did not differ between included and excluded participants.
In the sub-cohort, 9227 women (mean age 51.9 years, median BMI 25.0 kg/m2) and 5436 men (mean age 52.4 years, median BMI 26.4 kg/m2) were followed-up for a median of 12.8 years (187 686 total person-years). Table 1 shows the baseline characteristics of the sub-cohort by sex and physical activity categories. Compared to inactive men, active men were younger, more likely to be leaner, and to have lower total cholesterol levels, less likely to smoke and to have a history of diabetes and hypertension, and they consumed more alcohol and fruit. Similarly, active women, compared with their inactive counterparts, were younger, more likely to be leaner and to not have a history of diabetes and hypertension, were more educated and consumed more alcohol but less fruit and vegetables. Notably, active women were more likely to be former smokers compared to inactive women. Baseline characteristics of CHD cases from outside the sub-cohort are displayed in Supplementary material online, Table S2.
Characteristics of participants in the sub-cohort (N = 14 663) stratified by physical activity and sex
| Physical activity | |||||
|---|---|---|---|---|---|
| Characteristics | Inactive | Moderately inactive | Moderately active | Active | P valuea |
| Men (n = 5436) | |||||
| n (%) | 913(16.8) | 1737(32.0) | 1416(26.0) | 1370(25.2) | |
| Age (years)b | 55.3 ± 9.0 | 52.5 ± 8.5 | 51.9 ± 8.5 | 50.9 ± 8.8 | <0.001 |
| Educational level n (%) | <0.001 | ||||
| No schooling (n = 361) | 70(7.7) | 103(5.9) | 97(6.9) | 91(6.6) | |
| Primary (n = 1830) | 315(34.5) | 506(29.1) | 490(34.6) | 519(37.9) | |
| Secondary (n = 708) | 114(12.5) | 249(14.3) | 196(13.8) | 149(10.9) | |
| Vocational/university (n = 2537) | 414(45.3) | 879(50.6) | 633(44.7) | 611(44.6) | |
| Alcohol consumption n (%) | <0.001 | ||||
| None (n = 420) | 107(11.7) | 118(6.8) | 98(6.9) | 97(7.1) | |
| 1–≤5 g/day (n = 1030) | 199(21.8) | 321(18.5) | 260(18.4) | 250(18.2) | |
| >5–≤10 g/day (n = 748) | 124(13.6) | 245(14.1) | 196(13.8) | 183(13.4) | |
| >10–≤40 g/day (n = 2182) | 327(35.8) | 716(41.2) | 577(40.7) | 562(41.0) | |
| >40 g/day (n = 1056) | 156(17.1) | 337(19.4) | 285(20.1) | 278(20.3) | |
| Fruit (g/day)c | 154.0(216.8) | 155.2(193.6) | 153.6(213.9) | 174.9(230.2) | <0.001 |
| Vegetables (g/day)c | 146.5(156.6) | 137.5(136.9) | 151.7(138.7) | 146.5(148.5) | 0.091 |
| Body mass index n (%) | <0.001 | ||||
| <25 kg/m2 (n = 1776) | 249(27.3) | 556(32.0) | 477(33.7) | 494(36.1) | |
| 25–29.9 kg/m2 (n = 2714) | 460(50.4) | 893(51.4) | 701(49.5) | 660(48.2) | |
| ≥30 kg/m2 (n = 946) | 204(22.3) | 288(16.6) | 238(16.8) | 216(15.8) | |
| Total cholesterol n (%) | 0.004 | ||||
| <5.2 mmol/L (n = 1498) | 232(25.4) | 431(24.8) | 413(29.2) | 422(30.8) | |
| 5.2–6.1 mmol/L (n = 2006) | 335(36.7) | 667(38.4) | 523(36.9) | 481(35.1) | |
| ≥6.0 mmol/L (n = 1932) | 346(37.9) | 639(36.8) | 480(33.9) | 467(34.1) | |
| Hypertension n (%)d | <0.001 | ||||
| No (n = 3340) | 505(55.3) | 1059(61.0) | 901(63.6) | 875(63.9) | |
| Yes (n = 2096) | 408(44.7) | 678(39.0) | 515(36.4) | 495(36.1) | |
| History of diabetes n (%) | <0.001 | ||||
| No (n = 5236) | 858(94.0) | 1677(96.5) | 1369(96.7) | 1332(97.2) | |
| Yes (n = 200) | 55(6.0) | 60(3.5) | 47(3.3) | 38(2.8) | |
| Smoking status n (%) | <0.001 | ||||
| Never (n = 1731) | 234(25.6) | 573(33.0) | 468(33.1) | 456(33.3) | |
| Former (n = 1964) | 327(35.8) | 636(36.6) | 498(35.2) | 503(36.7) | |
| Current (n = 1741) | 352(38.6) | 528(30.4) | 450(31.8) | 411(30.0) | |
| Women n = 9227 | |||||
| n (%) | 2449(26.5) | 3250(35.2) | 1926(20.9) | 1602(17.4) | |
| Age (years)b | 52.4 ± 9.6 | 52.1 ± 9.4 | 51.3 ± 8.8 | 51.5 ± 9.0 | <0.001 |
| Educational level n (%) | <0.001 | ||||
| No schooling (n = 887) | 489(20.0) | 287(8.8) | 79(4.1) | 32(2.0) | |
| Primary (n = 3018) | 1043(42.6) | 1016(31.3) | 518(26.9) | 441(27.5) | |
| Secondary (n = 1557) | 294(12.0) | 574(17.7) | 379(19.7) | 310(19.4) | |
| Vocational/University (n = 3765) | 623(25.4) | 1373(42.2) | 950(49.3) | 819(51.1) | |
| Alcohol consumption n (%) | <0.001 | ||||
| None (n = 2018) | 847(34.6) | 665(20.5) | 284(14.7) | 222(13.9) | |
| 1–≤5 g/day (n = 3364) | 806(32.9) | 1240(38.2) | 745(38.7) | 573(35.8) | |
| >5–≤10 g/day (n = 1307) | 275(11.2) | 436(13.4) | 313(16.3) | 283(17.7) | |
| >10–≤40 g/day (n = 2298) | 477(19.5) | 823(25.3) | 534(27.7) | 464(29.0) | |
| >40 g/day (n = 240) | 44(1.8) | 86(2.6) | 50(2.6) | 60(3.7) | |
| Fruit (g/day)c | 250.0(246.1) | 213.4(211.4) | 200.9(193.7) | 216.1(191.5) | <0.001 |
| Vegetables (g/day)c | 178.4(158.1) | 161.7(133.8) | 161.3(134.9) | 154.7(124.7) | <0.001 |
| Body mass index n (%) | <0.001 | ||||
| <25 kg/m2 (n = 4629) | 904(36.9) | 1666(51.3) | 1125(58.4) | 934(58.3) | |
| 25–29.9 kg/m2 (n = 3077) | 895(36.5) | 1107(34.1) | 588(30.5) | 487(30.4) | |
| ≥3 kg/m2 (n = 1521) | 650(26.5) | 477(14.7) | 213(11.1) | 181(11.3) | |
| Total cholesterol n (%) | 0.142 | ||||
| <5.2 mmol/L (n = 2588) | 658(26.9) | 942(29.0) | 547(28.4) | 441(27.5) | |
| 5.2–6.21 mmol/L (n = 3297) | 875(35.7) | 1119(34.4) | 724(37.6) | 579(36.1) | |
| ≥6.2 mmol/L (n = 3342) | 916(37.4) | 1189(36.6) | 655(34.0) | 582(36.3) | |
| Hypertension n (%)d | <0.001 | ||||
| No (n = 6165) | 1588(64.8) | 2153(66.2) | 1372(71.2) | 1052(65.7) | |
| Yes (n = 3062) | 861(35.2) | 1097(33.8) | 554(28.8) | 550(34.3) | |
| History of diabetes n (%) | <0.001 | ||||
| No (n = 9028) | 2372(96.9) | 3183(97.9) | 1890(98.1) | 1583(98.8) | |
| Yes (n = 199) | 77(3.1) | 67(2.1) | 36(1.9) | 19(1.2) | |
| Smoking status n (%) | <0.001 | ||||
| Never (n = 5217) | 1561(63.7) | 1831(56.3) | 1014(52.6) | 811(50.6) | |
| Former (n = 1974) | 359(14.7) | 704(21.7) | 475(24.7) | 436(27.2) | |
| Current (n = 2036) | 529(21.6) | 715(22.0) | 437(22.7) | 355(22.2) | |
P values are derived from a Kruskal Wallis or ANOVA test for continuous variables or from a Chi-square test for categorical variables;
Values for normally distributed variables are expressed as mean ± standard deviation;
Values from non-normally distributed variables are expressed as median (interquartile range);
Hypertension definition is based on medical history and/or clinical measurements.
Association of physical activity with Coronary Heart Disease overall
Compared to being inactive, all other physical activity levels were associated with lower CHD risk in the age-adjusted model (Table 2). Additional adjustments for smoking status, educational level, alcohol, fruit, and vegetable consumption marginally attenuated the HRs but a significant association with CHD risk remained in participants who were moderately inactive (HR 0.88), moderately active (HR 0.76), and active (HR 0.78). Notably, the CHD risk in moderately active and active participants were similar. After exclusion of the first 2 years of follow-up, the association between physical activity and CHD risk was maintained (Table 2). After adjusting for intermediaries, a significant association with CHD risk remained only in participants who were moderately active (HR 0.83) and active (HR 0.83). Heterogeneity across study centres, for all models, was low (Table 2).
Hazard ratios of non-fatal or fatal coronary heart disease events according to physical activity levels
| Physical activity level | HRa | (95% CI) | N total | N cases | I2b | (95% CI) |
|---|---|---|---|---|---|---|
| Model 1c | ||||||
| Inactive | 1 | REF | 5754 | 2546 | ||
| Moderately inactive | 0.81 | (0.75–0.89) | 7635 | 2822 | 11% | (0%, 46%) |
| Moderately active | 0.70 | (0.62–0.78) | 5058 | 1815 | 28% | (0%, 58%) |
| Active | 0.72 | (0.65–0.79) | 4609 | 1730 | 0% | (0%, 47%) |
| Model 2d | ||||||
| Inactive | 1 | REF | 5754 | 2546 | ||
| Moderately inactive | 0.88 | (0.80–0.96) | 7635 | 2822 | 0% | (0%, 47%) |
| Moderately active | 0.76 | (0.67–0.86) | 5058 | 1815 | 29% | (0%, 58%) |
| Active | 0.78 | (0.70–0.86) | 4609 | 1730 | 0% | (0%, 47%) |
| Model 2, excluding first 2 years of follow-up | ||||||
| Inactive | 1 | REF | 5478 | 2290 | ||
| Moderately inactive | 0.87 | (0.79–0.96) | 7284 | 2505 | 13% | (0%, 47%) |
| Moderately active | 0.76 | (0.67–0.86) | 4852 | 1637 | 30% | (0%, 59%) |
| Active | 0.76 | (0.68–0.84) | 4382 | 1526 | 0% | (0%, 47%) |
| Model 3,e including intermediaries | ||||||
| Inactive | 1 | REF | 5754 | 2546 | ||
| Moderately in active | 0.91 | (0.82–1.01) | 7635 | 2822 | 0% | (0%, 47%) |
| Moderately active | 0.83 | (0.73–0.94) | 5058 | 1815 | 0% | (0%, 47%) |
| Active | 0.83 | (0.74–0.94) | 4609 | 1730 | 0% | (0%, 47%) |
Hazard ratio (HR) and 95% confidence intervals (CI) estimated from Prentice-weighted Cox proportional hazard models. HRs from each study centre were combined using random effects meta-analysis.
I2 describes the heterogeneity across 21 study centres (eight countries)
Model 1: adjusted for age at baseline, stratified by sex, and study centre.
Model 2: Model 1 and additionally adjusted for educational level (none, primary, secondary, or vocational/university), alcohol consumption (0, 0.1–5, 5.1–10, 11–40, >40 g/day), smoking status (never, former, and current), fruit, and vegetable intake.
Model 3: Model 2 and additionally adjusted for BMI, cholesterol, hypertension, and diabetes.
Association of physical activity with Coronary Heart Disease risk in those with and without Coronary Heart Disease risk factors
Figure 2 shows the combined associations of physical activity and CHD risk factors on risk of CHD. As expected, CHD risk was greater amongst participants who had higher BMI, higher total cholesterol levels, had hypertension or diabetes or who were smokers, compared with those without these risk factors.
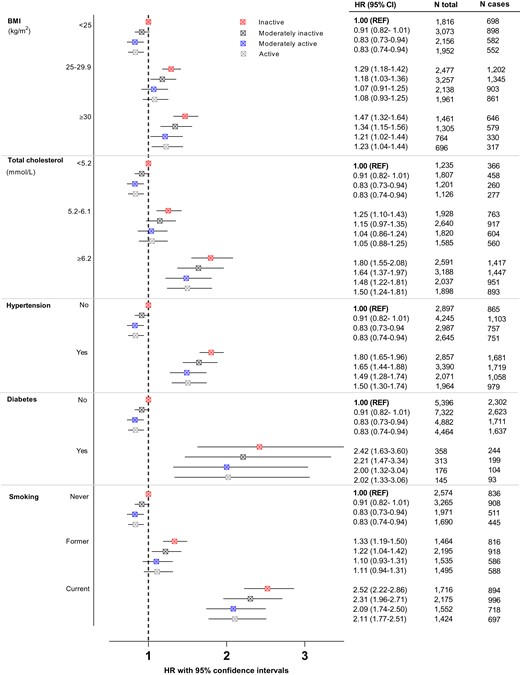
Combined estimates of CHD across physical activity levels amongst participants with CHD risk factors defined by BMI, total cholesterol, hypertension (clinically and/or history), history of diabetes, and smoking status and with those without the risk factor and inactive as the reference group (REF). The model for each risk factor was adjusted for age at baseline, sex (stratification), centre (stratification), alcohol consumption, educational level, fruit intake, vegetable intake, and all the other risk factors.
Higher levels of physical activity were associated with lower CHD risk amongst those without the risk factors. Among participants with CHD risk factors, higher levels of physical activity tended to be associated with lower CHD risk. However, physical activity did not completely offset the higher risk conferred by the CHD risk factors. For example, inactive participants with hypertension had an 80% (95%CI 65–96%) higher CHD risk than inactive participants without hypertension, whereas moderately active participants with hypertension still had a 49% (95%CI 28–74%) higher CHD risk.
Of note, among ‘intermediate risk’ participants (i.e. those who were overweight, had total cholesterol levels 5.2–6.1 mmol/L, or who were former smokers), CHD risk was attenuated with higher levels of physical activity to similar risk as inactive participants without the respective risk factors. For example, inactive participants with intermediate total cholesterol levels had 25% (95%CI 10–43%) higher CHD risk compared to inactive participants with low (<5.2 mmol/L) total cholesterol levels, whereas moderatively active participants with intermediate total cholesterol levels did not have elevated CHD risk (HR1.04, 95%CI 0.86–1.24). However, when the joint association of non-HDL and physical activity on CHD risk was assessed, physical activity again attenuated the CHD risk, but excess CHD risk remained across all levels of non-HDL cholesterol above 3.7 mmol/L (see Supplementary material online, Figure S1). Further, the highest physical activity level was similarly associated with CHD risk, as the second-highest level (moderately active). This phenomenon was observed across all risk factors and amongst those without the risk factor. No multiplicative interaction was present between physical activity and any of the risk factors.
In the sensitivity analysis that excluded those with a BMI <18.5 kg/m2 (n = 261) the results remained similar (see Supplementary material online, Table S3). In the sex-stratified analyses, the association between physical activity and CHD risk tended to be J-shaped (see Supplementary material online, Figure S2) in men, whereas in women, a clear dose–response relationship was evident (see Supplementary material online, Figure S3) in those with and without the CHD risk factor. In addition, amongst women with higher levels of BMI and total cholesterol, higher physical activity attenuated CHD risk to levels similar to inactive participants without these risk factors.
Population preventable fraction
Assuming a causal effect of physical activity, the estimated proportion of CHD events that could be prevented if all inactive participants with obesity, hypercholesterolaemia, hypertension, diabetes, or those who currently smoked became moderately inactive were 2.7%, 2.7%, 2.7%, 2.7%, and 2.6%, respectively. Corresponding preventable fractions were 4.6%, 5.3%, 5.1%, 4.2%, and 5.6% if all inactive and moderately inactive became moderately active.
Discussion
In this large prospective case-cohort study that included more than 13 000 incident CHD cases from eight European countries, we found that moderate physical activity was associated with lower CHD risk in individuals with and without traditional CHD risk factors. Any physical activity level above completely inactive somewhat attenuated the risk of CHD amongst participants with obesity, hypercholesterolaemia, hypertension, diabetes, or those who currently smoke, but did not completely offset the CHD risk. The highest level of physical activity level did not appear to further attenuate the CHD risk beyond that observed with moderate levels of physical activity.
Our finding that higher physical activity is associated with lower risk of CHD is in agreement with evidence synthesized in meta-analytic reviews.23,24 We showed a trend of lower CHD risk with a higher physical activity amongst participants with various CHD risk factors such as obesity, hypercholesterolaemia, hypertension, diabetes, and current smoking. Previous studies that investigated the relationship between physical activity and CHD risk amongst high-risk individuals have predominantly focused on only leisure time physical activity and were only conducted in women.7,8
The average difference in energy expenditure between each of the physical activity categories used in this study is about 5 kJ/kg/day.11 This difference in physical activity energy expenditure is equivalent to 20 min of a moderately intense (4.5 MET) activity like brisk walking per day or 30 min of normal (3.3 MET) walking per day, which is very similar to the current minimal physical activity recommendation for health of at least 150 mins of moderate physical activity per week.10 The lowest excess CHD risk was noted amongst individuals who are moderately active which corresponds to an activity energy expenditure difference of 10 kJ/kg/day, equivalent to 40 mins of brisk walking or one hour of normal walking per day. This concurs with the recommended higher target of 300 mins of moderate activity per week by the World Health Organization.10 If all inactive and moderately inactive individuals become moderately active 4.2–5.6% of CHD cases may be prevented. Nevertheless, higher level of physical activity may be difficult to attain for completely inactive individuals,25 but our results suggest that even limited physical activity may have a positive impact on CHD risk. Indeed, we estimated that ∼2.7% of CHD cases could be prevented if all inactive individuals, including those with CHD risk factors, were to incorporate just a little bit more activity in their daily life.
Diabetes, hypertension, smoking, obesity, and hypercholesterolaemia are well-known modifiable risk factors for CHD.6 Indeed, the Women’s Health Study that enrolled women 45 years and older showed that hypertension, total cholesterol, low-density lipoprotein, and high-density lipoprotein cholesterol, BMI, and diabetes explained from 5% to 27.1% of the association between physical activity and CHD.26 Physical activity may lower CHD risk through multiple mechanisms such as improving insulin sensitivity due to an increase in GLUT-4 proteins in skeletal muscle,27 as well as its favourable effect on lipids.28 Further, moderate physical activity reduces blood pressure, achieved by a reduction in vascular tone,29 to a greater extent in hypertensive compared to normotensive individuals.30 Our study showed that moderate physical activity may be sufficient to eliminate the elevated CHD risk amongst those with intermediate levels of CHD risk factors (e.g. overweight, borderline total cholesterol, or previous smoking) but not in those with higher levels of these risk factors. It is possible that the real magnitude of the attenuating effect of activity is much stronger, since the self-report measure of physical activity has considerable error, compared to for example the risk factors which are measured with greater precision. Physical activity may be able to reverse the formation of atherosclerotic plaques but this effect may be diminished in advanced disease where irreversible vascular changes have already occurred.31 Indeed, our study showed that higher physical activity does not completely compensate for having a risk factor because CHD risk is still higher than those without the risk factor but inactive. Nevertheless, physical activity remains important to counter the detrimental effects of obesity, hypercholesterolaemia, hypertension, diabetes, and smoking on CHD risk and to protect against CHD in those without these risk factors.
The plateau effect seen for the two highest levels of physical activity on the risk of CHD amongst those with CHD risk factors has been previously reported, but the evidence is inconsistent. The prospective Nurses’ Health Study that included female health workers (30–55 years of age) also found that CHD risk was similar amongst the moderately active and most active groups.7 Further, in another study of US women older than 45 years, a plateau effect of increasing physical activity on the risk of CHD was observed amongst those who were overweight or who smoke, while a U-shaped association was noted amongst those with a history of hypertension or those with a history of elevated cholesterol levels.8 Possible explanations for the similar risk observed between moderately active and active groups include misclassification bias, greater difficulty in maintaining a highly active lifestyle for a long duration, or a true threshold effect. In support, a dose–response relationship between physical activity and CHD risk was reported in 20 out of 23 studies in a systematic review, while only two studies reported a threshold effect.32 Moreover, in a large prospective cohort study conducted in 44 452 men that also evaluated changes in physical activity every 2 years, a dose–response relationship was evident between physical activity and CHD risk amongst those with and without various risk factors such as smoking, hypertension, hypercholesterolaemia, amongst others.33 That being said, it is possible that in those with asymptomatic CHD, vigorous physical activity may increase risk of CHD events which may contribute to a flattening of the risk curve or even a U-shaped curve.34 Also, the severity of coronary atherosclerosis increases with age, even in active individuals,35 which may increase the risk of exercise-induced CHD. Furthermore, occupations that involve heavy labour may associate with higher risk of cardiovascular events and all-cause mortality36 and this may have diluted our findings. However, this detrimental association between high occupational physical activity and all-cause mortality has not been a consistent finding37,38 and may be explained by the confounding effect of socioeconomic status on this association.
Strengths of this study include the large number of participants enrolled at multiple centres across eight European countries, who were followed up for several years, the rigorous assessment of CHD endpoints and the objective measurement of multiple CHD risk factors. Heterogeneity was low across the different countries. In addition, the possible bias from reverse causation was evaluated through exclusion of the first 2 years of follow-up. The limitations include the fact that physical activity and some of the risk factors were self-reported and therefore misreporting cannot be excluded. However, we used physical activity questionnaires that were validated and reliable.12 Furthermore, the assessment of physical activity and risk factors occurred at baseline and may have changed during the follow-up period.39 These limitations in measuring physical activity may have underestimated the contribution of physical activity and may have attenuated our observed associations. In addition, the temporal changes in risk factors such as body weight, which may influence CHD risk,40 were not accounted for in this study. Although we adjusted our estimates for several potential confounders, we cannot exclude the possibility that residual confounding may still remain. Finally, the current findings are based on white European populations and therefore the generalizability to other population groups, such as ethnic minorities, may be limited.
In conclusion, our study highlights the clear associations of even small amounts of physical activity amongst those with and without established CHD risk factors. Compared to being inactive, moderate physical activity, equivalent to the upper behavioural target specified by the health recommendations, was associated with the lowest CHD risk across all risk factor categories, but did not completely attenuate the effects of CHD risk factors. Physical activity should continue to be encouraged in conjunction with other health behaviour modifications and preventive medication in the primary prevention of CHD.
Supplementary material
Supplementary material is available at European Journal of Preventive Cardiology.
Authors’ contributions
N.J.W., C.L., N.G.F., S.B., A.S.B., E.R. and J.D. designed the EPIC-CVD case-cohort study and assessed and validated the endpoints. M.S., P.W., and M.F. performed the statistical analysis; drafted the manuscript. P.W., M.S., J.A., U.E., J.M.H., C.Las and E.W. interpreted and revised the first version of manuscript for critical content. All authors contributed to the final version of the manuscript.
Acknowledgements
We thank all the participants and staff that contributed to the EPIC-CVD study. We acknowledge Sarah Spackman (EPIC-CVD Data Manager) and the other staff at the Coordinating Centres that were involved in data-handling and sample preparations. We are grateful to Nicola Kerrison, Stephen Sharp and the laboratory team at the MRC Epidemiology Unit for their assistance in this project.
Funding
The coordination of EPIC is financially supported by International Agency for Research on Cancer (IARC) and also by the Department of Epidemiology and Biostatistics, School of Public Health, Imperial College London which has additional infrastructure support provided by the NIHR Imperial Biomedical Research Centre (BRC). The establishment of the random sub-cohort was supported by the EU Sixth Framework Programme (FP6) (grant LSHM_CT_2006_037197 to the InterAct project) and the Medical Research Council Epidemiology Unit (grants MC_UU_12015/1, MC_UU_12015/3, and MC_UU_12015/5).
The national cohorts are supported by: Danish Cancer Society (Denmark); Ligue Contre le Cancer, Institut Gustave Roussy, Mutuelle Générale de l’Education Nationale, Institut National de la Santé et de la Recherche Médicale (INSERM) (France); German Cancer Aid, German Cancer Research Center (DKFZ), German Institute of Human Nutrition Potsdam-Rehbruecke (DIfE), Federal Ministry of Education and Research (BMBF) (Germany); Associazione Italiana per la Ricerca sul Cancro-AIRC-Italy, Compagnia di SanPaolo and National Research Council (Italy); Dutch Ministry of Public Health, Welfare and Sports (VWS), Netherlands Cancer Registry (NKR), LK Research Funds, Dutch Prevention Funds, Dutch ZON (Zorg Onderzoek Nederland), World Cancer Research Fund (WCRF), Statistics Netherlands (The Netherlands); Health Research Fund (FIS) - Instituto de Salud Carlos III (ISCIII), Regional Governments of Andalucía, Asturias, Basque Country, Murcia and Navarra, and the Catalan Institute of Oncology - ICO (Spain); Swedish Cancer Society, Swedish Research Council and County Councils of Skåne and Västerbotten (Sweden); The EPIC-Norfolk study (DOI 10.22025/2019.10.105.00004) has received funding from the Medical Research Council (MR/N003284/1, MC-UU_12015/1, and MC_UU_00006/1) and Cancer Research UK (C864/A14136) and EPIC-Oxford received funding from the Medial Research Council (MR/M012190/1) and Cancer Research UK (C8221/A29017) (UK). Dr. Camille Lassale received the support of a fellowship from ‘La Caixa’ Foundation (ID 100010434). The fellowship code is LCF/BQ/PR21/11840003. Claudia Langenberg, Nita Forouhi, Soren Brage, and Nick Wareham were supported by the UK Medical Research Council (MC_UU_00006/1, MC_UU_00006/3, and MC_UU_00006/4) and also received funding from NIHR Cambridge Biomedical Research Centre: nutrition, diet, and lifestyle research theme (IS-BRC-1215-20014).
Data Availability
This study used EPIC data provided by EPIC centres. Details on how to access EPIC data and biospecimens are available at: https://epic.iarc.fr/access/index.php.
Disclaimer
Where authors are identified as personnel of the International Agency for Research on Cancer/World Health Organization, the authors alone are responsible for the views expressed in this article and they do not necessarily represent the decisions, policy or views of the International Agency for Research on Cancer/World Health Organization.
References
Author notes
Conflict of interest: All the authors have nothing relevant to disclose.

Comments