


Abstract
Body mass index (BMI) defined obesity is paradoxically associated with lower all-cause mortality in patients with known cardiovascular disease. This study aims to determine the role of physical fitness in the obesity paradox in women with ischaemic heart disease (IHD).
Women undergoing invasive coronary angiography with signs/symptoms of IHD in the Women’s Ischemia Syndrome Evaluation (WISE) prospective cohort (enrolled 1997–2001) were analysed. This study investigated the longer-term risk of major adverse cardiovascular events (MACE) and all-cause mortality associated with BMI and physical fitness measured by Duke Activity Status Index (DASI). Overweight was defined as BMl ≥25 to 30 kg/m2, obese as BMI ≥30 kg/m2, unfit as DASI scores <25, equivalent to ≤7 metabolic equivalents. Among 899 women, 18.6% were normal BMI-fit, 11.4% overweight-fit, 10.4% obese-fit, 15.3% normal BMI-unfit, 23.8% overweight-unfit, and 30.4% obese-unfit. In adjusted models compared to normal BMI-fit, normal BMI-unfit women had higher MACE risk [hazard ratio (HR) 1.65, 95% confidence interval (CI) 1.17–2.32; P = 0.004]; whereas obese-fit and overweight-fit women had lower risk of mortality (HR 0.60, 95% CI 0.40–0.89; P = 0.012 and HR 0.62, 95% CI 0.41–0.92; P = 0.018, respectively).
To address the paradox of body weight and outcomes in women, we report for the first time that among women with signs/symptoms of IHD overweight-fit and obese-fit were at lower risk of long-term all-cause mortality; whereas normal BMI-unfit were at higher risk of MACE. Physical fitness may contribute to the obesity paradox in women, warranting future studies to better understand associations between body weight, body composition, and physical fitness to improve cardiovascular outcomes in women.
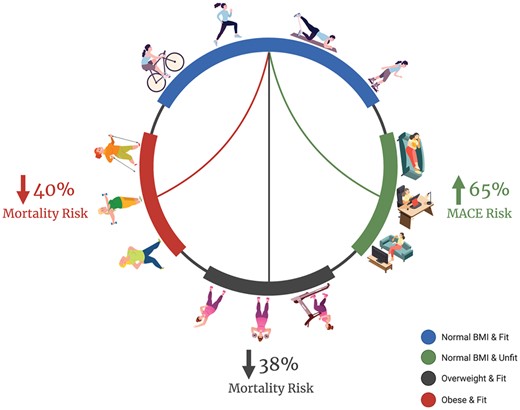
Risk of all-cause mortality by body weight and physical fitness groups. Figure created with BioRender.com.
See the editorial comment for this article ‘The fat but fit paradox: what do we know in women with heart disease’, by Kai Jin, https://doi.org/10.1093/eurjpc/zwac057.
Introduction
Cardiovascular disease (CVD) remains the leading cause of death in women.1 There is a steady increase in the prevalence of overweight and obesity2 despite an increase in physical fitness in the USA.1,2 Obesity and low levels of physical activity are known risk factors for CVD and are more common in women.1 However, there are conflicting results on the association of body mass index (BMI) measured body weight and mortality. While some studies describe an increased risk of death in overweight and obese men and women;3–5 others have described an inverse relationship between overweight and obesity and cardiovascular and all-cause mortality, commonly described as the ‘obesity paradox’.6–8
Fitness is a known independent predictor of cardiovascular morbidity and mortality in women.9–11 Several studies suggest that fitness markedly alters the relationship between BMI and mortality.12–18 The BMI-strata assumes that after adjusting weight for height, all individuals have the same relative body fatness and fails to account for body composition. Fitness, on the other hand, correlates with body composition and body weight by promoting fat loss while maintaining or increasing lean mass.19,20 There are important differences in sex-specific body composition, whereby women have relatively higher fat mass and lower lean mass compared with men.21 Furthermore, women have higher fat mass distributed subcutaneously in hips and thighs, whereas men have higher lean mass and visceral fat distributed in the trunk and abdomen.21
The relation of physical fitness and body weight with CVD events and mortality in ischaemic heart disease (IHD) is limited and predominantly reported in men.16–18 Using the Women’s Ischemia Syndrome Evaluation (WISE) cohort, we investigated the joint association of body weight and physical fitness on long-term major adverse cardiovascular events (MACE) and all-cause mortality in women with signs/symptom of IHD.
Methods
Study population
The original WISE is a multicentre National Heart, Lung and Blood Institute (NHLBI) prospective cohort. As previously described, women with signs/symptoms of IHD who had completed clinically indicated invasive coronary angiography were enrolled 1997–2001 and followed longitudinally for cardiovascular events and/or death.22 Each woman provided informed consent and the protocol was approved by the institutional review boards at the University of Alabama at Birmingham, the University of Florida, Gainesville, the University of Pittsburgh, Pittsburgh, PA, and Allegheny General Hospital, Pittsburgh, PA. The data underlying this article are available in the article and in its online supplementary material.
At enrollment, each woman had baseline evaluation that included collection of demographic information, Duke Activity Status Index (DASI) questionnaire, a physical examination with collection of physical measurements including BMI and waist circumference (WC), and blood sampling including assessment of inflammatory markers [high-sensitivity C-reactive protein (hs-CRP) and interleukin-6 (IL-6)], as detailed previously.22
All women had an invasive coronary angiogram performed at baseline. WISE angiographic core laboratory (Rhode Island Hospital, Providence, RI, USA) investigators masked to subject data performed qualitative and quantitative analyses of invasive coronary angiogram completed at baseline.22 Obstructive coronary artery disease (CAD) was defined as the presence of one or more stenoses ≥50% in diameter, minimal CAD as maximum diameter stenosis 20–49%, and no CAD as <20% stenosis in all coronary arteries.23 In the WISE cohort, an angiographic CAD severity score (0–100) was calculated based on stenosis severity weighted by proximal lesion.23
Classification of body weight and physical fitness assessment
BMI was calculated as body weight in kilograms divided by the square of the height in metres (kg/m2). Normal BMI was defined as BMI <25 kg/m2, overweight as BMI 25–29 kg/m2, and obesity as BMI ≥30 kg/m2.24 Only 16 subjects (1.8% of study cohort) were ‘underweight’ (BMI ≤18.5 kg/m2), and the results were unchanged when these subjects were excluded. Waist circumference was measured between the iliac crest and lowermost level of the ribs. Hip circumference was measured horizontally over the greater posterior extension of buttocks. Waist circumference was divided into two groups, and defined WC >88 cm as high and WC ≤88 cm as low. Waist–hip ratio (WHR) was also divided into two groups and defined WHR ≥0.85 as high and WHR ≤0.85 as low using cut-offs for women specified by the World Health Organization.25 All measurements were performed by trained staff.
The DASI questionnaire, an assessment of functional capacity derived from self-reported ability to perform various activities, was used to measure physical fitness.26 Positive response scores are summed to get a total DASI score that is an estimate of maximal oxygen consumption. This total score if divided by 3.5 gives an estimate of metabolic equivalents (METs). As in our prior work, a DASI score greater than 25 (>7 METs) corresponding to Stage 2 of the Bruce protocol was defined as fit and <25 as unfit.27 Scores for the DASI have been correlated with measured oxygen uptake (r = 0.58, P < 0.0001)26 and validated within a representative subset of the WISE cohort with symptom-limited exercise treadmill testing.28
Major adverse cardiovascular events and all-cause mortality
Follow-up for events were completed through annual telephone interview in person visit, and/or mail contact by experienced site staff for up to 10-year follow-up. The outcomes of interest were the first occurrence of MACE among all-cause death, non-fatal myocardial infarction, stroke, or hospitalization for heart failure adjudicated based on review of medical record. The National Death Index (NDI) was used to determine mortality at 10-year follow-up and verification was performed at the clinical sites. Women were considered alive if they were not reported as deceased in the NDI search.
Statistical analysis
The study population for this analysis consisted of 899 (95.2%) of 944 women who had nonmissing data for physical fitness and BMI at baseline and followed longitudinally for cardiovascular events and mortality. Differences in baseline demographics and clinical characteristics were assessed by χ2 tests for categorical variables and Wilcoxon rank sum tests or Kruskal–Wallis tests for continuous variables by body weight and physical fitness and by the combined groups: normal BMI-fit (reference), overweight-fit, obese-fit, normal BMI-unfit, overweight-unfit, and obese-unfit.
The Kaplan–Meier method was used to estimate 10-year cumulative incidence rates of MACE and all-cause mortality by body weight and physical fitness groups. Participants who did not experience an outcome of interest were censored at either 10 years or the last date of follow-up before 10 years.
Multivariable cox proportional hazards regression was used to estimate adjusted 10-year relative risks of MACE and all-cause mortality in relation to body weight and physical fitness, WC and physical fitness, and WHR and physical fitness. Cox models were adjusted for known predictors of MACE and mortality as described in existing literature, including self-reported age, smoking status, CAD severity score, and history of congestive heart failure. We then conducted stepwise selection to refine the model. All variables in Table 1 were considered for inclusion, excluding those with >5% missing data. Furthermore, among highly correlated variables, we selected the one with the lowest univariable P-value for inclusion. Predictors were selected based on significance or trend towards significance (P < 0.10). As a result of the stepwise selection, history of hypertension and history of diabetes were added to both models. In addition, postmenopausal status was added to the MACE model.
Baseline characteristics of study population by body weight and physical fitness groups
| Characteristics at study entry | Normal BMI-Fit (N = 77) | Normal BMI-Unfit (N = 137) | Overweight-Fit (N = 102) | Overweight-Unfit (N = 212) | Obese-Fit (N = 93) | ObeseUnfit (n = 271) | P-value |
|---|---|---|---|---|---|---|---|
| Age, mean (SD), years | 57.2 (11.7) | 61.8 (12.7) | 57.6 (10.8) | 59.1 (11.7) | 56.3 (10.3) | 57.3 (11.2) | 0.001 |
| Non-White race, N (%) | 3 (3.9) | 20 (14.6) | 12 (11.8) | 40 (18.9) | 18 (19.4) | 74 (27.3) | <0.001 |
| History of hypertension, N (%) | 26 (33.8) | 78 (57.4) | 49 (48.0) | 122 (57.8) | 62 (67.4) | 189 (69.7) | <0.001 |
| History of diabetes, N (%) | 3 (3.9) | 26 (19.0) | 15 (14.7) | 54 (25.6) | 21 (22.6) | 100 (37.2) | <0.001 |
| History of dyslipidaemia, N (%) | 29 (39.2) | 74 (56.5) | 43 (44.8) | 107 (56.3) | 35 (40.2) | 160 (64.5) | <0.001 |
| Family history of CAD, N (%) | 47 (61.0) | 86 (64.7) | 62 (61.4) | 138 (68.0) | 58 (63.0) | 185 (70.1) | 0.470 |
| Smoker, N (%) | 16 (20.8) | 40 (29.2) | 20 (19.6) | 51 (24.2) | 9 (9.7) | 40 (14.8) | 0.001 |
| Ever smoker, N (%) | 38 (49.4) | 81 (59.1) | 49 (48.0) | 119 (56.4) | 42 (45.2) | 145 (53.5) | 0.238 |
| Postmenopausal, N (%) | 59 (76.6) | 114 (83.2) | 72 (70.6) | 162 (76.4) | 64 (68.8) | 198 (73.1) | 0.119 |
| Ever used hormone therapy, N (%) | 47 (61.0) | 76 (55.5) | 50 (49.0) | 106 (50.7) | 48 (52.2) | 127 (47.0) | 0.296 |
| Metabolic syndrome, N (%) | 7 (9.1) | 30 (21.9) | 45 (44.1) | 90 (42.5) | 44 (47.3) | 164 (60.5) | <0.001 |
| CAD severity score, mean (SD) | 13.9 (15.9) | 16.0 (14.2) | 12.0 (12.2) | 17.0 (16.1) | 12.7 (14.7) | 14.7 (14.4) | 0.001 |
| Obstructive CAD, N (%) | 24 (31.6) | 57 (42.2) | 29 (28.7) | 103 (48.6) | 18 (19.4) | 112 (42.1) | <0.001 |
| SBP, mean (SD), mmHg | 128.5 (22.0) | 135.6 (24.4) | 132.2 (19.2) | 137.5 (22.6) | 138.3 (19.7) | 140.7 (21.4) | 0.001 |
| DBP, mean (SD), mmHg | 72.8 (10.4) | 74.5 (13.5) | 75.2 (11.9) | 77.3 (11.6) | 79.3 (11.6) | 78.1 (12.2) | 0.001 |
| BMI, mean (SD) | 22.2 (1.9) | 22.2 (2.3) | 27.5 (1.4) | 27.5 (1.5) | 35.0 (4.6) | 36.2 (5.4) | <0.001 |
| Waist circumference, mean (SD), cm | 74.8 (10.0) | 77.3 (13.1) | 87.7 (9.6) | 91.7 (11.5) | 99.1 (14.1) | 108.5 (17.5) | <0.001 |
| Waist–hip ratio, mean (SD) | 0.8 (0.1) | 0.8 (0.1) | 0.8 (0.1) | 0.8 (0.1) | 0.9 (0.1) | 0.9 (0.1) | <0.001 |
| Waist-height ratio, mean (SD) | 0.5 (0.1) | 0.5 (0.1) | 0.5 (0.1) | 0.6 (0.1) | 0.6 (0.1) | 0.7 (0.1) | <0.001 |
| Lipids, mean (SD), mg/dL | |||||||
| Total cholesterol | 210.4 (41.1) | 214.3 (55.4) | 212.6 (47.0) | 213.4 (49.3) | 213.6 (35.0) | 212.1 (54.4) | 0.966 |
| HDL-C | 58.1 (18.9) | 56.2 (16.9) | 51.3 (13.6) | 49.6 (15.1) | 51.7 (12.5) | 48.7 (13.7) | <0.001 |
| LDL-C | 126.1 (36.7) | 125.4 (50.4) | 124.1 (39.4) | 128.1 (40.1) | 128.4 (30.3) | 125.8 (48.9) | 0.739 |
| Triglycerides | 130.5 (66.3) | 168.5 (121.1) | 174.3 (98.4) | 184.6 (157.5) | 163.2 (80.1) | 227.4 (404.5) | 0.006 |
| FBG, mean (SD), mg/dL | 96.4 (34.9) | 111.1 (67.2) | 107.6 (41.8) | 107.2 (47.8) | 129.8 (65.1) | 123.1 (61.7) | <0.001 |
| Insulin, mean (SD), μU/mL | 4.6 (5.7) | 8.6 (14.5) | 6.9 (10.2) | 10.2 (14.5) | 9.7 (11.1) | 11.9 (13.7) | <0.001 |
| Haemoglobin, mean (SD), g/dL | 13.1 (1.3) | 13.0 (2.4) | 13.3 (1.3) | 12.9 (1.4) | 13.2 (1.2) | 12.8 (1.3) | 0.033 |
| hs-CRP, mean (SD), mg/L | 0.5 (1.1) | 0.6 (1.1) | 1.0 (1.7) | 0.9 (2.0) | 0.7 (0.9) | 1.0 (1.2) | <0.001 |
| Interleukin-6 | 3.1 (2.7) | 4.0 (5.0) | 4.1 (4.6) | 4.5 (4.8) | 3.7 (2.8) | 5.0 (4.0) | <0.001 |
BMI, body mass index; CAD, coronary artery disease; DASI, Duke Activity Status Index; DBP, diastolic blood pressure; FBG, fasting blood glucose; HDL-C, high-density lipoprotein-C; hs-CRP, high-sensitivity C-reactive protein; LDL-C, low-density lipoprotein-cholesterol; SBP, systolic blood pressure.
Spearman rank correlations were used to determine the relation between body weight and physical fitness and inflammatory markers, hs-CRP and IL-6 adjusting for physical fitness and BMI, respectively. Furthermore, multiple linear regression was used to explore the association between hs-CRP and IL-6 and the independent variables of interest including physical fitness level (fit vs. unfit) and BMI category (normal, overweight, and obese). Each of these multiple linear regression models was adjusted for the following variables: age, smoking, CAD severity score, history of heart failure, race, history of hypertension, history of diabetes, and metabolic syndrome. Six hundred and forty-seven women were included in the hs-CRP model, and 604 women were included in the IL-6 model. A P-value ≤0.05 was considered significant for all analyses. SAS software (SAS, version 9.2, Cary, NC, USA) was used for all analyses.
Results
Baseline characteristics by body weight and physical fitness
Among women included in this analysis, 18.6% were normal BMI-fit, 11.4% overweight-fit, 10.4% obese-fit, 15.3% normal BMI-unfit, 23.8% overweight-unfit, and 30.4% obese-unfit (Table 1). Normal BMI-unfit women were older, had highest percentage of smokers at study entry and ever smokers, and highest total cholesterol. Compared to normal BMI-fit women, normal BMI-unfit women had higher percentage of hypertension, dyslipidaemia, metabolic syndrome, obstructive CAD and higher mean systolic blood pressure, diastolic blood pressure, WC, low-density lipoprotein-cholesterol, triglycerides, fasting blood glucose, insulin, hs-CRP, and IL-6. Obese-fit women were younger, had lower percentage of smokers at study entry and obstructive CAD.
Major adverse cardiovascular events and all-cause mortality by body weight and physical fitness
At 5.8 years median follow-up (range 0–9.3 years) for MACE, 245 (27%) women had a MACE event. At 8.3 years median follow-up (range 0–11.3 years) for mortality, 174 (19%) of the women died. Normal BMI-fit status was associated with lower risk of MACE (P < 0.001) and all-cause mortality (P < 0.001), whereas normal BMI-unfit status was associated with higher risk (Figure 1A and B).
In adjusted models (Table 2), compared to normal BMI-fit, normal BMI-unfit was associated with a 1.65-fold higher risk of MACE (Figure 2A); whereas obese-fit and overweight-fit women had lower risk of all-cause mortality (Figure 2B). In adjusted models compared to low WC-fit, high WC-unfit were at 1.66-fold significantly higher risk of MACE and low WC-unfit were at a 1.7-fold higher risk of MACE (Supplementary material online, Figure S1). In adjusted models compared to low WHR-fit, high WHR-unfit were at 1.67-fold significantly higher risk of MACE and low WHR-unfit were at a 1.69-fold higher risk of MACE (Supplementary material online, Figure S2). We also found a trend towards higher mortality risk in unfit women regardless of whether they had high or low WC or WHR (Supplementary material online, Figures S1 and S2).
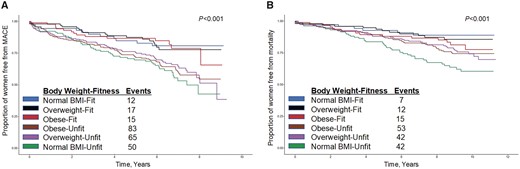
Major adverse cardiovascular events (A) and all-cause mortality (B) by body weight and physical fitness groups.
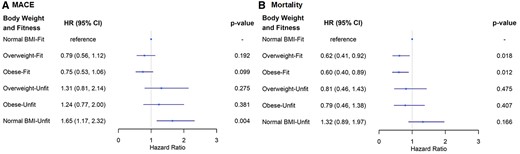
Adjusted risk of major adverse cardiovascular events (A) and all-cause mortality (B) by body weight and physical fitness groups. Hazard ratios in relation to reference group (normal body mass index-fit) adjusted for age, ever smoker, coronary artery disease severity score, history of congestive heart failure, diabetes, and hypertension in both models and postmenopausal status was also adjusted for in the major adverse cardiovascular events model.
Multivariable cox proportional hazards regression model for 10-year relative risks of MACE and all-cause mortality in relation to body weight and physical fitness
| Variables | Hazard ratio | 95% CI | P-value | |
|---|---|---|---|---|
| MACE | ||||
| Obese | 0.75 | 0.53 | 1.06 | 0.099 |
| Overweight | 0.80 | 0.56 | 1.12 | 0.192 |
| Low DASI | 1.65 | 1.17 | 2.32 | 0.004 |
| Age | 1.00 | 0.99 | 1.02 | 0.630 |
| Ever smoker | 1.92 | 1.45 | 2.55 | <0.001 |
| CAD severity score | 1.02 | 1.01 | 1.03 | <0.001 |
| History of heart failure | 2.88 | 2.05 | 4.03 | <0.001 |
| History of hypertension | 1.28 | 0.95 | 1.74 | 0.103 |
| History of diabetes | 2.00 | 1.49 | 2.70 | <0.001 |
| Postmenopausal | 1.52 | 0.96 | 2.40 | 0.073 |
| All-cause mortality | ||||
| Obese | 0.60 | 0.40 | 0.89 | 0.012 |
| Overweight | 0.62 | 0.41 | 0.92 | 0.018 |
| Low DASI | 1.32 | 0.89 | 1.97 | 0.166 |
| Age | 1.03 | 1.01 | 1.04 | <0.001 |
| Ever smoker | 1.88 | 1.35 | 2.61 | <0.001 |
| CAD severity score | 1.02 | 1.01 | 1.03 | <0.001 |
| History of heart failure | 2.77 | 1.89 | 4.06 | <0.001 |
| History of hypertension | 1.59 | 1.10 | 2.31 | 0.015 |
| History of diabetes | 2.18 | 1.54 | 3.09 | <0.001 |
Association of inflammation markers with body weight and physical fitness
There was a moderate correlation between BMI and hs-CRP (correlation coefficient (CC) 0.28, P < 0.001) and IL-6 (CC 0.19, P < 0.001) after adjustment for DASI. There was also a negative correlation between DASI and both hs-CRP (CC −0.16, P < 0.001) and IL-6 (CC −0.12, P < 0.001) after adjustment for BMI. In multivariable models, neither BMI nor DASI was found to be predictive of inflammation (hs-CRP and IL-6).
Discussion
There is increasing recognition of sex difference in CVD outcomes; however, the role of physical fitness in the obesity paradox in women with IHD had not been explored. This is the first study to evaluate body weight and physical fitness with long-term MACE and all-cause mortality among women with signs/symptoms of IHD. Overweight-fit and obese-fit women were at 38–40% lower risk of all-cause mortality; whereas, normal BMI-unfit women were at 65% higher risk for MACE (Graphical Abstract). These findings are consistent with and extend the obesity paradox to women with signs/symptoms of IHD and suggest that physical fitness may play an important role in the obesity paradox.
Overweight and obese-fit women had lower risk of all-cause mortality compared to normal BMI-fit indicating that among fit women the obesity paradox holds true similar to McAuley et al. in a prior study in male veterans.17 Whereas other studies report that obese-fit have lower mortality than obese-unfit suggesting that fitness modifies the increased risk associated with obesity.14,15 This is in contrast to a meta-analysis of individuals without CVD, reporting similar mortality among fit individuals regardless of BMI strata.12 Differences in results may be related to the populations being studied with a majority of studies conducted in men and individuals without CVD which differs from our cohort of women with signs/symptoms of IHD. A potential explanation for the paradoxical association between BMI and mortality in fit women in our study may be that physically fit individuals have lower body fat and higher lean mass.19,20 Lee et al.29 showed that the association between BMI and mortality was largely determined by the relation between lean mass and fat mass. Furthermore, the positive correlation between pro-inflammatory cytokines (hs-CRP and IL6) and BMI and the negative correlation between physical fitness and both hs-CRP and IL-6 suggests physical fitness may attenuate the inflammatory status associated with higher BMI.30
Similar to prior reports in men,16,18 in our cohort of women with signs/symptoms of IHD undergoing invasive angiography normal BMI-unfit women were at 1.7-fold higher risk of MACE compared to normal BMI-fit women. This may be due to more visceral fat deposits in physically unfit adults compared to fit individuals with the same BMI.31 However, our unfit women were at significantly higher risk of MACE regardless of measures of central fatness (i.e. low or high WC or WHR) suggesting other mechanisms are likely contributing. Although we did not assess body fat, our normal BMI-unfit women had more metabolic syndrome suggesting that these women may have normal-weight obesity which has also been associated with higher MACE risk.32 Normal-weight obesity, defined as normal BMI with elevated body fat,33 is increasingly recognized with a general prevalence of 2–28% in women.34,35 Furthermore, unlike prior studies where higher mortality in the normal BMI category was driven by underweight individuals36; our results were unchanged when underweight individuals were excluded. Although in our cohort normal BMI-low fitness women were older and had higher percentages of smoking, we adjusted for these in our multivariable analysis.
Limitations
This study uses longitudinal data from a well-characterized cohort of women with signs/symptoms of IHD who underwent baseline coronary angiography. Despite this, limitations should be considered. Our prospective, observational study is also limited in the assessment of causality. Because participants with poorer health are less likely to be fit, underlying disease may have introduced potential bias into our analyses; however, women with significant co-morbidities (cancer, heart failure) were excluded from the WISE cohort and we adjusted for significant risk factors such as age and smoking and comorbidities in our analyses. A limitation of this study is the lack of direct measures of physical fitness and body composition, although the DASI has been validated in women and correlated with METs on exercise testing in this cohort.26 In addition, measures of physical fitness have been reported to correlate with body composition.19,20 Our study was based on fitness and body weight collected at study entry and subsequent long-term cardiovascular events. Therefore, we cannot exclude the possibility that changes over time could have underestimated the results. Furthermore, survival bias due to losss of follow-up as result of an adverse event may have contributed to underestimation of long-term adverse event rates and associations.
Conclusions
Among women with signs/symptoms of IHD, overweight-fit and obese-fit women were at 38–40% lower risk of long-term all-cause mortality suggesting that physical fitness may have an important role in the obesity paradox in women with IHD. Furthermore, normal BMI-unfit women were at 65% higher risk of MACE emphasizing the importance of physical fitness assessment and exercise recommendations even in patients with normal BMI. Future studies measuring body fat and physical fitness are needed to better understand associations between body weight, body composition, and physical fitness to improve cardiovascular outcomes in women.
Supplementary material
Supplementary material is available at European Journal of Preventive Cardiology online.
Funding
This work was supported by contracts from the National Heart, Lung and Blood Institutes nos. N01-HV-68161, N01-HV-68162, N01-HV-68163, N01-HV-68164, grants T32HL116273, K23HL151867, U0164829, U01 HL649141, U01 HL649241, K23HL105787, T32HL69751, R01 HL090957, U54 AG065141, and 1R03AG032631 from the National Institute on Aging, GCRC grant MO1-RR00425 from the National Center for Research Resources, the National Center for Advancing Translational Sciences Grant UL1TR000124, and grants from the Gustavus and Louis Pfeiffer Research Foundation, Danville, NJ, the Women’s Guild of Cedars-Sinai Medical Center, Los Angeles, CA, the Ladies Hospital Aid Society of Western Pennsylvania, Pittsburgh, PA, and QMED, Inc., Laurence Harbor, NJ, the Edythe L. Broad and the Constance Austin Women’s Heart Research Fellowships, Cedars-Sinai Medical Center, Los Angeles, CA, the Barbra Streisand Women’s Cardiovascular Research and Education Program, Cedars-Sinai Medical Center, Los Angeles, the Society for Women’s Health Research (SWHR), Washington, DC, the Linda Joy Pollin Women’s Heart Health Program, the Erika Glazer Women’s Heart Health Project, and the Adelson Family Foundation, Cedars-Sinai Medical Center, Los Angeles, CA.
This work is solely the responsibility of the authors and does not necessarily represent the official views of the National Heart, Lung, and Blood Institute, the National Institutes of Health, or the U.S. Department of Health and Human Services.
Conflict of interest
C.N.B.M. serves as Board of Director for iRhythm and receives personal fees paid through CSMC from Abbott Diagnostics, Sanofi. All other authors report no disclosures. E.H. reports grants from NIH/NHLBI, during the conduct of the study; grants from Aastom Biosciences, Amgen, Amorcyte, AstraZeneca, Biocardia, Boehringer Ingelheim, Brigham and Women’s Hospital, Capricor, Cytori Therapeutics, Department of Defense, Direct Flow Medical, Duke Clinical Research Institute, East Carolina University, Everyfit Inc, Gilead, Ionis, Medtronic, Merck & Co., Mesoblast, PCORI, Relypsa, Sanofi Aventis, outside the submitted work. C.J.P. reports grants from NIH/NHLBI, during the conduct of the study; grants from NIH/NCATS, grants from BioCardia BC-14-001-02; Mesoblast, Inc. MSB-MPC-CHF001; Ventrix, Inc.; Athersys Inc. AMI MultiStem; Verily Life Sciences LLC-Project Baseline OSMB; Ironwood MSB-MPC-CHF00-DMC, Imbria Pharmaceuticals Inc.; Milestone Pharmaceuticals Inc.; Caladrius Biosciences, Inc.; Gatorade Trust; and McJunkin Family Foundation, outside the submitted work.

Comments