


Abstract
While obesity is a well-known cardiovascular risk factor, little is known whether age has a modifying effect. The aim of this study is to determine the age-dependent associations of body mass index (BMI) with cardiovascular outcomes.
A population-based cohort of 9 278 433 Koreans without prior cardiovascular disease were followed up for the incidence of myocardial infarction (MI), heart failure (HF), and all-cause death. The effect of BMI with optimal normal weight (18.5–22.9 kg/m2) as reference was analysed according to age groups [young (20–39 years), middle-aged (40–64 years), and elderly (≥65 years)] and age decades. During 8.2 years, MI, HF, and all-cause death occurred in 65 607 (0.71%), 131 903 (1.42%), and 306 065 (3.30%), respectively. Associations between BMI and all outcomes were significantly modified by age (P-for-interaction < 0.001). There was a proportional increase in incident MI according to BMI in young subjects; this relationship became U-shaped in middle-aged subjects and inversely proportional/plateauing in elderly subjects. A U-shaped relationship between BMI and incident HF was observed, but the impact of obesity was stronger in young subjects while the impact of underweight was stronger in middle-aged and elderly subjects. Meanwhile, lower BMI was associated with higher all-cause mortality in all ages, although this association was attenuated at the young age, and pre-obesity was associated with the greatest survival benefit. These associations were independent of sex, smoking, physical activity, and comorbidities.
The impact of BMI on cardiovascular risk differs according to age. Weight loss may be recommended for younger overweight subjects, while being mildly overweight may be beneficial at old age.
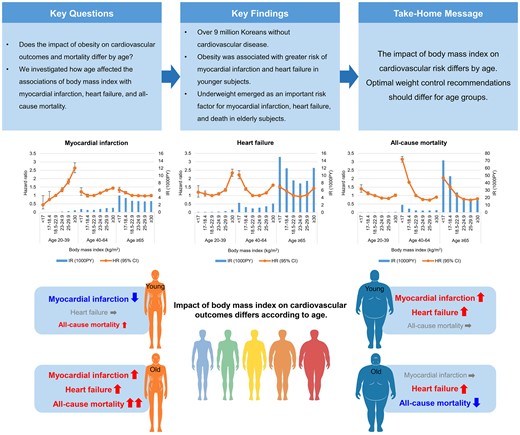
The impact of body mass index on cardiovascular risk differs according to age.
The association between obesity and risk of myocardial infarction or heart failure was stronger in younger subjects. Underweight was an important risk factor for myocardial infarction, heart failure, and death in elderly subjects. Weight loss may be recommended for younger overweight subjects, while being mildly overweight may be beneficial at old age.
See the editorial comment for this article ‘The ‘obesity paradox' in cardiovascular diseases: age matters!’, by Marouane Boukhris and Victor Aboyans, https://doi.org/10.1093/eurjpc/zwac150.
Introduction
Obesity, defined by body mass index (BMI), is a well-established risk factor for atherosclerotic cardiovascular disease,1,2 heart failure (HF),3,4 and mortality.5–7 On the other hand, underweight was also reported to be associated with increased mortality in the general population5–7 and in patients with established cardiovascular disease.8,9
The controversy regarding the association between BMI and cardiovascular disease or mortality may be dependent on age. Previous studies have shown that the association between obesity and mortality weakens with age, and being underweight is a strong risk factor for mortality in the elderly.10–12 The optimal bodyweight in terms of all-cause mortality differed according to sex and age.13 However, few studies have explored the effect of age on the association between BMI and cardiovascular events. One study reported that age attenuated the association between BMI and myocardial infarction (MI),14 whereas another study suggested that age did not modify the association of BMI with HF.15 Overall, these findings suggest that age is an intervening factor modifying the association between BMI and cardiovascular disease or mortality.
Thus, this study aimed to investigate whether age modifies the associations of BMI with incident cardiovascular disease, i.e. new-onset MI and HF, or all-cause mortality. We also investigated whether these associations were modified by sex, smoking status, physical activity level, or abdominal obesity.
Methods
Study population
The Korean National Health Insurance Service (NHIS) provides mandatory health insurance and health examinations for Korean citizens (see Supplementary material online, Methods). From the NHIS database, we initially identified 10 585 843 adults who underwent health examinations in 2009, of whom 9 278 433 were finally included in this study (see Supplementary material online, Figure S1). Individuals with a previous history of MI, ischaemic stroke, or HF or those with missing variables were excluded. Cardiovascular outcomes of the prospective cohort were assessed after a 1-year lag time, and individuals reaching the endpoint within this period were also excluded. This study conforms to the principles of the Declaration of Helsinki and was approved by the Institutional Review Board of Soongsil University (SSU-202007-HR-236-01). Written informed consent was waived due to the de-identified database and retrospective nature of the study. The data underlying this article are available from the NHIS database at https://nhiss.nhis.or.kr, to approved researchers.
Outcomes and covariates
The study endpoints were newly diagnosed MI, HF, and all-cause mortality. The index date was the date of the health examination. The cohort was followed up until the occurrence of the study endpoint or end of the study (31 December 2018). Detailed definitions of covariates and endpoints are presented in Supplementary material online, Table S1.16–19
Body mass index and age groups
Based on BMI measured at the time of index health examination, study subjects were categorized according to international classification cut-offs proposed by the World Health Organization, with the additional cut-off of 23 kg/m2 that was identified as the trigger point for increased risk in Asians.20–22 The BMI categories were as follows: <17 kg/m2 (severely underweight), 17–18.4 kg/m2 (mildly underweight), 18.5–22.9 kg/m2 (optimal normal weight), 23–24.9 kg/m2 (high normal weight), 25–29.9 kg/m2 (pre-obese), and ≥30 kg/m2 (obese). Overweight refers to BMI ≥25 kg/m2, including pre-obese and obese categories. The participants were categorized into young (20–39 years), middle-aged (40–64 years), and elderly (≥65 years) age groups or into decades for better visualization of age-related trends.
Statistical analysis
The Cox proportional hazards models were used to analyse the association of BMI with each primary outcome, presented as hazard ratios (HRs) and 95% confidence intervals (CIs), and the interaction terms between age and BMI. The normal-weight group was used as the reference for risk calculation; models were first adjusted for age and sex and then for smoking status, drinking status, physical activity level, and comorbidities, including hypertension, diabetes mellitus, dyslipidaemia, and chronic kidney disease (CKD). We also examined whether age-dependent associations between BMI and each outcome were modified by sex, smoking status, physical activity level, or abdominal obesity. Abdominal obesity was defined as waist circumference ≥90 cm for men and ≥85 cm for women;22 due to a very low incidence of abdominal obesity in underweight subjects, underweight subjects were excluded from the analysis related to abdominal obesity. Regarding the associations between underweight status and outcomes, a sensitivity analysis excluding the secondary causes of sarcopenia was performed. Details are available in the Supplementary material online, Methods.
Results
Baseline characteristics
The age distribution of the study population is presented in Supplementary material online, Figure S2. The mean age of the study population was 46.2 ± 13.6 years, and 55.0% were men. The proportions of underweight (BMI <18.5 kg/m2), normal weight (BMI 18.5–24.9 kg/m2), and overweight (BMI ≥25 kg/m2) were 6.9, 65.6, and 27.4% in young subjects; 1.7, 63.8, and 34.2% in middle-aged subjects; and 3.8, 62.0, and 34.2% in elderly subjects, respectively (Table 1). Obesity was more prevalent in men among young subjects and women among elderly subjects.
Baseline characteristics
| Young (age 20–39) | Middle age (age 40–64) | Elderly (age ≥65) | |||||||
|---|---|---|---|---|---|---|---|---|---|
| BMI group | <18.5 (n = 212 247) | 18.5–25 (n = 2 005 924) | ≥25 (n = 838 628) | <18.5 (n = 102 726) | 18.5–25 (n = 3 334 163) | ≥25 (n = 1 789 692) | <18.5 (n = 37 767) | 18.5–25 (n = 617 375) | ≥25 (n = 339 911) |
| Age, years | 28.7 ± 4.7 | 31.1 ± 4.9 | 32.5 ± 4.4 | 49.0 ± 7.2 | 49.9 ± 6.9 | 50.7 ± 7.0 | 73.3 ± 5.9 | 71.0 ± 4.9 | 70.2 ± 4.3 |
| Sex | |||||||||
| Male | 50 276 (23.7) | 1 199 129 (59.8) | 713 908 (85.1) | 43 781 (42.6) | 1 592 357 (47.8) | 1 035 210 (57.8) | 20 613 (54.6) | 314 048 (50.9) | 136 607 (40.2) |
| Female | 161 971 (76.3) | 806 795 (40.2) | 124 720 (14.9) | 58 945 (57.4) | 1 741 806 (52.2) | 754 482 (42.2) | 17 154 (45.4) | 303 327 (49.1) | 203 304 (59.8) |
| Current smoker | 41 307 (19.5) | 689 208 (34.4) | 412 550 (49.2) | 29 253 (28.5) | 754 868 (22.6) | 419 888 (23.5) | 9807 (26.0) | 96 900 (15.7) | 30 227 (8.9) |
| Heavy drinker | 7521 (3.5) | 161 948 (8.1) | 117 734 (14.0) | 6044 (5.9) | 232 279 (7.0) | 178 395 (10.0) | 2405 (6.4) | 34 985 (5.7) | 14 406 (4.2) |
| Regular exercise | 13 959 (6.6) | 260 003 (13.0) | 133 602 (15.9) | 13 916 (13.6) | 659 714 (19.8) | 371 752 (20.8) | 5277 (14.0) | 127 123 (20.6) | 70 427 (20.7) |
| Low income | 34 720 (16.4) | 275 886 (13.8) | 91 773 (10.9) | 19 613 (19.1) | 554 879 (16.6) | 284 117 (15.9) | 6333 (16.8) | 107 847 (17.5) | 57 931 (17.0) |
| Hypertension | 3231 (1.5) | 99 132 (4.9) | 144 130 (17.2) | 11 444 (11.1) | 680 433 (20.4) | 681 714 (38.1) | 13 189 (34.9) | 310 265 (50.3) | 225 815 (66.4) |
| Diabetes mellitus | 1457 (0.7) | 27 379 (1.4) | 35 488 (4.2) | 5135 (5.0) | 239 659 (7.2) | 236 129 (13.2) | 3762 (10.0) | 100 683 (16.3) | 77 214 (22.7) |
| Dyslipidaemia | 3852 (1.8) | 102 232 (5.1) | 123 917 (14.8) | 8650 (8.4) | 559 582 (16.8) | 479 061 (26.8) | 4484 (11.9) | 151 386 (24.5) | 116 393 (34.2) |
| Chronic kidney disease | 8404 (4.0) | 81 754 (4.1) | 30 833 (3.7) | 4782 (4.7) | 183 061 (5.5) | 113 510 (6.3) | 4712 (12.5) | 89 645 (14.5) | 62 494 (18.4) |
| End-stage renal disease | 57 (0.03) | 361 (0.02) | 104 (0.01) | 116 (0.11) | 1826 (0.05) | 620 (0.03) | 18 (0.05) | 384 (0.06) | 172 (0.05) |
| COPD | 4304 (2.0) | 36 073 (1.8) | 15 267 (1.8) | 3956 (3.9) | 106 771 (3.2) | 64 106 (3.6) | 4517 (12.0) | 48 071 (7.8) | 25 858 (7.6) |
| Cancer | 651 (0.31) | 4972 (0.25) | 1655 (0.20) | 2097 (2.0) | 48 555 (1.5) | 21 892 (1.2) | 1644 (4.4) | 19 285 (3.1) | 8689 (2.6) |
| Health examination results | |||||||||
| BMI, kg/m2 | 17.6 ± 0.7 | 21.8 ± 1.8 | 27.6 ± 2.5 | 17.6 ± 0.8 | 22.4 ± 1.6 | 27.2 ± 3.5 | 17.4 ± 1.0 | 22.4 ± 1.7 | 27.1 ± 2.0 |
| Waist circumference, cm | 64.8 ± 5.3 | 75.0 ± 7.6 | 88.5 ± 7.7 | 67.2 ± 5.7 | 77.2 ± 7.0 | 87.7 ± 7.3 | 69.8 ± 7.3 | 80.2 ± 7.1 | 89.4 ± 7.5 |
| Fasting glucose, mg/dL | 87 ± 12 | 90 ± 15 | 95 ± 21 | 95 ± 27 | 97 ± 24 | 103 ± 27 | 98 ± 26 | 102 ± 27 | 105 ± 27 |
| Systolic BP, mmHg | 110 ± 11 | 117 ± 12 | 125 ± 13 | 115 ± 15 | 121 ± 15 | 127 ± 15 | 124 ± 17 | 129 ± 16 | 132 ± 16 |
| Diastolic BP, mmHg | 70 ± 8 | 73 ± 9 | 79 ± 10 | 73 ± 10 | 76 ± 10 | 80 ± 10 | 76 ± 11 | 78 ± 10 | 80 ± 10 |
| Total cholesterol, mg/dL | 172 ± 32 | 182 ± 36 | 200 ± 40 | 186 ± 39 | 197 ± 41 | 205 ± 43 | 187 ± 41 | 198 ± 44 | 203 ± 44 |
| HDL-cholesterol, mg/dL | 65 ± 34 | 59 ± 30 | 51 ± 28 | 64 ± 37 | 58 ± 32 | 53 ± 31 | 61 ± 42 | 56 ± 40 | 54 ± 38 |
| LDL-cholesterol, mg/dL | 91 (96–108) | 101 (83–121) | 113 (93–136) | 103 (84–124) | 114 (93–136) | 119 (97–142) | 106 (85–128) | 115 (93–139) | 119 (95–143) |
| Triglycerides, mg/dL | 65 (50–87) | 87 (61–128) | 145 (98–217) | 79 (60–109) | 102 (79–149) | 139 (96–202) | 92 (69–124) | 114 (83–160) | 134 (97–186) |
| eGFR, mL/min/m2 | 97 ± 56 | 94 ± 58 | 92 ± 61 | 90 ± 36 | 87 ± 38 | 85 ± 39 | 84 ± 31 | 81 ± 33 | 78 ± 31 |
All P-values for comparison of BMI groups within each age strata were significant (<0.001).
BMI, body mass index; BP, blood pressure; COPD, chronic obstructive pulmonary disease; eGFR, estimated glomerular filtration rate by the Modification of Diet in Renal Disease (MDRD) formula.
The prevalence of metabolic disorders, including hypertension, diabetes mellitus, and dyslipidaemia, was the highest in the overweight group for all age strata. The prevalence of CKD was also the highest in the overweight groups for middle-aged and elderly subjects. The prevalence of chronic obstructive pulmonary disease and cancer was the highest in the underweight group for all age strata, and that of end-stage renal disease was the highest in the underweight group of young and middle-aged subjects. Although the prevalence of current smoking and heavy drinking was higher in young subjects with higher BMI, it was higher in elderly subjects with lower BMI. The proportion of regular exercisers increased in proportion to BMI in all age strata.
Association of body mass index with cardiovascular outcomes and all-cause mortality
During a median 8.3 (interquartile range 8.1–8.6) years of follow-up, 306 065 (3.30%) deaths occurred. Myocardial infarction and HF occurred in 65 607 (0.71%) and 131 903 (1.42%) subjects, respectively. In the total population, a U-shaped association was generally noted between BMI and outcomes (Figure 1A and see Supplementary material online, Table S2). Regarding MI, the optimal normal-weight and mildly underweight subjects had the lowest risk, whereas severely underweight subjects had elevated risk; obese subjects had the highest risk for MI (HR 1.45, 95% CI 1.39–1.51). Regarding HF, normal-weight subjects, i.e. optimal normal and high normal-weight subjects, had the lowest risk, whereas both underweight and overweight subjects had increased risk. Severely underweight subjects had the highest risk for HF (HR 1.72, 95% CI 1.63–1.82).
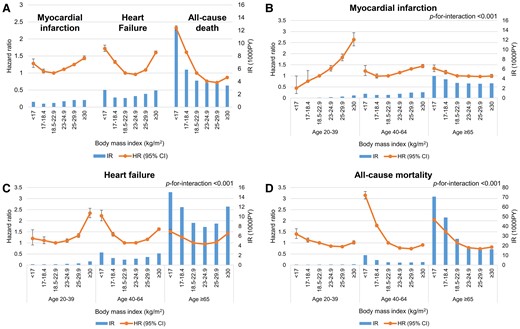
Associations of body mass index with myocardial infarction, heart failure, and all-cause death. Associations of body mass index with myocardial infarction, heart failure, and all-cause death are shown (A) in the total population and (B–D) according to age groups. For each body mass index group, incidence rates per 1000 person-years are shown in bar charts mapped to the right y-axis, and hazard ratios and 95% confidence intervals with the optimal normal-weight (18.5–22.9 kg/m2) group as reference are shown in line graphs mapped to the left y-axis. Adjusted for age, sex, smoking status, drinking status, physical activity level, hypertension, diabetes mellitus, dyslipidaemia, and chronic kidney disease.
Generally, there was an inversely proportional association between BMI and all-cause mortality, indicated by a reverse J-shaped curve. The crude mortality rate decreased in inverse proportion to BMI, and after multivariable adjustment, the nadir of risk was observed in pre-obese subjects (HR 0.73, 95% CI 0.72–0.73). High normal-weight and overweight subjects (BMI ≥23 kg/m2) had significantly lower risk of all-cause mortality than optimal normal-weight subjects, whereas underweight subjects had augmented risk.
Age-dependent association of body mass index with cardiovascular outcomes and all-cause mortality
Different patterns emerged in the association between BMI and cardiovascular outcomes when stratified by age (Figure 1B–D and Table 2). The number of events and other Cox models are presented in Supplementary material online, Table S3. Interaction terms between age groups and BMI were significant for all outcomes.
Associations of body mass index with myocardial infarction, heart failure, and all-cause death according to age group
| Myocardial infarction | Heart failure | All-cause death | ||||||
|---|---|---|---|---|---|---|---|---|
| BMI (kg/m2) | N | IR | Adjusted modela | IR | Adjusted modela | IR | Adjusted modela | |
| Age 20–39 | <17 | 64 138 | 0.019 | 0.44 (0.20–0.99) | 0.160 | 1.20 (0.91–1.59) | 0.505 | 1.40 (1.19–1.64) |
| 17–18.4 | 288 602 | 0.048 | 0.97 (0.76–1.24) | 0.155 | 1.11 (0.96–1.27) | 0.436 | 1.13 (1.04–1.22) | |
| 18.5–22.9 | 3 681 356 | 0.082 | 1 (ref) | 0.171 | 1 (ref) | 0.512 | 1 (ref) | |
| 23–24.9 | 2 276 106 | 0.17 | 1.34 (1.22–1.47) | 0.235 | 1.10 (1.02–1.18) | 0.566 | 0.85 (0.82–0.89) | |
| 25-29.9 | 2 648 044 | 0.31 | 1.83 (1.68–1.99) | 0.340 | 1.33 (1.25–1.42) | 0.626 | 0.83 (0.79–0.87) | |
| ≥30 | 320 187 | 0.53 | 2.64 (2.35–2.95) | 0.740 | 2.34 (2.14–2.56) | 0.831 | 1.02 (0.94–1.10) | |
| Age 40–64 | <17 | 64 138 | 0.86 | 1.22 (1.01–1.47) | 2.59 | 2.22 (1.99–2.48) | 10.2 | 3.15 (2.98–3.32) |
| 17–18.4 | 288 602 | 0.63 | 0.99 (0.90–1.09) | 1.44 | 1.39 (1.30–1.48) | 5.10 | 1.78 (1.72–1.85) | |
| 18.5–22.9 | 3 681 356 | 0.64 | 1 (ref) | 1.09 | 1 (ref) | 2.83 | 1 (ref) | |
| 23–24.9 | 2 276 106 | 0.88 | 1.15 (1.12–1.18) | 1.29 | 1.01 (0.98–1.03) | 2.55 | 0.77 (0.76–0.78) | |
| 25–29.9 | 2 648 044 | 1.12 | 1.32 (1.28–1.35) | 1.65 | 1.16 (1.13–1.18) | 2.64 | 0.74 (0.73–0.75) | |
| ≥30 | 320 187 | 1.20 | 1.44 (1.36–1.52) | 2.39 | 1.62 (1.56–1.68) | 3.03 | 0.91 (0.80–0.94) | |
| Age ≥65 | <17 | 64 138 | 4.54 | 1.33 (1.19–1.50) | 15.0 | 1.51 (1.42–1.61) | 70.5 | 2.05 (1.99–2.11) |
| 17–18.4 | 288 602 | 3.87 | 1.16 (1.08–1.25) | 11.9 | 1.26 (1.21–1.32) | 49.0 | 1.51 (1.48–1.54) | |
| 18.5–22.9 | 3 681 356 | 3.11 | 1 (ref) | 8.68 | 1 (ref) | 27.0 | 1 (ref) | |
| 23–24.9 | 2 276 106 | 3.01 | 0.99 (0.96–1.02) | 7.85 | 0.94 (0.92–0.96) | 18.7 | 0.78 (0.77–0.79) | |
| 25–29.9 | 2 648 044 | 2.95 | 0.97 (0.94–1.01) | 8.54 | 1.03 (1.01–1.05) | 16.4 | 0.73 (0.72–0.74) | |
| ≥30 | 320 187 | 3.04 | 0.99 (0.92–1.07) | 12.1 | 1.43 (1.37–1.49) | 16.3 | 0.81 (0.78–0.84) | |
Adjusted for age, sex, smoking status, drinking status, physical activity level, hypertension, diabetes mellitus, dyslipidaemia, and chronic kidney disease.
Body mass index and incident MI showed a directly proportional relationship in young subjects (Figure 1B). Thus, the higher the BMI, the higher the risk of MI, with severely underweight subjects showing the lowest risk (HR 0.44, 95% CI 0.20–0.99) and obese subjects showing the highest risk (HR 2.64, 95% CI 2.35–2.95). In middle-aged subjects, the nadir of risk for MI was noted in the mildly underweight or optimal normal-weight group, with an increased risk in both the severely underweight and overweight groups. In elderly subjects, MI risk was not increased in overweight subjects compared with normal-weight subjects, but was increased in underweight subjects (highest in severely underweight subjects; HR 1.33, 95% CI 1.19–1.50).
The risk for HF increased in high normal weight and overweight (BMI ≥23 kg/m2) but not in underweight young subjects (Figure 1C). In middle-aged and elderly subjects, a U-shaped relationship was noted, with the highest risk in the severely underweight group (HR 2.22, 95% CI 1.99–2.48; HR 1.52, 95% CI 1.42–1.61, respectively). The nadir of risk for HF was noted in the normal-weight groups among middle-aged subjects and in the high normal-weight group among elderly subjects.
There was a reverse J-shaped relationship between BMI and all-cause mortality for all age groups (Figure 1D); the severely underweight group had the worst survival. The association between underweight and all-cause mortality was weakest in young subjects. High normal-weight and overweight BMI ranges (BMI ≥23 kg/m2) were associated with improved survival, especially in subjects aged ≥40 years; the nadir of mortality risk was noted in the high normal-weight or pre-obese subjects (BMI 23–29.9 kg/m2) for all age strata.
Further stratification of age by decades showed age-related associations between BMI and outcomes more clearly (Figure 2, see Supplementary material online, Table S4). Being overweight was associated with increased risk of MI in subjects aged <70 years and HF in all ages, but was not associated with all-cause mortality (except for increased risk with obese subjects aged 20–29 years).In elderly subjects, being overweight was not associated with an increased risk of MI. Instead, underweight status was associated with increased risk of MI in elderly subjects aged ≥70 years, HF in middle-aged or older subjects aged ≥40 years, and also all-cause mortality in all ages, except the 20s. The impact of increased BMI on cardiac outcomes was greater among younger and middle-aged subjects, indicated by a flattening of the curves in the elderly.
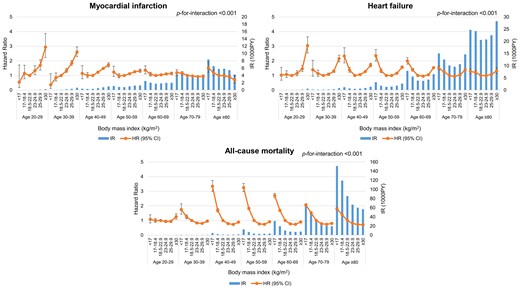
Associations of body mass index with myocardial infarction, heart failure, and all-cause death according to age decades. For each body mass index group, incidence rates per 1000 person-years are shown in bar charts mapped to the right y-axis, and hazard ratios and 95% confidence intervals with the optimal normal-weight (18.5–22.9 kg/m2) group as reference are shown in line graphs mapped to the left y-axis. Adjusted for age, sex, smoking status, drinking status, physical activity level, hypertension, diabetes mellitus, dyslipidaemia, and chronic kidney disease.
Subgroup analyses
We further analysed whether age-dependent associations of BMI with each outcome were modified by sex (Figure 3), smoking status (see Supplementary material online, Figure S3), physical activity level (see Supplementary material online, Figure S4), and abdominal obesity (see Supplementary material online, Figure S5). Overall, age-dependent associations of BMI and outcomes showed a similar trend regardless of sex, smoking status, physical activity level, and abdominal obesity, although there were minor differences indicated by significant P-values for interaction.
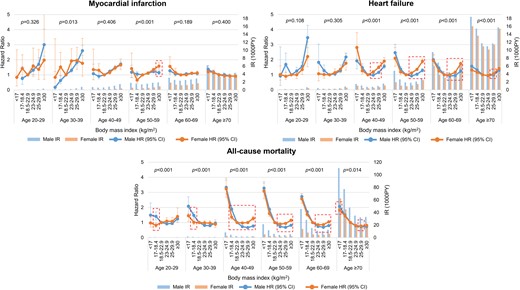
Age-dependent associations of body mass index with myocardial infarction, heart failure, and all-cause death: stratified by sex. For each body mass index group, incidence rates per 1000 person-years are shown in bar charts mapped to the right y-axis, and hazard ratios and 95% confidence intervals with the optimal normal-weight (18.5–22.9 kg/m2) group as reference are shown in line graphs mapped to the left y-axis. P-for-interaction values in each age group are shown. Significantly different hazard ratios and 95% confidence intervals are indicated by dotted boxes. Adjusted for age, smoking status, drinking status, physical activity level, hypertension, diabetes mellitus, dyslipidaemia, and chronic kidney disease.
Men had higher cardiovascular event rates and all-cause mortality rates than women of all ages (Figure 3, see Supplementary material online, Table S5). A stronger association between pre-obesity/obesity and HF was observed in middle-aged women than in men. Meanwhile, the protective effect of high normal-weight and overweight status (BMI ≥23 kg/m2) on all-cause mortality was stronger in middle-aged men than in women. The association between underweight status and mortality was not significant in young women but significant in young men.
Current smoking status was related to higher cardiovascular events and all-cause mortality rates for all ages (see Supplementary material online, Figure S3 and Table S6). Stronger associations between pre-obesity/obesity and HF were noted in non-smokers than in current smokers in the middle-aged group. The protective effect of increased BMI (BMI ≥23 kg/m2) on all-cause mortality was stronger in current smokers than in non-smokers, whereas the association between severe underweight status and mortality was stronger in middle-aged and elderly non-smokers than in current smokers. The stronger effects of BMI in non-smokers than in current smokers were likely related to high event rates in the reference BMI group for current smokers. Importantly, underweight status was associated with an increased risk of MI, HF, and death in elderly non-smokers as well as current smokers, demonstrating that smoking does not explain the excess mortality risk seen in underweight elderly subjects.
Engaging in regular exercise was related to lower cardiovascular events and all-cause mortality rates in elderly subjects aged ≥70 years (see Supplementary material online, Figure S4 and Table S7). Generally, regular exercise did not significantly modify the associations between BMI and cardiovascular outcomes.
Abdominal obesity was related to higher cardiovascular events and all-cause mortality rates for all ages, except for obese subjects aged ≥70 years (see Supplementary material online, Figure S5 and Table S8). Stronger associations between higher BMI and increased risk of MI were observed in subjects without abdominal obesity compared with those with abdominal obesity in the middle-aged group. There was a trend for stronger protective effects of obesity on all-cause mortality in subjects with abdominal obesity in the middle-aged and elderly groups, though the difference was minimal.
Sensitivity analysis
Sensitivity analysis excluding secondary causes of sarcopenia, specifically cancer, chronic obstructive pulmonary disease, end-stage renal disease, liver cirrhosis, rheumatic diseases, inflammatory bowel diseases, tuberculosis, and thyroid diseases was performed to examine cardiovascular and mortality risk associated with underweight status (see Supplementary material online, Figure S6 and Table S9). Although there was a small reduction in mortality risk associated with being underweight, age-related trends remained generally consistent.
Discussion
This nationwide population-based cohort study of more than 9 million individuals without prior cardiovascular disease revealed age-dependent patterns of cardiovascular outcomes and all-cause mortality with respect to BMI (Graphical Abstract). In young subjects, being overweight was an important cardiovascular risk factor associated with a higher risk of MI and HF. With advancing age, the association between obesity and cardiovascular outcomes was attenuated and that between underweight status and cardiovascular outcomes became more prominent. Meanwhile, underweight status was strongly associated with increased all-cause mortality, whereas pre-obesity provided the greatest survival benefit across most ages. The association between underweight and increased mortality was weaker in young subjects.
Impact of age on the association between cardiovascular risk and body mass index
Obesity or overweight, defined by BMI, is associated with increased cardiovascular risk including coronary heart disease, stroke, and HF.1–4 Underweight, defined by BMI, was also shown to be associated with increased risks for coronary heart disease, stroke, and atrial fibrillation in the general population.16,23–25
In our study, being overweight was independently associated with increased cardiovascular risk; however, this effect was significantly modified by age. Increased BMI in the overweight and even high normal range was associated with increased risk of MI in young and middle-aged subjects, but not in elderly subjects. While being overweight was associated with increased risk of HF in all ages, BMI in the high normal range was associated with increased HF risk in young subjects and decreased HF risk in elderly subjects. Meanwhile, being underweight emerged as an independent risk factor for MI in elderly subjects and HF from middle age onwards. Our results suggest that the negative cardiovascular impact of obesity is stronger at the younger age, while the negative impact of underweight is stronger in the elderly. This is in line with a study from the UK Biobank (n = 5081), which found that high BMI was associated with increased risk for MI, but that this association weakened with older age.14 Conversely, a pooled population-based cohort study (n = 24 675) reported that age did not modify the effect of high BMI on HF;15 however, this study used a single dichotomized variable of obesity (BMI ≥30 kg/m2 as obese). Both studies included a significantly smaller cohort than our study.
Impact of age on the association between all-cause mortality and body mass index
Both obesity and underweight status are important risk factors for all-cause death,5–7 and these patterns are similar regardless of the geographical region.7 Furthermore, the association between high BMI and all-cause death seems to be attenuated with increasing age.5–7,10–12 In a previous study of 1.2 million healthy Koreans, a J-shaped association between BMI and all-cause mortality was noted regardless of sex and smoking, with the lowest risk at high normal-weight range (BMI 23.0–24.9 kg/m2), and age attenuated the association of high BMI with all-cause death; in subjects aged ≥65 years, being overweight (BMI ≥25 kg/m2) was not associated with increased mortality risk.5 A study including 324 135 White never-smokers without previous cardiovascular disease or cancer showed that high BMI was associated with increased mortality in the younger generations and low BMI was associated with increased mortality in the very elderly (≥85 years) after adjusting for age, drinking, physical activity, and educational level.10 Other studies also suggested that the association between obesity and all-cause death was stronger in the young than in the elderly.6,7,11,12
We here found that underweight was an important risk factor for all-cause mortality, though notably, the association between underweight status and all-cause mortality was the weakest in the young group. Among participants in the 20s, obesity (BMI ≥30 kg/m2) was associated with increased mortality; however, in all other age strata, being overweight was not associated with the increased risk for mortality. Being underweight was an independent risk for all-cause death from age ≥30 years, with the lowest mortality observed in pre-obese subjects (BMI 25–29.9 kg/m2). Notably, the association between underweight status and all-cause mortality was the weakest in the young group. The lack of significant association between obesity and all-cause mortality may be because our study performed more extensive multivariable adjustments for confounding factors, compared with the previously mentioned studies.5–7 In the unadjusted model, pre-obesity and obesity were associated with all-cause mortality in young and middle-aged participants; however, statistical significance was lost after adjusting for age, sex, smoking, exercise, physical activity, and multiple comorbidities.
Possible explanations for age-dependent association of body mass index with cardiovascular disease and all-cause mortality
The weakening of the association between high BMI and cardiovascular or all-cause mortality risk in the elderly may reflect the increasing role of other risk factors with age. Ageing is associated with an increased prevalence of insulin resistance, hypertension, dyslipidaemia, and inflammation.26 Alternatively, increased BMI is typically associated with not only increased fat mass but also increased muscle mass and may per se play a greater protective role in the elderly who have progressively decreased lean mass and bone mass.27,28 In addition, obese elderly subjects may have more metabolic reserve to counteract various pathological catabolic states arising in the ageing process. A protective effect of increased BMI or the ‘obesity paradox’ has been observed in patients with underlying cardiovascular disease.8,9,29 Meanwhile, there might also be a ‘healthy survivor effect’,30 with earlier disease onset observed in subjects more vulnerable to cardiovascular disease and remaining survivors becoming less susceptible to the adverse effects of high BMI.
Strengths and limitations
Data focusing on the impact of age on the association between BMI and cardiovascular risk are limited, and our study was the first to examine this issue in detail in a large population-based cohort which comprised the general unselected Korean population undergoing standardized health examinations, thus strengthening the homogeneity and credibility of our results.
Several limitations should be considered. First, BMI does not directly assess body composition or fat distribution. However, it has been proven to be a sound predictor of cardiovascular risk. Furthermore, other measures of adiposity such as body fat percentage or waist circumference are not superior to BMI for predicting cardiovascular events.1,4,31 Second, the results of this study may not be generalizable to all ethnicities. East Asians have increased cardiovascular risk at lower BMI cut-offs than Westerners and have higher abdominal and body fat percentages at the same BMI.32 Likewise, the impact of age on cardiovascular risk associated with BMI may differ according to ethnicity. Finally, our study did not directly determine whether changes in BMI to achieve the optimal range would decrease cardiovascular risk; further prospective studies are required to address this issue.
Conclusions
Age-dependent risks for MI, HF, and all-cause mortality were noted with respect to BMI. Increased BMI was associated with higher cardiovascular risk in young subjects, whereas underweight status emerged as a cardiovascular risk factor in middle-aged and elderly subjects. Being underweight was also an important risk for all-cause death, though this association was attenuated in the young. Given our findings, weight control recommendations should differ by age. Clinicians should recommend weight loss more strongly to younger overweight subjects, while carefully monitoring elderly underweight subjects for adverse cardiovascular outcomes.
Authors’ contributions
H.-J.L., K.-D.H., and H.-K.K. contributed to the conception or design of the work. K.-D.H., K.-n.L., J.-B.P., H.L., S.-P.L., and Y.-J.K. contributed to the acquisition, analysis, or interpretation of data for the work. H.-J.L. and H.-K.K. drafted the manuscript. K.-D.H., J.-B.P., H.L., S.-P.L., and Y.-J.K. critically revised the manuscript. All gave final approval and agree to be accountable for all aspects of work ensuring integrity and accuracy.
Supplementary material
Supplementary material is available at European Journal of Preventive Cardiology.
Funding
None.
Data Availability
The data underlying this article are available from the NHIS database at https://nhiss.nhis.or.kr, to approved researchers.
References
Author notes
Hyung Kwan Kim and Kyung Do Han have equal contribution to this work as corresponding authors.
Conflict of interest: H.-K.K. received research grants from Actelion, Handok, GSK, Dae-Woong, Hanmi, Ildong, JW pharmaceutical, Samjin, and Norvatis. The remaining authors declare no conflict of interest.

Comments