


Abstract
Cardiovascular disease (CVD) risk management guided by predicted CVD risk is widely recommended internationally. This is the first study to examine CVD preventive pharmacotherapy in a whole-of-country primary prevention population, stratified by CVD risk.
Anonymized individual-level linkage of New Zealand administrative health and non-health data identified 2 250 201 individuals without atherosclerotic CVD, alive, and aged 30–74 years on 31 March 2013. We identified individuals with ≥1 dispensing by community pharmacies of blood pressure lowering (BPL) and/or lipid-lowering (LL) medications at baseline (1 October 2012–31 March 2013) and in 6-month periods between 1 April 2013 and 31 March 2016. Individuals were stratified using 5-year CVD risk equations specifically developed for application in administrative datasets. One-quarter of individuals had ≥5% 5-year risk (the current New Zealand guideline threshold for discussing preventive medications) and 5% met the ≥15% risk threshold for recommended dual therapy. By study end, dual therapy was dispensed to 2%, 18%, 34%, and 49% of individuals with <5%, 5–9%, 10–14%, and ≥15% 5-year risk, respectively. Among those dispensed baseline dual therapy, 83–89% across risk strata were still treated after 3 years. Dual therapy initiation during follow-up occurred among only 13% of high-risk individuals untreated at baseline. People without diabetes and those aged ≥65 years were more likely to remain untreated.
Cardiovascular disease primary preventive pharmacotherapy was strongly associated with predicted CVD risk and, once commenced, was generally continued. However, only half of high-risk individuals received recommended dual therapy and treatment initiation was modest. Individually linked administrative datasets can identify clinically relevant quality improvement opportunities for entire populations.
Introduction
Targeting preventive pharmacotherapy for cardiovascular disease (CVD) to individuals with elevated multivariable risk can avert more CVD events1 and is more cost-effective2 than treating isolated risk factors. Therefore, guidelines in Aotearoa/New Zealand,3 Europe,4,5 and many other regions now recommend that risk management decisions for CVD should be based on predicted absolute CVD risk. In New Zealand, ≥5% 5-year CVD risk is the current national risk threshold for discussing preventive blood pressure lowering (BPL) and lipid-lowering (LL) medications, as part of shared clinician/patient decision-making. Dual therapy with both agents is strongly recommended for those with ≥15% risk, which is considered an equivalent future CVD event risk to those with a history of CVD.3
Until recently, available risk scores required clinical consultation-dependent measures, such as smoking status, blood pressure, or lipid levels to estimate CVD risk. This requirement precluded risk assessment at the individual level across whole populations as these data are not routinely collected in a central or networked national data repository. Accordingly, the CVD risk distribution of entire countries has only been approximated to date through population modelling6 or extrapolation from samples7 rather than accurately examined in complete national cohorts. Investigating patterns of CVD preventive pharmacotherapy among individuals at different levels of CVD risk can alert health professionals and policymakers to under- and over-treatment across the population and in subgroups. Such analyses can, therefore, inform both clinical strategies for improving risk management and population-level planning decisions to facilitate treatment targeting to those in greatest need.
We recently developed population-based risk tools, hereafter referred to as the Vascular Risk in Adult New Zealanders (VARIANZ) equations, that can estimate the 5-year risk of a CVD event for all New Zealand adults without prior atherosclerotic CVD using variables available in national routinely collected health data.8 A complete national cohort can now also be identified through the Statistics New Zealand Integrated Data Infrastructure (IDI).9 The IDI enables a wide range of anonymized New Zealand health and non-health administrative and survey data to be linked at an individual level, including dispensing data for all commonly prescribed CVD preventive medications. The aim of this study was, therefore, to examine the use of blood pressure lowering (BPL) and lipid-lowering (LL) medications according to predicted 5-year CVD risk across the Aotearoa/New Zealand adult primary prevention population.
Methods
Study design and population
A cohort study was conducted using anonymized individual-level routinely collected IDI data. The IDI encompasses more than 9 million unique current and past New Zealand residents. An activity-based approach was used to identify the study population,10 who met criteria 1 and/or 2 below and both criteria 3 and 4 on 31 March 2013. Participants eligible for inclusion were:
within the IDI spine with recorded activity in tax, education, or injury claims between 1 April 2012 and 31 March 2013; or
within ≥1 of the following health datasets between 1 April 2012 and 31 March 2013: primary care enrolment, community laboratory test claims, national outpatients, pharmaceutical dispensing, and publicly funded hospitalizations; and
Present in New Zealand for ≥6 months between 1 April 2012 and 31 March 2013; and
Aged 30–74 years on 31 March 2013 (since this is the recommended risk assessment age range in New Zealand and the age range of the development cohorts for the sex-specific VARIANZ equations).
Individuals were excluded if they: (i) died between 1 April 2012 and 31 March 2013; or (ii) were hospitalized for CVD (including coronary heart disease, stroke, transient ischaemic attacks, peripheral vascular disease, and coronary-related procedures) or heart failure on or before 31 March 2013; or (iii) were dispensed anti-anginals ≥3 times between 1 April 2008 and 31 March 2013; or (iv) were dispensed loop diuretics ≥3 times between 1 April 2008 and 31 March 2013 (as this is an indicator of non-hospitalized heart failure); or (v) data used to determine predicted 5-year CVD risk were missing (further details regarding exclusion criteria are provided in Supplementary material online, Appendix S1).
Cardiovascular disease risk score and risk strata
Each individual’s 5-year risk of hospitalization or death from CVD was estimated on 31 March 2013 using sex-specific VARIANZ equations8 with the following predictor variables: age, ethnicity, deprivation quintile based on NZDep2013 (an area-based socioeconomic measure), diabetes status, prior hospitalization for atrial fibrillation and baseline dispensing of cardiovascular medications (defined as ≥1 dispensing recorded in the 6-month period before 31 March 2013). Medication dispensing was identified for this study from the Pharmaceutical Collection that contains nationwide records of government-subsidized pharmacotherapy dispensed by community pharmacies, including all medications relevant to these analyses. More information about data sources and categorizations for each predictor is included in Supplementary material online, Appendices S2 and S3. The study population was stratified into four 5-year risk groups (<5% risk, 5–9% risk, 10–14% risk, and ≥15% risk). Ten-year risk is approximately double 5-year risk (e.g. ≥15% 5-year risk is about equivalent to ≥30% 10-year risk). Individuals remained assigned to their risk group for the duration of follow-up, even if baseline parameters changed during follow-up.
Outcome measures
The primary outcome measure was ≥1 dispensing in each 6-month period between 1 April 2013 and 31 March 2016 of BPL medications alone, LL medications alone, and both BPL and LL medications (i.e. dual therapy). All classes of BPL and LL medications were considered (these are listed in Supplementary material online, Appendix S2). Although CVD medications are usually prescribed in New Zealand for 3-month intervals, dispensing was considered for 6-month periods to allow for late prescription filling. Dispensing of antiplatelet medications was not considered as an outcome given the uncertain net benefit for many individuals without prior CVD.11,12
Two secondary outcomes were examined according to clinical and demographic baseline characteristics within CVD risk strata: (i) the adjusted relative risk (RR) with 95% confidence interval (CI) of no medication dispensing in any follow-up period if untreated at baseline with (a) BPL, (b) LL, and (c) dual therapy (i.e. remaining untreated); and (ii) adjusted RR with 95% CI of ≥1 medication dispensing episode in all follow-up periods if treated at baseline in each of the three medication categories (i.e. sustained maintenance of baseline treatment).
Statistical analyses
All analyses were undertaken using STATA 14.1.13 Cross-sectional estimates of the proportion of people dispensed medications in each CVD risk stratum at baseline and in consecutive 6-month follow-up periods were examined for: (i) the total study population; (ii) those untreated at baseline with (a) BPL, (b) LL, or (c) dual therapy (i.e. initiation of treatment during follow-up); and (iii) those treated at baseline in each of the three medication categories (i.e. continuation of baseline treatment). The ‘untreated’ or ‘treated’ baseline status referred only to the considered medication category. For example, those untreated at baseline with BPL medications may have been dispensed LL medications. A 6-month follow-up period was considered incomplete if an individual: (i) died during the period; or (ii) was hospitalized for CVD or heart failure during that period; or (iii) was not in the country for at least half of the period. For individuals who died or had a CVD-related hospitalization between 1 April 2013 and 31 March 2016, follow-up was censored at the end of the last complete 6-month period. Individuals were counted in the denominator for complete 6-month periods but not other periods where (i), (ii), or (iii) applied or after follow-up was censored, and were included in the numerator as having been dispensing medications for all complete periods where dispensing of the medication category in question was recorded. Sensitivity analyses for the total study population examined cross-sectional baseline and follow-up dispensing stratified by risk for: (i) statins alone (rather than all LL medications) and (ii) both BPL and statins.
Among the subset of the study population with ≥3 complete 6-month follow-up periods between 1 April 2013 and 31 March 2016, two sets of log-binomial regression models (i.e. binomial generalized linear model with a log link function) examined the secondary outcomes listed above according to selected clinical and demographic baseline characteristics. These were age group, sex, deprivation quintile based on NZDep2013, ethnic group, diabetes, atrial fibrillation, rural/urban location, and modified Charlson Comorbidity Index. Each RR was adjusted for all other baseline characteristics to account for potential confounding. As with the main analysis, baseline ‘untreated’ or ‘treated’ status referred only to the considered medication category (BPL, LL, or both). Individuals with ≥3 complete follow-up periods before having a CVD event were included in analyses. Further information, including data sources and variable categories, is available in Supplementary material online, Appendices S3 and S4.
Ethics
This study is part of the VIEW research programme approved by the Northern Region Ethics Committee Y in 2003 (AKY/03/12/314), with subsequent annual re-approval by the national Multi-Region Ethics Committee since 2007 (MEC/01/19/EXP). Individual patient consent was not required as all data are anonymized.
Results
On 31 March 2013, 2 446 701 individuals aged 30–74 years were, in the prior year, active in a relevant national database and in New Zealand for at least 6 months. Following exclusion of those with recorded deaths between 1 April 2012 and 31 March 2013 (n = 13 905; 0.6%), prior CVD or heart failure hospitalizations (n = 128 499; 5.3%), prior anti-anginal dispensing (n = 5730; 0.2%), loop diuretic use (n = 18 366; 0.8%), or missing CVD risk predictor data (n = 30 003; 1.2%), 2 250 201 people remained (Supplementary material online, Appendix S5, Figure S1).
Participant characteristics
Table 1 summarizes the participant characteristics. Individuals who met the national risk threshold for discussing preventive medications (≥5% 5-year risk) comprised 25% of the study population and 5% met the threshold for strongly recommended dual therapy (≥15% risk) and were considered to be high risk (Supplementary material online, Appendix S5 Figure S2 shows the distribution of CVD risk across the study population). With increasing risk, higher proportions were generally observed for: men; 65–74 years old; individuals residing in the two most deprived quintiles; and a history of diabetes or atrial fibrillation. Age- and sex-specific analyses of the proportion of individuals with ≥15% risk by ethnic group (Supplementary material online, Appendix S5 Figure S3) found markedly higher proportions for Māori (New Zealand’s Indigenous peoples), Pacific peoples, Indian men and, to a lesser extent, Indian women. Supplementary material online, Appendix S5 Table S1 presents additional participant characteristics.
Participant characteristics
| Characteristics | Whole cohort, n (%) | 5-year CVD risk strataa | ||||
|---|---|---|---|---|---|---|
| <5%, n (%) | 5–9%, n (%) | 10–14%, n (%) | ≥15%, n (%) | |||
| Total (row %) | 2 250 201 (100%) | 1 682 406 (74.7%) | 327 696 (14.6%) | 135 714 (6.0%) | 104 382 (4.6%) | |
| Sex | Male | 1 071 771 (47.6%) | 716 012 (42.6%) | 183 147 (55.9%) | 90 792 (66.9%) | 81 822 (78.4%) |
| Female | 1 178 424 (52.4%) | 966 394 (57.4%) | 144 549 (44.1%) | 44 922 (33.1%) | 22 560 (21.6%) | |
| Age | <35 years | 277 722 (12.3%) | 277 101 (16.5%) | 603 (0.2%) | 1698 (1.3%) | S |
| 35–44 years | 600 876 (26.7%) | 592 125 (35.2%) | 7464 (2.3%) | 1248 (0.9%) | 42 (0%) | |
| 45–54 years | 616 788 (27.4%) | 547 890 (32.6%) | 55 386 (16.9%) | 10 794 (8.0%) | 2718 (2.6%) | |
| 55–64 years | 464 733 (20.7%) | 234 915 (14.0%) | 163 566 (49.9%) | 45 621 (33.6%) | 20 634 (19.8%) | |
| 65–74 years | 290 082 (12.9%) | 30 375 (1.8%) | 100 683 (30.7%) | 78 036 (57.5%) | 80 988 (77.6%) | |
| Ethnicity | Māori | 269 043 (12.0%) | 182 835 (10.9%) | 42 366 (12.9%) | 18 765 (13.8%) | 25 077 (24.0%) |
| Pacific | 119 607 (5.3%) | 85 215 (5.1%) | 16 134 (4.9%) | 8934 (6.6%) | 9324 (8.9%) | |
| Indian | 78 132 (3.5%) | 60 078 (3.6%) | 9540 (2.9%) | 4689 (3.5%) | 3825 (3.7%) | |
| Other | 242 439 (10.8%) | 228 138 (13.6%) | 13 491 (4.1%) | 792 (0.6%) | 15 (0%) | |
| European | 1 540 980 (68.5%) | 1 126 140 (66.9%) | 246 165 (75.1%) | 102 534 (75.6%) | 66 141 (63.4%) | |
| Deprivation quintile | 1 (least deprived) | 508 056 (22.6%) | 405 507 (24.1%) | 68 397 (20.9%) | 24 045 (17.7%) | 10 101 (9.7%) |
| 2 | 479 508 (21.3%) | 372 594 (22.2%) | 67 116 (20.5%) | 25 530 (18.8%) | 14 268 (13.7%) | |
| 3 | 448 911 (20.0%) | 337 974 (20.1%) | 64 923 (19.8%) | 25 983 (19.2%) | 20 031 (19.2%) | |
| 4 | 420 903 (18.7%) | 301 905 (17.9%) | 64 809 (19.8%) | 28 470 (21.0%) | 25 719 (24.6%) | |
| 5 (most deprived) | 392 823 (17.5%) | 264 423 (15.7%) | 62 451 (19.1%) | 31 683 (23.4%) | 34 266 (32.8%) | |
| Diabetes | 116 940 (5.2%) | 22 476 (1.3%) | 32 355 (9.9%) | 28 113 (20.7%) | 33 996 (32.6%) | |
| Atrial fibrillation | 17 991 (0.8%) | 2046 (0.1%) | 3162 (1.0%) | 3396 (2.5%) | 9387 (9.0%) | |
| Baseline cardiovascular medications | BPL | 357 750 (15.9%) | 91 632 (5.5%) | 117 180 (35.8%) | 75 831 (55.9%) | 73 107 (70.0%) |
| LL | 244 980 (10.9%) | 62 202 (3.7%) | 72 744 (22.2%) | 52 902 (39.0%) | 57 132 (54.7%) | |
| BPL and LL | 158 136 (7.0%) | 19 266 (1.2%) | 47 757 (14.6%) | 41 922 (30.9%) | 49 194 (47.1%) | |
| Antiplatelets | 129 057 (5.7%) | 15 948 (0.9%) | 30 414 (9.3%) | 34 194 (25.2%) | 48 498 (46.5%) | |
| Anticoagulants | 13 011 (0.6%) | 2928 (0.2%) | 2517 (0.8%) | 2430 (1.8%) | 5136 (4.9%) | |
Column percentages are presented except for the total. All counts were randomly rounded to base three using the rules defined by Statistics New Zealand, and proportions are based on the rounded counts.
BPL, blood pressure lowering medications; LL, lipid lowering medications; S, suppressed counts based on ≤6 people. aTen-year risk is approximately double 5-year risk (e.g. ≥15% 5-year risk is about equivalent to ≥30% 10-year risk).
Medication dispensing by cardiovascular disease risk
Cross-sectional estimates at 6-month intervals of the proportion of the total study population dispensed BPL, LL, or dual therapy in each CVD risk stratum indicated that dispensing in each medication category was strongly associated with CVD risk and changed little during 3 years of follow-up (Supplementary material online, Appendix S5 Figure S4). Higher proportions of BPL than LL medications were dispensed in all risk strata. By the last follow-up period, Figure 1 shows that dual therapy was dispensed to 2% with <5% risk, 18% with 5–9% risk, 34% with 10–14% risk, and 49% with ≥15% 5-year risk.
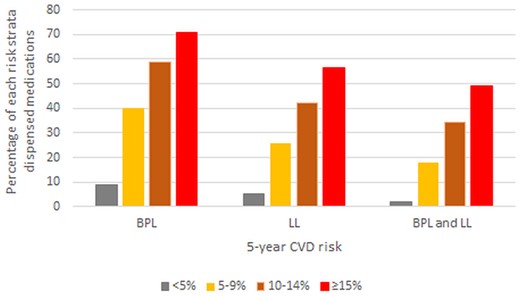
Proportion of the total study population dispensed cardiovascular disease medications at 31 March 2016 (after 3 years of follow-up) according to 5-year cardiovascular disease risk strata. Ten-year risk is approximately double 5-year risk (e.g. ≥15% 5-year risk is about equivalent to ≥30% 10-year risk).
Among individuals untreated at baseline, Figure 2 indicates that dispensing during follow-up (i.e. initiation of treatment) was also strongly associated with CVD risk in all three medication categories, and for dual therapy ranged from 1.3% to 13% across risk strata after 3 years.
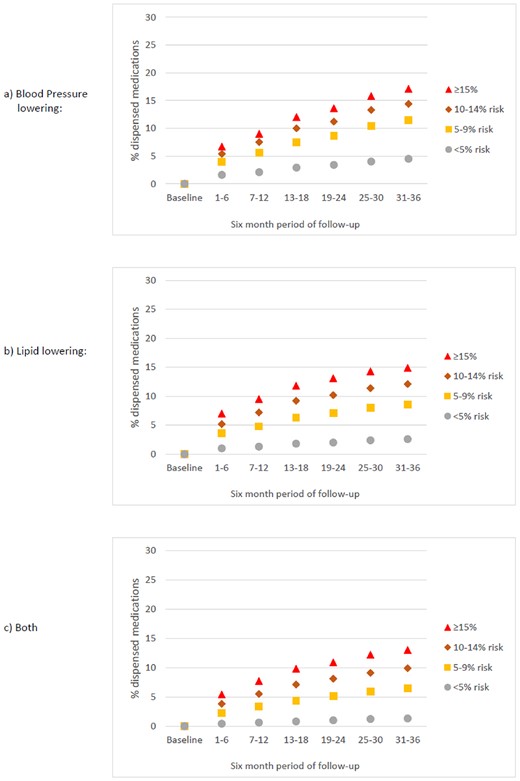
Proportion of the study population who were untreated at baseline and INITIATED TREATMENT between 1 April 2013 and 31 March 2016 according to 5-year cardiovascular disease risk strata (cross-sectional estimates at 6-month intervals). Ten-year risk is approximately double 5-year risk (e.g. ≥15% 5-year risk is about equivalent to ≥30% 10-year risk).
Among people dispensed baseline pharmacotherapy, dispensing by the end of follow-up (i.e. continuation of baseline treatment) ranged across the four risk strata from 84% to 94% for BPL medications, 78% to 90% for LL medications, and 81% to 89% for dual therapy, as shown in Figure 3.
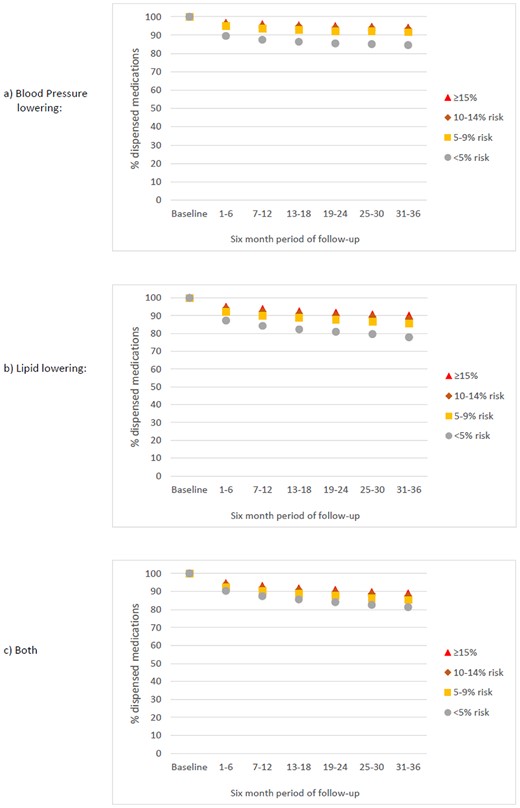
Proportion of the study population who MAINTAINED BASELINE TREATMENT between 1 April 2013 and 31 March 2016 according to 5-year cardiovascular disease risk strata (cross-sectional estimates at 6-month intervals). Ten-year risk is approximately double 5-year risk (e.g. ≥15% 5-year risk is about equivalent to ≥30% 10-year risk).
Sensitivity analyses examining cross-sectional dispensing estimates for statins alone and both BPL/statin therapy among the total study population were similar to those observed for LL alone and both BPL and LL medications (Supplementary material online, Appendix S5 Figure S5).
Remaining untreated and sustained maintenance of baseline treatment by clinical and demographic baseline characteristics
The adjusted RRs, by clinical and demographic baseline characteristics, of remaining untreated and sustained maintenance of baseline treatment were examined among the sub-group with ≥three 6-month follow-up periods (Supplementary material online, Appendix S5 Tables S2–S4). Baseline medication dispensing of BPL, LL, and dual therapy was similar to the total study population. Among individuals untreated at baseline with ≥15% 5-year risk, no history of diabetes and, less strongly, being aged 65–74 years were predictors for remaining untreated during follow-up in all three medication categories. Similar results were observed in the 10–14% risk stratum. Among those treated at baseline with ≥15% risk, there were no obvious clinical or demographic sub-groups less likely to have sustained maintenance of baseline treatment.
Discussion
Overview of study findings
In a 2013 whole-of-country primary prevention cohort comprising 2.25 million New Zealanders aged 30–74 years, 25% of individuals met the current national threshold for discussing preventive pharmacotherapy and 5% had ≥15% 5-year risk, where dual therapy is strongly recommended. Use of CVD medications was strongly associated with CVD risk group. Nevertheless, a major treatment gap exists; only 50% of individuals with ≥15% 5-year risk were treated with both BPL and LL medications and this changed minimally over 3 years. Initiation of medications was also associated with increasing risk, but even among those at highest risk who were untreated at baseline, only 13% commenced dual therapy by the study end. Baseline treatment was generally continued over 3 years irrespective of CVD risk strata. High-risk individuals were more likely to remain untreated if there was no history of diabetes and, to a lesser extent, if aged 65–74 years. Few differences were observed across clinical and demographic subgroups in the sustained maintenance of baseline treatment during follow-up.
Strengths and limitations
This is the first study to examine CVD pharmacotherapy according to risk in an entire national primary prevention population. The pharmacotherapy data that we used are sourced from national administrative dispensing records of routine clinical interactions, rather than from selected research or clinical settings (such as a group of primary care providers). Therefore, our findings are likely to be reflective of usual practice in New Zealand. Furthermore, we excluded individuals with prior CVD or heart failure based on ascertainment of hospitalizations over a retrospective 25-year period (1988–2013) combined with anti-anginal and loop diuretic dispensing in the 5 years before baseline (thereby identifying almost all individuals diagnosed exclusively in primary care with these conditions).
Nevertheless, some misclassification bias will have occurred owing to the small proportion of individuals with transient ischaemic attacks, and with atrial fibrillation (which is a predictor variable in the VARIANZ equations), that would have been managed solely in primary care and, therefore, would not be identified by these sources. Furthermore, diagnostic data from the private health sector are not routinely recorded in New Zealand administrative datasets, but private sector CVD-related admissions are relatively uncommon in New Zealand.12 Misclassification of pharmacotherapy dispensing status at baseline and during follow-up will also have occurred as some dispensing records cannot be matched to individuals. However, resulting bias in our analyses is likely to be minimal as ≤3% of dispensing episodes from 2013 onwards were affected (R. Hipkiss, New Zealand Ministry of Health, personal communication).
We could also not examine prescriptions, pharmacotherapy-related adverse events, side effects, or clinical risk factors, such as elevated blood pressure, lipids, or body mass index, as these data are not available in national databases. In New Zealand, however, treatment with BPL and LL medications is guided by absolute risk rather than individual risk factors. Furthermore, the VARIANZ tool was well calibrated with good discrimination when validated nationally and in subpopulations, despite not including these clinical risk factors as predictors.
We were unable to use the New Zealand-modified version of the Framingham equation (which was the risk assessment tool used clinically in New Zealand until 2018) to assign 5-year CVD risk since the Framingham algorithm requires blood pressure, lipid levels, and other clinical risk factor data. However, this is a minor limitation. Analyses in a primary care cohort recruited from 2002 onwards in the Auckland and Northland regions of New Zealand indicated that the Framingham-based tool over-predicted risk compared to the VARIANZ equations, particularly in the upper deciles of predicted risk (unpublished analyses). Therefore, we believe that individuals at low risk according to the VARIANZ tools are also likely to be low risk with the Framingham-based model, but individuals with intermediate or high risk according to the VARIANZ equations are likely to have had even higher Framingham-derived risks in a clinical context.
Baseline BPL and LL dispensing were two of the variables used to assign CVD risk and our outcome was BPL and LL dispensing stratified by risk group from 1 April 2013 to 31 March 2016. This methodology was formulated in conjunction with senior biostatisticians and is considered a minor limitation for three reasons. Firstly, there was strict temporal separation between the dispensing data used to assign baseline risk and the dispensing data from the follow-up period that was used for determining outcomes. Secondly, we have previously examined BPL and LL pharmacotherapy dispensed from 2006 to 2009 according to risk in a clinical cohort14 using a Framingham-based equation to assign baseline risk. The Framingham equation did not include BPL and LL medication dispensing as predictors and we found very similar trends to our current study, including slightly higher dispensing of BPL medications than LL agents. Thirdly, likelihood ratio chi-square analyses undertaken when developing the VARIANZ models indicate that age was the most influential predictor of CVD risk with sex-specific values 13–21 times higher than baseline BPL dispensing which ranked third, while baseline LL dispensing had negligible influence in the model fit for either sex. Despite the differing influence of baseline BPL and LL treatment on CVD risk, the patterns of follow-up dispensing according to risk observed in our study were similar for LL and BPL dispensing.
It was beyond the scope of this study to examine dispensing of specific combinations of CVD preventive medications. New Zealand risk management guidelines do not make recommendations in this regard, but further exploration would be valuable to determine if our observed dispensing patterns hold true for different combinations of BPL and LL medications. Individuals also remained in the CVD risk stratum to which they were assigned at baseline even if an individual’s risk factors changed during follow-up. However, a major focus of our interest was pharmacotherapy in the high-risk group and an individual with high baseline risk would remain high risk even if they developed additional risk factors during follow-up. For lower risk individuals, changes to baseline risk factors may have altered those individuals’ CVD risk during follow-up, but our period of follow-up was relatively short (3 years). Furthermore, the VARIANZ risk equations did not account for competing risk of non-CVD death. However, additional analyses (summarized in Supplementary material online, Appendix S3) indicate that overestimation of CVD risk was minor in the VARIANZ development cohorts comprised, like our cohort, of 30–74-year-old New Zealanders.
We excluded individuals with missing predictor data, including a very small number (n = 18) with unknown sex. We also excluded 13 056 individuals with unknown ethnicity and 16 929 individuals with unknown deprivation status. Most of these individuals, who had very low recorded proportions of diabetes, atrial fibrillation, or baseline medication dispensing, are likely to be short-term visitors to New Zealand who should be excluded from our analyses. However, a small number will be marginalized New Zealanders for whom meaningful imputation of missing data is not possible as they will have systematically different deprivation and ethnicity than their counterparts matched by age, sex, and other recorded baseline parameters.
Comparison to other studies
As our study is the only analysis examining CVD primary preventive pharmacotherapy according to CVD risk for an entire country, we are unable to make meaningful ‘whole-of-population’ international comparisons. We are also unable to compare New Zealand pharmacotherapy patterns to those in Europe as the European Action on Secondary and Primary Prevention through Intervention to Reduce Events (EUROASPIRE) cross-sectional surveys15 consider treatment for individual risk factors rather than absolute risk. Australian national survey data from 2011 to 2012 suggests lower levels of treatment according to risk than in New Zealand, with a quarter of Australians with ≥15% 5-year risk and just over 10% of those with 10–14% 5-year risk treated with dual therapy.16
New Zealand was the first country to adopt CVD risk management guidelines based on multivariable predicted risk in 1992. Electronic decision support for risk assessment and management was introduced in 2002 to selected general practices and is now widely implemented. In 2012 (i.e. the year before commencement of our study), the New Zealand Ministry of Health initiated a funded national programme that aimed to risk assess 90% of the eligible population. This was achieved nationally by 2016, which coincides with our study end, although risk assessment levels among different sub-populations (such as high-risk ethnic groups) are not clear. Previous studies of selected New Zealand primary care patients showed little evidence of treatment targeting according to risk in 2000,17 with dispensing of dual therapy to around one-third of those with ≥10% 5-year CVD risk by 200318 and little change over the 2006–0914 period. Our results, though suggestive of further improvements in risk-based treatment targeting, are not directly comparable to these earlier studies that assessed CVD risk using a modified Framingham algorithm.
Our previous analysis of routine medication dispensing from 2006 to 2009 according to CVD risk in an Auckland/Northland primary care cohort14 found similar initiation and maintenance patterns to our current findings. Analyses among patients initiating pharmacotherapy in research settings internationally present conflicting results; some have shown a high level of pharmacotherapy maintenance,19 as we found, but others suggest a sharp early decrease in dispensing following treatment initiation followed by a slow decline in medication dispensing over the medium and long term.20,21 In New Zealand, reduced financial barriers to treatment, through Government subsidies of almost all CVD preventive medications, are likely to facilitate continuation of pharmacotherapy.
Clinical and population-level implications
Our study highlights a method (i.e. risk assessment using routinely collected data) to identify treatment gaps and quality improvement opportunities that can be replicated in countries and regions where administrative health data can be linked at the individual level. Entire-population CVD risk prediction equations are already being explored in Denmark. Our study also suggests that a two-part strategy is required in high-income countries to optimize primary prevention of cardiovascular disease. A focus on incentivized and electronically supported CVD risk assessment in New Zealand (the first part) has resulted in use of pharmacotherapy for primary prevention of CVD that is largely risk-based. Despite this, significant treatment gaps exist in New Zealand with only half of those with very high 5-year risk (≥15%) receiving dual therapy. Risk assessments that identified high-risk individuals may not necessarily have translated into discussions around clinical risk management. Therefore, our findings emphasize the importance of additional system-wide measures (the second part) in high-income countries to support a reduction in the treatment gap among those at highest risk. These system-wide measures include establishing nationally consistent indicators and targets that incentivize clinical risk communication and health provider/patient discussions regarding risk management to encourage initiation of medications among those who meet guideline thresholds. Specific targets and tailored interventions for selected sub-groups, such as high-risk ethnicities, will also be required to ensure that reductions in the treatment gap occur equitably across populations.
In addition to the treatment gap among those at highest risk, only one-third of individuals with 5–14% risk received dual therapy. For this group, the risk management guidelines recommend clinician/patient shared decision-making regarding both non-pharmacological modifications and commencement of pharmacotherapy following consideration of the benefit/harm balance. While our analyses could identify medication dispensing, many individuals with an intermediate risk level may have also undertaken behavioural modifications, such as increasing physical activity, that are not recorded in the national health databases and therefore could not be examined. Nevertheless, the frequency of these non-pharmacological modifications and their influence on CVD risk over time warrants future examination in New Zealand clinical cohorts.
Despite the annual recall and review policy advocated in New Zealand guidelines for those at highest risk, individuals at ≥15% 5-year risk but without recorded diabetes and those aged 65–74 years were more likely to remain untreated. The reasons for non-initiation in these groups are unclear. The influence of multimorbidity, polypharmacy and pharmacotherapy side-effects in this regard among older adults require further exploration. Patient perceptions of risk and treatment benefit, as well as clinician-held beliefs regarding risk management in different population sub-groups, could not be assessed in our cohort but may influence the lower likelihood of treatment initiation among individuals without diabetes. These patient and clinician perceptions require future investigation as they will influence management decisions and, ultimately, achievable treatment gains.
Supplementary material
Supplementary material is available at European Journal of Preventive Cardiology online.
Acknowledgements
The authors thank Associate Professor Matire Harwood for reviewing the manuscript.
Funding
This work was supported by the Health Research Council of New Zealand [grant numbers 11/800, 14/010 to S.M.] and the Stevenson Foundation [to S.W.].
Conflict of interest: S.M., S.W., and R.J. report grants from the Health Research Council of New Zealand, and S.W. reports a grant from the Stevenson Foundation during the conduct of the study. K.P. and C.G. report grants from the Heart Foundation of New Zealand outside the submitted work.
Disclaimer
The results in this article are not official statistics and the conclusions expressed are those of the authors, not Statistics New Zealand. A full disclaimer is included in Supplementary material online, Appendix S6.
References
Ministry of Health.
StataCorp.

Comments