


Abstract
To explore how change in cardiorespiratory fitness is associated with incident hypertension in adults, and whether the association varies between sex, age, body mass index, cardiorespiratory fitness at baseline and follow-up time. A second aim is to study how change in other lifestyle-related variables affects the results.
A total of 91,728 participants (48% women), normotensive at baseline, with two examinations from occupational health service screenings between 1982 and 2019 (mean duration 4.3 years) were included. Cardiorespiratory fitness was assessed as estimated maximal oxygen consumption using submaximal cycle testing. Change in cardiorespiratory fitness was expressed as the percentage change per year. Incident hypertension was defined as systolic blood pressure of 140 mmHg or greater or diastolic blood pressure of 90 mmHg or greater, or self-reported physician-diagnosed hypertension, at second examination.
A large increase (≥3% annual change) in cardiorespiratory fitness was associated with a 11% lower risk of incident hypertension compared with maintainers (–1 to +1%), after multi-adjustment including change in smoking, body mass index, diet, stress and exercise habits. On the contrary, a small (–1 to −<3%) and large (≥–3%) decrease in cardiorespiratory fitness associated with a 21% and 25% higher risk compared with maintainers. Longer duration between the examinations was associated with stronger risk associations. Preserving, or changing to, risk level for the other lifestyle variables was associated with a higher risk of incident hypertension. However, a simultaneous maintenance of or increase in cardiorespiratory fitness attenuated the risk associated with smoking, and stress.
Preserving or increasing cardiorespiratory fitness should be part of any long-term strategy to decrease the risk of incident hypertension.
Introduction
Hypertension is one of the most common medical conditions associated with cardiovascular disease (CVD) and a leading risk factor for global mortality.1 The development and diagnosis of hypertension at a young age (<30 years) is associated with a higher lifetime risk of the development and early onset of CVD as well as shorter total life expectancy.2 Heredity and lifestyle-related factors including exercise, smoking and unhealthy dietary habits may accelerate the progression of hypertension.3,4 Hence, lifestyle intervention together with drug therapy are cornerstones for the prevention and treatment of hypertension.3–5
Exercise training is a primary lifestyle intervention for the prevention of hypertension.6 Higher levels of exercise are associated with a lower risk of incident hypertension in normotensive individuals at baseline,7 as well as lower systolic and diastolic blood pressure (BP) in hypertensive individuals after exercise intervention.8 Less is known regarding long-term changes in exercise and incident hypertension. A few previous observational studies have reported that improved or maintained cardiorespiratory fitness (CRF) between two examinations in adulthood is associated with a lower risk of subsequent hypertension.9–14 However, small sample sizes or a low proportion of women in the previous studies have restricted the possibilities to perform clinically relevant comparisons between men and women, different age groups and body mass index (BMI) status. Moreover, simultaneous adjustments for changes in other lifestyle behaviours relevant to the development of hypertension (such as smoking, diet and stress) are typically lacking, as well as comparisons between short and long-term follow-ups.
Accordingly, the aims of this study were to explore how changes in CRF are associated with the risk of incident hypertension in adults, and whether this association varied in clinically relevant subgroups including sex, age, BMI, CRF at baseline and follow-up time. A second aim was to study how changes in other lifestyle-related variables influenced the results.
Methods
The current study is a retrospective analysis based on data from the health profile assessment (HPA) database, which is managed by the HPI Health Profile Institute (HPI, Stockholm, Sweden). HPA is an interdisciplinary method and consists of a questionnaire about current lifestyle, exercise habits and health experiences, as well as a physical examination,15 and has been carried out continuously in Swedish health services since the middle of the 1970s. Participation in the HPA was free of charge, offered to all employees working for a company or an organisation connected to occupational or other health services in Sweden. All data are subsequently registered in a central database. HPI is responsible for the database as well as the standardisation of the methods and education of HPA coaches. For the present analyses, we included all participants who had completed at least two HPAs between October 1982 until November 2019, and with valid measurements of CRF and BP on both occasions. For individuals with more than two HPAs, the latest valid HPA was used. Exclusion criteria were high BP at first examination (systolic ≥140 mmHg or diastolic ≥90 mmHg) or a diagnosis of hypertension (self-reported). In total, 94,868 individuals fulfilled these criteria. To minimise the influence of uncertainties in the data collection, we excluded those who had less than 90 days between examinations (n = 1840), an annual increase/decrease in CRF of more than 50% (n = 167), were younger than 18 years or older than 79 years of age (n = 15), or had missing data for stratification or confounding variables (n = 1118). The original study adhered to the Declaration of Helsinki and was approved by the Stockholm Ethics Review Board (Dnr 2015/1864-31/2 and 2016/9-32).
Assessment of CRF
CRF was assessed as estimated maximal oxygen consumption (VO2max) using the standardised Åstrand submaximal cycle test,16 and expressed in absolute (L*min–1) and relative (mL*min-1*kg–1) terms. To minimise well-known errors with submaximal testing, participants were requested to refrain from vigorous activity the day before the test, consuming a heavy meal 3 hours and smoking/snuff use one hour before the test and avoiding stress. We have previously shown small and non-significant mean differences on group level (–0.07 L*min–1; 95% confidence interval (CI) –0.21 to 0.06) between estimated VO2max using the Åstrand test and direct measured VO2max during treadmill running, with an absolute error and coefficient of variance similar to other submaximal tests (standard error of estimate 0.48 L*min−1; coefficient of variance 18.1%).17
BP measurements and determination of incident hypertension
Systolic and diastolic BP were measured manually by standard auscultator method in the seated position after 20 minutes of resting. For those participants that had high systolic and/or diastolic BP, a second assessment for confirmation was made after 20 minutes rest after the submaximal cycle test. Incident hypertension was defined as systolic BP of 140 mmHg or greater or diastolic BP of 90 mmHg or greater or self-reported physician-diagnosed hypertension at follow-up. Isolated systolic BP (≥140 mmHg) and isolated diastolic BP (≥90 mmHg) were also used for analyses.
Covariates
Body height and weight were assessed to the nearest 0.5 cm and 0.5 kg, respectively, using a calibrated scale and wall-mounted stadiometer. BMI was subsequently calculated (kg/m2). Current smoking, diet, perceived overall stress and exercise habits were self-reported as follows: Smoking was assessed using the statement ‘I smoke’, with the following alternatives of reply ‘At least 20 cig/day’, ‘11–19 cig/day’, ‘1–10 cig/day’, ‘Occasionally or never’; Diet was assessed by the statement ‘I consider my diet, regarding both meal frequency and nutrition content to be’, with the alternatives ‘Very poor’, ‘Poor’, ‘Neither good nor bad’, ‘Good’ or ‘Very good’; Overall stress was assessed by the statement ‘I perceive stress in life, both personally and at work’, with the alternatives ‘Very often’, ‘Often’, ‘Sometimes’, ‘Rarely or Never’; and Exercise was assessed by the statement ‘I exercise/train…’, with the alternatives ‘Never’, ‘Occasionally’, ‘1–2 times a week’, ‘3–5 times a week’ or ‘At least 6 times a week’. Intake of medication affecting the cardiovascular system was self-reported as ‘Yes’ or ‘No’, with no further specification of which medications. Occupation was reported according to the Swedish Standard Classification of Occupations 1996 and 2012, and was further grouped into three broad skill levels defined by the highest level of education attained: ‘Primary school level’, ‘Upper secondary and tertiary level 3 years or less in length’ or ‘University’.
Statistical analysis
Change in CRF was expressed as the percentage change in absolute VO2max (L*min–1) per year, assessed as the difference between follow-up and baseline divided by baseline levels and further divided by the number of years between the two examinations. All participants were further categorised into five arbitrary groups according to annual change in CRF: –3% or greater (large decreasers), –1% to –2.9% (small decreasers), +0.9 to –0.9% (maintainers), +1 to +2.9% (small increasers) and +3% or greater (large increasers). Continuous data showed non-normal distribution according to the Kolmogorov–Smirnov test, and are summarised as medians and interquartile ranges (Q1 to Q3). Categorical data are presented as percentages. Differences in baseline characteristics between the five CRF changing groups were tested by Kruskal–Wallis analysis (continues variables) and the chi-square test of variance (categorical variables), adjusting for multiple comparisons. Binary logistic regression was used to estimate odds ratios (ORs) and 95% CIs for incident hypertension as well as isolated high systolic and diastolic BP detected at the second examination, with adjustment for covariates according to the following: model 1 adjusted for sex, age and time between examinations; model 2 additionally adjusted for baseline CRF, intake of cardiovascular medication and educational level; model 3 additionally adjusted for change in risk level/behaviour of smoking, BMI, diet, stress and exercise habits between the two examinations. To test for interaction between the covariates and change in CRF (continuous), an interaction term was introduced in the regression analysis, and interactions were defined as P < 0.05 for the interaction term. The covariates for risk level/behaviour were dichotomised accordingly; smoking was defined as ‘≥1 cig/day’, for BMI as BMI 30 or greater, for diet as ‘very poor or poor’, for stress as ‘very often or often’ and for exercise habits as ‘never or occasionally’. For the purpose of this study, these were further categorised into four groups: improved level/behaviour (risk at baseline but not at follow-up); impaired level/behaviour (no risk at baseline but at follow-up); maintained non-risk level/behaviour (non-risk at baseline and non-risk at follow-up); and maintained risk level/behaviour (risk at baseline and risk at follow-up). To study the interaction between CRF change and changes in the other lifestyle-related variables, the procedure described by Altman and Bland was used.18 All analyses were performed using IBM Statistical Package for the Social Sciences for Windows (SPSS; version 25, 2017, SPSS Inc., Chicago, IL, USA).
Results
A total of 91,728 participants (48% women, mean age 40.7 years) were included. The mean duration between two examinations was 4.3 years (standard deviation (SD) 3.7, ranging from 90 days to 29.1 years). CRF at baseline was significantly higher in decreasers, with a stepwise decrease for maintainers, small increasers and large increasers (Table 1). Large decreasers and large increasers had fewer days between examinations compared with the other groups. Baseline isolated systolic BP was significantly higher in large increasers. Associations (ORs, 95% CI) between CRF change and incident hypertension as well as isolated high systolic and diastolic BP at second examination are presented in relation to continuous levels (Figure 1) and aggregated groups (Table 2) of change in CRF. Compared with maintainers (set as reference), ORs for incident hypertension were significantly higher among both small OR = 1.16 (1.10–1.23) and large OR = 1.20 (1.13–1.28) decreasers (Table 2, model 1). Further multi-adjustment including changes in smoking, BMI, diet, stress and exercise habits between the two examinations only slightly modified the associations (model 3). Small increasers had similar ORs as maintainers, while large increasers had a significantly lower OR for incident hypertension 0.89 (0.83–0.95). Similar patterns were seen for both isolated high diastolic and systolic BP, however, with no significantly higher ORs for small decreasers compared with maintainers regarding isolated high systolic BP and no significantly lower ORs for isolated high diastolic BP in large increasers. There was significant interaction between CRF change (continuous variable) and time between tests (p ≤ 0.001) and age (p ≤ 0.001). No interactions were seen for CRF change and sex (p = 0.732), CRF at baseline (p = 0.914), intake of cardiovascular medication (p = 0.803), educational level (p = 0.876) and change in BMI (p = 0.928), diet (p = 0.923), stress (p = 0.923), smoking (p = 0.925) and exercise (p = 0.915).
Baseline characteristics of the study population in relation to five groups of annual change in CRF.
| Large decreasers (<–3.0%) | Small decreasers (–1.0–2.9%) | Maintainers (–0.9–0.9%) | Small increasers (1.0–2.9%) | Large increasers (>3.0%) | |
|---|---|---|---|---|---|
| N (% women) | 22 315 (49%)a,b,c,d | 16 716 (43%)b,c,d | 18 777 (46%)d | 10 734 (44%)d | 23 186 (49%) |
| Age (years) | 42 (33–50)a,b,c,d | 40 (33–48)c | 40 (33–48)c | 40 (33–48) | 42 (32–48) |
| BMI (kg/m–2) | 24.7 (22.6–27.1)b | 24.6 (22.5–26.9) | 24.5 (22.4–26.9)d | 24.6 (22.5–27.0) | 24.6 (22.5–27.0) |
| Estimated VO2max (L/min–1) | 3.0 (2.5–3.5)b,c,d | 3.0 (2.5–3.6)b,c,d | 2.8 (2.3–3.3)c,d | 2.7 (2.3–3.2)d | 2.5 (2.1–2.9) |
| Days between baseline and follow-up | 854 (398–1458)a,b,c,d | 2049 (1126–3221)b,c,d | 2047 (1049–3358)c,d | 1499 (887–2499)d | 700 (357–1167) |
| Smoking habits (>1 cig./day) | 10%a,b,c,d | 9% | 9% | 8% | 10% |
| Diet habits (very poor/poor) | 6%a,b | 8%c,d | 8%c,d | 7% | 6% |
| Overall stress (very often/often) | 14.1% | 13.8% | 13.7% | 13.7%d | 15.1% |
| Current exercise (never/occasionally) | 30%a,b,c,d | 32%b,c,d | 35% | 35% | 36% |
| Intake of cardiovascular medication | 2%a,b | 3%c,d | 3%c,d | 3% | 2% |
| Diastolic blood pressure (mmHg) | 75 (70–80) | 75 (70–80) | 75 (70–80) | 75 (70–80) | 75 (70–80) |
| Systolic blood pressure (mmHg) | 120 (110–128)d | 120 (110–128)d | 120 (110–128)d | 120 (110–129) | 120 (110–130) |
Data shown as median (Q1–Q3) or %.
aSignificantly different from small decreasers.
bSignificantly different from maintainers.
cSignificantly different from small increasers.
dSignificantly different from large increasers.
CRF: cardiorespiratory fitness; BMI: body mass index; SD: standard deviation; VO2max: maximal oxygen consumption.
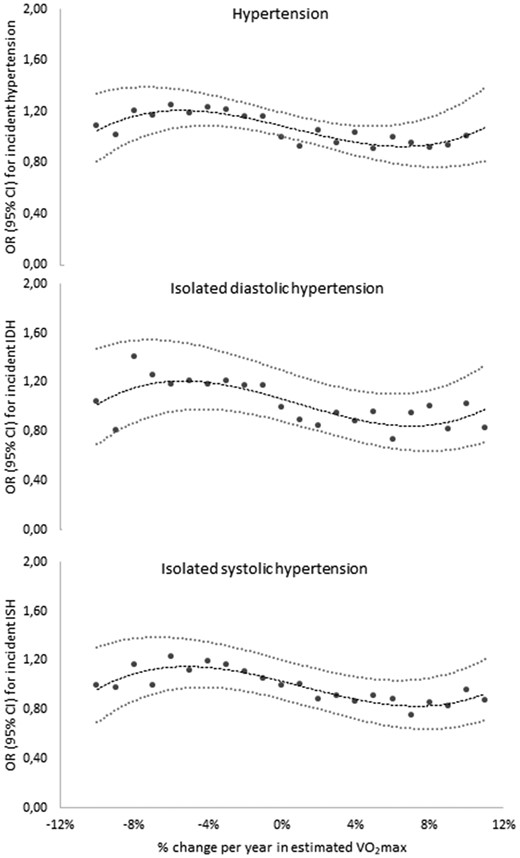
Odds ratios (ORs) (95% confidence intervals (CIs)) for continuous levels of change (% per year) in maintained cardiorespiratory fitness (CRF) for incident hypertension, isolated diastolic hypertension, and isolated systolic hypertension at second examination. Adjusted for sex, age, days between examinations, CRF at baseline, intake of cardiovascular medication, and educational level. IDH: isolated diastolic hypertension; ISH: isolated systolic hypertension.
OR (95% CI) for incident hypertension as well as isolated high systolic and diastolic BP in relation to annual change in CRF and different follow-up time.
| Change in CRF | ||||||
|---|---|---|---|---|---|---|
| Large decreasers | Small decreasers | Maintainers | Small increasers | Large increasers | r2 | |
| Incident hypertension | ||||||
| Model 1 | 1.20 (1.13–1.28) | 1.16 (1.10–1.23) | 1 (ref) | 0.98 (0.92–1.06) | 0.97 (0.91–1.04) | 0.12 |
| Model 2 | 1.26 (1.18–1.34) | 1.22 (1.14–1.29) | 1 (ref) | 0.95 (0.89–1.15) | 0.89 (0.83–0.95) | 0.15 |
| Model 3 | 1.25 (1.17–1.34) | 1.21 (1.14–1.29) | 1 (ref) | 0.96 (0.89–1.03) | 0.89 (0.83–0.95) | 0.17 |
| Isolated high diastolic BP (≥90 mmHg) | ||||||
| Model 1 | 1.13 (1.01–1.27) | 1.16 (1.03–1.29) | 1 (ref) | 0.95 (0.83–1.09) | 0.98 (0.86–1.10) | 0.02 |
| Model 2 | 1.21 (1.07–1.36) | 1.21 (1.08–1.35) | 1 (ref) | 0.92 (0.80–1.06) | 0.90 (0.80–1.03) | 0.02 |
| Model 3 | 1.19 (1.05–1.34) | 1.20 (1.07–1.34) | 1 (ref) | 0.93 (0.81–1.07) | 0.91 (0.80–1.03) | 0.04 |
| Isolated high systolic BP (≥140 mmHg) | ||||||
| Model 1 | 1.09 (0.99–1.19) | 1.05 (0.96–1.14) | 1 (ref) | 0.92 (0.82–1.02) | 0.91 (0.83–1.01) | 0.07 |
| Model 2 | 1.12 (1.02–1.23) | 1.07 (0.98–1.17) | 1 (ref) | 0.90 (0.80–1.01) | 0.87 (0.79–0.96) | 0.07 |
| Model 3 | 1.11 (1.01–1.23) | 1.07 (0.98–1.17) | 1 (ref) | 0.90 (0.80–1.01) | 0.87 (0.78–0.96) | 0.08 |
| Stratified for time between the two examinations* | ||||||
| Incident hypertension | ||||||
| 3 months to 1 yr (n=15034) | 1.00 (0.81–1.23) | 0.93 (0.69–1.25) | 1 (ref) | 0.59 (0.42–0.82) | 0.81 (0.66–0.99) | 0.10 |
| 1 to 5 yrs (n=46495) | 1.10 (1.00–1.20) | 1.18 (1.06–1.32) | 1 (ref) | 0.98 (0.87–1.11) | 0.83 (0.75–0.92) | 0.12 |
| 5 to 10 yrs (n=21732) | 1.36 (1.21–1.52) | 1.18 (1.07–1.30) | 1 (ref) | 0.87 (0.77–0.99) | 0.69 (0.60–0.81) | 0.17 |
| >10 yrs (n=8467) | 1.29 (0.95–1.75) | 1.26 (1.12–1.43) | 1 (ref) | 0.88 (0.73–1.06) | 0.73 (0.50–1.08) | 0.20 |
| Isolated high diastolic BP | ||||||
| 3 months to 1 yr | 0.72 (0.50–1.03) | 0.84 (0.51–1.40) | 1 (ref) | 0.44 (0.24–0.82) | 0.70 (0.50–0.98) | 0.04 |
| 1 to 5 yrs | 1.18 (0.99–1.41) | 1.33 (1.09–1.62) | 1 (ref) | 0.96 (0.77–1.21) | 0.91 (0.76–1.09) | 0.04 |
| 5 to 10 yrs | 1.33 (1.08–1.66) | 1.12 (0.93–1.35) | 1 (ref) | 1.01 (0.81–1.26) | 0.86 (0.65–1.12) | 0.03 |
| ≥10 yrs | 1.20 (0.66–2.16) | 1.23 (0.97–1.56) | 1 (ref) | 0.69 (0.46–1.03) | 1.14 (0.60–2.17) | 0.03 |
| Isolated high systolic BP | ||||||
| 3 months to 1 yr | 1.07 (0.80–1.44) | 1.04 (0.68–1.60) | 1 (ref) | 0.49 (0.29–0.83) | 0.76 (0.57–1.02) | 0.06 |
| 1 to 5 yrs | 1.01 (0.88–1.16) | 1.05 (0.89–1.23) | 1 (ref) | 0.93 (0.78–1.11) | 0.85 (0.73–0.97) | 0.07 |
| 5 to 10 yrs | 1.12 (0.94–1.34) | 1.03 (0.89–1.19) | 1 (ref) | 0.78 (0.64–0.94) | 0.70 (0.55–0.89) | 0.07 |
| ≥10 yrs | 0.88 (0.54–1.41) | 1.11 (0.92–1.34) | 1 (ref) | 1.08 (0.83–1.42) | 0.81 (0.44–1.48) | 0.07 |
Model 1, adjusted for sex, baseline age and time between examinations. Model 2, additionally adjusted for baseline CRF, intake of cardiovascular medication, and educational level. *Model 3, additionally adjusted for change in smoking, BMI, diet, stress and exercise habits between the two examinations.
CRF change and incident hypertension in relation to follow-up time
Associations between change in CRF and incident hypertension were stronger with a longer duration between the two examinations, for decreasers. On the contrary, small and large increasers had a significantly lower OR compared to maintainers in short-term follow-up participants (3 months to 1 year) and in those with 5 to 10 years between examinations.
Regarding isolated high diastolic BP, significantly beneficial associations with an increase in CRF were only evident in short-term follow-up participants (3 months to 1 year), and adverse associations in small and large decreasers with 1–5 years and 5-10 years, respectively, between examinations. For isolated high systolic BP, small and large increasers had lower ORs in the short and middle-term follow-up. No significant associations were seen for decreasers.
CRF change and incident hypertension in relation to subgroups
Small and large increasers and decreasers, respectively, were collapsed into groups of ‘decreasers’” (≥–1%) and ‘increasers’ (≥1%) for subgroup analyses (Figure 2).
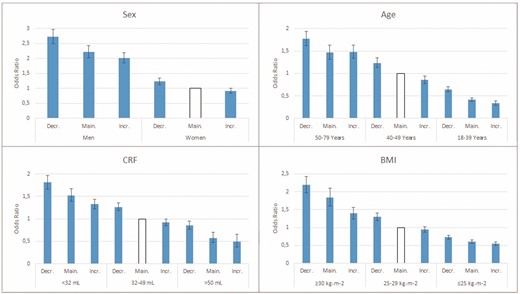
Odds ratios (ORs) (95% confidence intervals (CIs)) for incident hypertension in relation to annual change in CRF in subgroups of sex, age, cardiorespiratory fitness (CRF) and body mass index (BMI) at baseline. Adjusted for (when not evaluated) sex, age at baseline, time between examinations, baseline CRF, intake of cardiovascular medication, educational level and change in smoking, BMI, diet, stress and exercise habits between examinations. Decr.: decreasers; Main.: maintainers; Incr.: increasers.
Men, older age, lower CRF and higher BMI at baseline had significantly higher ORs for incident hypertension at follow-up compared with their counterparts. However, in all subgroups and independent of baseline level, decreasers had significantly higher ORs compared with maintainers and increasers, with small differences between the latter two. Moreover, decreasers in a more favourable subgroup of age (younger), CRF (higher) and BMI (lower) at baseline, had a comparable OR of incident hypertension to increasers in a less favourable subgroup at baseline.
CRF change, incident hypertension and changes in other lifestyle-related variables
ORs for incident hypertension were higher in participants who maintained or changed to a risk level/behaviour of smoking, BMI, diet, stress or exercise between the two examinations, compared with those who maintained, or improved, a non-risk level/behaviour (Table 3, second left column). Further, in those who maintained or improved to a non-risk level/behaviour, decreasers had a significantly higher OR, and increasers a significantly lower OR, for incident hypertension compared to maintainers (Table 3, right). Also, in those maintaining or changing to a risk behaviour, maintaining or increasing CRF attenuated this risk, especially in those with risk behaviour/level of smoking and stress.
ORs (95% CI) of incident hypertension in relation to change in smoking, BMI, diet, stress and exercise habits between the two assessments (two left columns) and after cross-tabulation of change in CRF and change in the other lifestyle-related behaviours (three right columns).
| OR for incident hypertension according to change in the other lifestyle-related behaviours | Change in other lifestyle-related behaviours and change in CRF | ||||
|---|---|---|---|---|---|
| Smoking | Decreasers | Maintainers | Increasers | ||
| Maintained non-daily smoking (n=81726) | 1 (ref) | 1 (ref) | 1.23 (1.17–1.30) | 1.00 (ref) | 0.92 (0.87–0.98) |
| Quit daily smoking (n=2803) | 1.01 (0.93–1.11) | ||||
| Started daily smoking (n=1337) | 1.03 (0.88–1.22) | 1.01 (0.94–1.09) | 1.28 (1.15–1.59) | 1.07 (0.91–1.23) | 0.84 (0.72–0.96) |
| Maintained daily smoking (n=5862) | 1.04 (0.93–1.16) | ||||
| BMI | |||||
| Maintained non–obese (n=79499) | 1 (ref) | 1 (ref) | 1.24 (1.17–1.32) | 1.00 (ref) | 0.94 (0.88–1.00) |
| Change to non–obese (n=1562) | 1.20 (1.03–1.40) | ||||
| Change to obese (n=3517) | 2.51 (2.31–2.73) | 2.53 (2.41–2.68) | 3.22 (2.99–3.51) | 2.71 (2.43–3.02) | 2.25 (2.03–2.48) |
| Maintained obese (n=7147) | 2.57 (2.41–2.74) | ||||
| Diet | |||||
| Maintained good/very good diet (n=83813) | 1 (ref) | 1 (ref) | 1.22 (1.16–1.29) | 1.00 (ref) | 0.91 (0.86–0.96) |
| Change to good/very good diet (n=4949) | 0.96 (0.88–1.04) | ||||
| Change to poor diet (n=1607) | 1.51 (1.31–1.74) | 1.49 (1.34–1.65) | 1.82 (1.57–2.11) | 1.28 (1.01–1.62) | 1.43 (1.18–1.73) |
| Maintained poor diet (n=1359) | 1.44 (1.24–1.69) | ||||
| Perceived overall stress | |||||
| Maintained sometimes/rarely/never (n=72406) | 1 (ref) | 1 (ref) | 1.23 (1.16–1.30) | 1.00 (ref) | 0.92 (0.86–0.98) |
| Change to sometimes/rarely/never (n=8251) | 0.95 (0.88–1.02) | ||||
| Change to often/very often (n=6167) | 1.12 (1.03–1.22) | 1.07 (1.06–1.15) | 1.34 (1.21–1.48) | 1.08 (0.94–1.24) | 0.96 (0.85–1.08) |
| Maintained often/very often (n=4904) | 1.00 (0.90–1.02) | ||||
| Exercise habits | |||||
| Maintained ≥1 time/week (n=51330) | 1 (ref) | 1 (ref) | 1.24 (1.17–1.31) | 1.00 (ref) | 0.91 (0.86–0.97) |
| Change to ≥1 time/week (n=15287) | 0.95 (0.90–1.01) | ||||
| Change to occasionally/never (n=9810) | 1.15 (1.08–1.23) | 1.15 (1.10–1.20) | 1.56 (1.31–1.87) | 1.26 (1.03–1.54) | 1.11 (0.92–1.35) |
| Maintained occasionally/never (n=15301) | 1.12 (1.06-1.21) | ||||
Adjusted for sex, age at baseline, time between tests, baseline CRF, intake of cardiovascular medication, educational level, and change in smoking, BMI, diet, stress and exercise habits between examinations (when not evaluated). Increasers; ≥+1%, Maintainers <-1 to <+1%, Decreasers ≥-1% annual change in CRF.
Discussion
In a large cohort of Swedish men and women who were normotensive at baseline, a large increase (≥+3% annual change) in CRF between two examinations was associated with a 11% lower risk of incident hypertension, compared with maintainers. On the contrary, a small (–1.0 to −2.9%) and large (≥–3%) annual decrease in CRF was associated with a 21% and 25% higher risk, respectively. These associations were seen even after multi-adjustment including baseline values and simultaneous changes in other lifestyle-related behaviours including smoking, BMI, diet, stress and exercise habits. Longer duration between the first and second examination was associated with stronger risk associations for decreasers. Maintenance of, or change to, a risk behaviour/level of the other lifestyle-related variables was associated with a higher risk of hypertension. However, this was only seen in participants who decreased their CRF between the two examinations. Hence, preserving or increasing CRF in adulthood is essential to decrease the risk of incident hypertension.
The present results are in line with previous findings,9–12 but add important clinical information to the existing knowledge. For example, previous studies have shown in middle-aged men that the risk of incident hypertension was 72% higher after 5 years’ follow-up in participants with an annual decrease in CRF ( < –1.18 mL/kg/min) compared with increasers.11 Moreover, in 4932 middle-aged participants (13% women), a 22–36% lower risk was reported in participants who increased CRF by 1% per year or greater compared with decreasers (≥–1%) after 10.7 years’ follow-up.12 We further extended these findings with analyses in different subgroups, and showed that the risk associations with an increase and a decrease in CRF, respectively, were similar in men and women, CRF groups and in obese and non-obese individuals. Moreover, decreasers in a more favourable subgroup of CRF (higher) and BMI (lower) at baseline had a comparable OR of incident hypertension to increasers in a less favourable subgroup at baseline. For example, a decreaser with medium CRF at baseline had similar OR as an increaser with low CRF at baseline, and a decreaser with BMI 25–29.9 at baseline had similar OR as an increaser with BMI of 30 or greater at baseline.
The long-term effects of CRF on incident hypertension are clinically important. Previous studies have shown short-term effects, already after 4 weeks of exercise for lowering BP levels in normotensive individuals.8,19 The proposed mechanisms for lowering BP by increasing physical activity consist of early neurohumural, vascular and structural adaptations, which have previously been noted already after 6–8 weeks.4 This could explain some of the lower ORs seen for increasers with 3 months to 1 year between examinations. The postulated decrease in risk for incident hypertension up to 10 years after baseline examination may be the result of long-term effects on structural vascular adaptations, which impact total peripheral resistance.20,21 Other possible consequence of low or a decrease in CRF and hypertension is that it may lead to different cardiovascular complications or diseases, for example an elevated risk of atrial fibrillation.22
Changes in other lifestyle-related variables, such as weight gain,23 smoking24 and poor diet25 add to the associations of risk for incident hypertension, and were also shown in the present study. We showed that participants who changed to or maintained risk behaviour/level of smoking, and stress, but maintained or increased CRF between the two examinations had a lower risk of hypertension compared with decreasers. Also, the risk of hypertension was attenuated in participants maintaining obesity or becoming obese during follow-up, if they increased their CRF. The latter is in line with previous reports of more beneficial prognoses for CVD and all-cause mortality risk in individuals being fat but fit, compared with fat but unfit, mainly due to beneficial changes in metabolic risk factors, haemodynamic adaptations and more beneficial body fat disposition with increased and/or regular exercise levels regardless of weight loss.10,26 In addition, self-assessed stress has been shown to be related to incident hypertension.27,28 Interestingly, in the present study, this only applied to the individuals who decreased their CRF at follow-up, which is in line with previous findings that metabolic markers (low-density lipoprotein cholesterol, triglycerides) are increased in individuals reporting higher levels of stress, but only in those with low fitness.29 This partly independent importance of CRF changes in relation to other major risk factors for hypertension is clinically very pertinent,30–33 and implies that any long-term strategy for maintaining a normal BP using lifestyle behaviours should prioritise increased CRF as much as stopping smoking or losing weight.5,34
Strengths and limitations
The strength of the present study is the large population-based sample of men and women of different ages from the Swedish working population, with a large variation in baseline level and change in CRF between two examinations. A strength and novelty is the inclusion of change in other lifestyle-related variables to follow-up. Possible limitations include voluntary participation, which might affect the results because the cohort may be partly selected. However, the validity of the results from these types of associational studies are less influenced by selected populations, depending more on a wide range of both exposure and outcome. Another limitation is the use of a submaximal test to estimate VO2max. However, measuring actual VO2max during maximal performance would not have been feasible in this large non-athletic population, and the submaximal protocol used has been reported to yield valid and reliable estimations of actual compared with direct measured VO2max.17,35 Unfortunately, we did not have full medication data or family history of hypertension for the participants. However, we included self-reported heart medication intake as a confounder in the analyses. It is not possible to determine if the diagnosed hypertension was the earliest diagnosis of new-onset hypertension. Consequently, the follow-up duration might not accurately represent the true time to event. Although the data collection was not initially intended for research purposes, the standardisation of procedures and quality control is well suited for such analyses.
Conclusions
The main findings of this study have shown that maintaining or improving CRF in adulthood is associated with a lower risk of incident hypertension. This was evident regardless of sex, age, BMI status and level of CRF at baseline. Importantly, maintaining or increasing CRF attenuated the risk of incident hypertension associated with adverse changes in other lifestyle-related behaviours including smoking, and stress. Any long-term strategy for maintaining a normal BP, using lifestyle behaviours, should include measures to increase CRF.
Author contribution
GA, PW, BE, TH, MB and EEB contributed to the conception, acquisition, design of the work or analysis and interpretation of data. TH and EEB drafted the paper and BE, MB, GA and PW critically revised the paper. All authors gave final approval and agree to be accountable for all aspects of the work ensuring integrity and accuracy.
Acknowledgements
The author(s) would like to thank Jane Salier Eriksson for editorial assistance. Work was performed at the Åstrand Laboratory of Work Physiology, Swedish School of Sport and Health Sciences, GIH.
Declaration of conflicting interests
The author(s) declared the following potential conflicts of interest with respect to the research, authorship, and/or publication of this article: GA (responsible for research and method) and PW (CEO and responsible for research and method) are employed by the HPI Health Profile Institute. The funder HPI Health Profile Institute provided support in the form of salaries for authors (GA, PW) and research materials, but did not have any additional role in the study design, data collection and analysis, decision to publish, or preparation of the paper.
Funding
The author(s) disclosed receipt of the following financial support for the research, authorship, and/or publication of this article: This work was supported by the Swedish Research Council for Health, Working Life and Welfare (FORTE, Dnr 2018-00384), the Swedish Heart–Lung Foundation (Dnr, 20180636) and the Swedish Military Forces Research Authority (grant #AF 922 0915).
References
World Health Organization. Global status report on noncommunicable diseases 2014. Geneva: WHO,

Comments