


Abstract
Recent studies have investigated the association of transitions in metabolic health and obesity status over time with the risk of cardiovascular disease, focusing on the subgroup demonstrating metabolically healthy obesity. However, these studies have produced inconsistent results. This study evaluates the relation in a general Chinese population.
We conducted a prospective cohort study in a general population in Northeast China, with examinations of cardiovascular health from 2012–2015 and follow-up for incident cardiovascular disease until 2018. Cox proportional hazards and logistic regression models were used to investigate the association of baseline metabolic health and obesity status and transitions in those statuses with cardiovascular disease risk.
A total of 7472 participants aged ≥35 years who were free of cardiovascular disease at baseline were included in this analysis. Over a median follow-up of 4.66 years, a total of 344 cardiovascular disease events occurred. Among the 3380 participants who were obese at baseline, 37.1% were metabolically healthy. Metabolically healthy obesity was associated with a 48% increased risk of cardiovascular disease (hazard ratio: 1.48; 95% confidence interval: 1.07–2.06) compared with the metabolically healthy non-obese group at baseline. Transition from metabolically healthy obesity to metabolically unhealthy obesity was associated with elevated cardiovascular disease risk with an odds ratio of 1.82 (95% confidence interval: 1.06–3.14) compared with metabolically healthy non-obesity throughout after adjustment. Even maintaining metabolically healthy obesity over time was associated with a higher risk of cardiovascular disease (odds ratio: 1.72; 95% confidence interval: 1.00–2.97).
Weight control and management of existing metabolic disorders should be prioritized in all obese population.
Introduction
Obesity has reached an epidemic level globally, contributing to a broad spectrum of cardiovascular diseases (CVDs) and other adverse health outcomes.1,2 The healthcare burden has continued to rise worldwide over the past decade, especially in China where obesity has increased at an estimated annual rate of 0.32% due to rapid economic development and the accompanying lifestyle changes.3 It is now a major public health concern that demands urgent attention.
A subgroup of obese patients displays a healthier metabolic phenotype, known as metabolically healthy obesity (MHO), and the extent to which this phenotype is associated with adverse CVD outcomes is controversial. In recent years, a growing collection of studies, including four meta-analyses4–7 and two large cohort studies,8,9 suggest that MHO relates to poor prognosis. Low-grade inflammation is present in MHO participants.10,11 The evidence of these studies implies MHO is not a benign condition, highlighting the necessity for further study of this phenotype.
It has been demonstrated that MHO status can change over time,12–14 and variability of CVD risk factors is a powerful tool for predicting adverse health outcomes.15 Several recent studies indicate that transitions in metabolic health and obesity status over time are associated with distinct CVD risks.16–19 However, this association has not been made clear for a Chinese population. As such, we performed this study to evaluate (a) the association between baseline MHO status and CVD incidence, and (b) the impact of transitions in metabolic and obese status from baseline to follow-up on CVD risk in a large general Chinese population.
Methods
Study population
The Northeast China Rural Cardiovascular Health Study (NCRCHS) is a community-based prospective cohort study conducted in rural areas of Northeast China. The study design has been described elsewhere.20,21 In brief, a total of 11,956 participants aged ≥35 years were recruited from Dawa, Zhangwu, and Liaoyang counties in Liaoning province between 2012–2013, using a multi-stage, randomly stratified cluster-sampling scheme. Detailed information was collected at baseline for each participant. In 2015 and 2017, participants were invited to attend a follow-up study. Cardiovascular examination was repeated in 2015, and incident CVD events collected in 2017–2018. Of the 11,956 subjects, 10,700 participants consented and were qualified for our follow-up study. A total of 10,349 participants completed at least one follow-up visit. The study was approved by the Ethics Committee of China Medical University (Shenyang, China). Written informed consent was obtained from all participants.
In the current analyses, we excluded participants with CVD at baseline (n=821) and participants with missing or abnormal data at either baseline or follow-up (n=2056). Data were therefore available for 7472 participants.
Study variables
At baseline, detailed information on demographic characteristics, dietary and lifestyle factors, and medical history was obtained by interview with a standardized questionnaire. Prior stroke and coronary heart disease (CHD) at baseline were self-reported and confirmed by medical records. Current use of antihypertensive medications, aspirin, or statins was self-reported. Blood pressure was assessed three times with participants seated after at least 5 min of rest using a standardized automatic electronic sphygmomanometer (HEM-907; Omron, Tokyo, Japan). The average of the three records was used for final analyses. Weight and height were measured with participants in lightweight clothing without shoes. Waist circumference (WC) was measured at the umbilicus using a non-elastic tape measure. Fasting blood samples were collected in the morning from participants who had fasted at least 12 h. Fasting plasma glucose, total cholesterol (TC), low-density lipoprotein cholesterol (LDL-C), high-density lipoprotein cholesterol (HDL-C), triglyceride (TG), uric acid, serum creatinine, and other routine blood biochemical indexes were analyzed automatically (Olympus AU 640, Tokyo, Japan). Body mass index (BMI) was calculated as weight in kilograms divided by the square of height in meters. Estimated glomerular filtration rate (eGFR) was calculated using the Chronic Kidney Disease Epidemiology Collaboration equation.22
Definitions of metabolic health and obesity status
Obesity was defined as BMI ≥ 25 kg/m2 according to Asia-Pacific criteria.23 Metabolic syndrome was evaluated by the following five components: (a) WC ≥ 85 cm for males and ≥ 80 cm for females, (b) blood pressure (BP) ≥ 130/85 mm Hg or current use of antihypertensive drugs, (c) serum glucose level ≥ 5.6 mmol/l or current use of antihyperglycemic agents, (d) serum TGs ≥ 1.7 mmol/l, and (e) serum HDL-C < 1.0 mmol/l for males and < 1.3 mmol/l for females, according to the harmonized International Diabetes Federation criteria.24 A metabolic health score was calculated as the total number of components for which the criterion was met, with a higher score therefore indicating worse metabolic health. Combining metabolic health and obesity status, we divided all participants into four groups: (a) metabolically healthy non-obesity (MHN), defined as BMI < 25 kg/m2 and metabolic health score < 3 points, (b) metabolically unhealthy non-obesity (MUN), defined as BMI < 25 kg/m2 and metabolic health score ≥ 3 points, (c) MHO was defined as BMI ≥ 25 kg/m2 and metabolic health score < 3 points, and (d) metabolically unhealthy obesity (MUO), defined as BMI ≥ 25 kg/m2 and metabolic health score ≥ 3 points. We generated these categories separately for baseline and follow-up to evaluate changes in metabolic health and obesity status for each individual.
Adjudication of endpoints
The median follow-up was 4.66 years. The outcome of the present study was CVD incidence. Incident CVD was defined as fatal and nonfatal stroke and CHD. The specific incidences of fatal cases, stroke and CHD were also determined. Stroke was defined per the World Health Organization Multinational Monitoring of Trends and Determinants in Cardiovascular Disease criteria25,26 as rapidly developing signs of focal or global disturbance of cerebral function, lasting more than 24 h (unless interrupted by surgery or death) with no apparent non-vascular cause. Transient ischemic attack and chronic cerebral vascular disease were excluded. CHD was defined as a diagnosis of hospitalized angina, hospitalized myocardial infarction, any revascularization procedure, or CHD death.27 For all participants reporting possible diagnoses or death, all available clinical information was collected including medical records and death certificates. All materials were independently reviewed and adjudicated by the endpoint assessment committee.
Statistical analysis
We then applied logistic regression to assess whether change in metabolic health or obesity status from baseline to follow-up was associated with higher risk of stroke, CHD, or CVD. In addition, we accessed the sensitivity of the results to use a different definition of metabolic syndrome and to adjust for white blood cell counts additionally. We evaluated the effects of changes in metabolic health or obesity status on cardiovascular events stratified by age and sex, with interaction tested. Fatal CVD was not included in subgroup analyses due to small number of events. All statistical analyses were performed using Stata/SE 14.0 (StataCorp, College Station, Texas, USA) and SPSS 23.0 (IBM Corporation, Chicago, Illinois, USA), with p values below 0.05 considered statistically significant.
Results
The characteristics of the participants are grouped according to metabolic health level and obesity status in Table 1. There were 860 participants with MUN (11.5%), 1255 with MHO (16.8%), and 2125 with MUO (28.4%). Among the 3380 obese participants, 37.1% were metabolically healthy. Metabolically unhealthy participants, both obese and non-obese, were older and presented a much worse risk profile, including higher lipid, glucose, blood pressure, and uric acid levels and lower eGFR. Compared with the MHN group, MHO participants were more likely to have elevated blood pressure, TC, TG, LDL-C, and uric acid levels. In addition to a worse metabolic index, MUO participants also had higher BMI than their MHO counterparts. Distribution of metabolic components by metabolic and obese status is presented in Supplementary Material eFigure 1. Abdominal obesity presented the highest proportion in MHO participants both at baseline and follow-up.
Baseline characteristics of the included participants according to combined metabolic and obese status (n = 7472).
| MHN (n = 3232) | MUN (n = 860) | MHO (n = 1255) | MUO (n = 2125) | p-Value | |
|---|---|---|---|---|---|
| Age (year) | 53 ± 10 | 56 ± 10 | 51 ± 9 | 54 ± 10 | <0.001 |
| Male (%) | 1623 (50.2) | 306 (35.6) | 602 (48.0) | 952 (44.8) | <0.001 |
| Ethnicity of Han (%) | 3058 (94.6) | 816 (94.9) | 1152 (91.8) | 1997 (94.0) | 0.003 |
| Current smoking (%) | 1318 (40.8) | 301 (35.0) | 397 (31.6) | 644 (30.3) | <0.001 |
| Current drinking (%) | 817 (25.3) | 179 (20.8) | 284 (22.6) | 483 (22.7) | 0.016 |
| Education ≥high school (%) | 311 (9.6) | 59 (6.9) | 128 (10.2) | 222 (10.4) | 0.022 |
| Family income >5000 CNY/year (%) | 2880 (89.1) | 750 (87.2) | 1155 (92.0) | 1921 (90.4) | 0.001 |
| Regular exercise (%) | 588 (18.2) | 204 (23.7) | 217 (17.3) | 521 (24.5) | <0.001 |
| Family history of CVD (%) | 784 (24.3) | 215 (25.0) | 337 (26.9) | 610 (28.7) | 0.003 |
| BMI (kg/m2) | 22.0 ± 1.9 | 23.1 ± 1.6 | 27.3 ± 2.6 | 28.3 ± 2.7 | <0.001 |
| WC (cm) | 75.0 ± 6.4 | 81.8 ± 6.8 | 85.6 ± 8.1 | 90.9 ± 7.4 | <0.001 |
| SBP (mm Hg) | 134.2 ± 20.7 | 148.8 ± 21.6 | 138.5 ± 22.3 | 150.6 ± 22.1 | <0.001 |
| DBP (mm Hg) | 78.7 ± 10.8 | 84.7 ± 11.8 | 81.0 ± 11.1 | 86.9 ± 11.2 | <0.001 |
| TC (mmol/l) | 5.1 ± 1.0 | 5.4 ± 1.2 | 5.2 ± 0.9 | 5.5 ± 1.2 | <0.001 |
| TG (mmol/l) | 1.1 ± 0.8 | 2.2 ± 1.8 | 1.2 ± 0.6 | 2.3 ± 1.9 | <0.001 |
| LDL-C (mmol/l) | 2.8 ± 0.7 | 3.0 ± 0.9 | 3.0 ± 0.8 | 3.2 ± 0.9 | <0.001 |
| HDL-C (mmol/l) | 1.5 ± 0.4 | 1.3 ± 0.3 | 1.5 ± 0.3 | 1.2 ± 0.3 | <0.001 |
| FPG (mmol/l) | 5.5 ± 1.1 | 6.4 ± 1.9 | 5.4 ± 0.8 | 6.4 ± 1.9 | <0.001 |
| Serum uric acid (μmol/l) | 271.3 ± 75.8 | 290.6 ± 82.4 | 281.3 ± 79.8 | 313.5 ± 87.1 | <0.001 |
| Estimated GFR (ml/min/1.73 m2) | 95.7 ± 14.4 | 89.9 ± 14.3 | 97.6 ± 13.4 | 91.8 ± 15.5 | <0.001 |
| Antihypertensive medication (%) | 186 (5.8) | 126 (14.7) | 119 (9.5) | 498 (23.4) | <0.001 |
| Statin use (%) | 1 (0.0) | 0 | 0 | 4 (0.2) | 0.151 |
| Aspirin use (%) | 14 (0.4) | 5 (0.6) | 8 (0.6) | 31 (1.5) | <0.001 |
BMI: body mass index; CNY: China Yuan; CVD: cardiovascular disease; DBP: diastolic blood pressure; FPG: fasting plasma glucose; GFR: glomerular filtration rate; HDL-C: high-density lipoprotein cholesterol; LDL-C: low-density lipoprotein cholesterol; MHN: metabolically healthy non-obesity; MHO: metabolically healthy obesity; MUN: metabolically unhealthy non-obesity; MUO: metabolically unhealthy obesity; SBP: systolic blood pressure; SD: standard deviation; TC: total cholesterol; TG: triglyceride; WC: waist circumference.
Data are expressed as mean ± SD or as n (%).
Over a median follow-up period of 4.66 years, a total of 344 CVD events occurred in the studied population (242 stroke cases and 113 CHD cases), including 72 fatal CVD cases. The Kaplan–Meier curves for each endpoint in participants with different metabolic level and obesity status are shown in Figure 1. Higher cumulative incidences of combined CVD were observed among participants with MUO, MHO, and MUN compared to those with MHN.
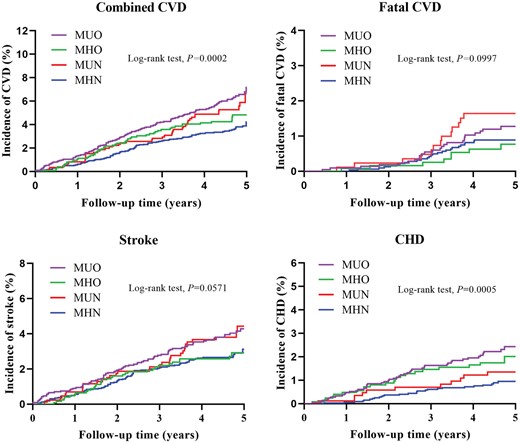
Unadjusted Kaplan–Meier curves for incident cardiovascular events stratified by baseline metabolic and obese status. CHD: coronary heart disease; CVD: cardiovascular disease; MHN: metabolically healthy non-obesity; MHO: metabolically healthy obesity; MUN: metabolically unhealthy non-obesity; MUO: metabolically unhealthy obesity.
Table 2 shows the multivariate-adjusted HRs of combined CVD, fatal CVD, stroke, and CHD incidence by metabolic level and obesity status. MHO was associated with a 48% increased risk of combined CVD (HR: 1.48; 95% CI: 1.07–2.06) and MUO a 58% increased risk (HR: 1.58; 95% CI: 1.21–2.07) compared with the MHN group after full adjustment. The HRs for CHD in the MHO and MUO groups were 2.56 (95% CI: 1.45–4.49) and 2.54 (95% CI: 1.54–4.20), respectively. Unhealthy and obese status was not significantly related to stroke or fatal CVD in the full adjustment model. The results were similar when white blood cell count was additionally adjusted (data not shown).
Multivariate-adjusted hazard ratios and 95% confidence intervals for cardiovascular outcomes associated with baseline metabolic and obese status.
| MHN | MUN | MHO | MUO | |
|---|---|---|---|---|
| Combined CVD | ||||
| n/N | 114/3232 | 46/860 | 55/1255 | 129/2125 |
| Model 1 | 1.00 (ref) | 1.27 (0.90–1.80) | 1.50 (1.09–2.08) | 1.72 (1.33–2.22) |
| Model 2 | 1.00 (ref) | 1.25 (0.89–1.77) | 1.55 (1.12–2.14) | 1.77 (1.37–2.29) |
| Model 3 | 1.00 (ref) | 1.16 (0.82–1.65) | 1.48 (1.07–2.06) | 1.58 (1.21–2.07) |
| Fatal CVD | ||||
| n/N | 26/3232 | 14/860 | 8/1255 | 24/2125 |
| Model 1 | 1.00 (ref) | 1.33 (0.69–2.58) | 1.00 (0.45–2.22) | 1.27 (0.73–2.23) |
| Model 2 | 1.00 (ref) | 1.30 (0.67–2.52) | 1.01 (0.46–2.26) | 1.29 (0.73–2.27) |
| Model 3 | 1.00 (ref) | 1.18 (0.60–2.32) | 0.98 (0.44–2.18) | 1.11 (0.61–2.02) |
| Stroke | ||||
| n/N | 88/3232 | 34/860 | 34/1255 | 86/2125 |
| Model 1 | 1.00 (ref) | 1.27 (0.85–1.90) | 1.24 (0.83–1.85) | 1.48 (1.10–2.01) |
| Model 2 | 1.00 (ref) | 1.25 (0.84–1.87) | 1.29 (0.87–1.93) | 1.54 (1.13–2.09) |
| Model 3 | 1.00 (ref) | 1.13 (0.75–1.69) | 1.23 (0.82–1.84) | 1.32 (0.96–1.83) |
| CHD | ||||
| n/N | 30/3232 | 13/860 | 23/1255 | 47/2125 |
| Model 1 | 1.00 (ref) | 1.30 (0.67–2.52) | 2.55 (1.46–4.45) | 2.46 (1.53–3.96) |
| Model 2 | 1.00 (ref) | 1.26 (0.65–2.44) | 2.56 (1.47–4.48) | 2.48 (1.54–3.99) |
| Model 3 | 1.00 (ref) | 1.28 (0.65–2.50) | 2.56 (1.45–4.49) | 2.54 (1.54–4.20) |
CHD: coronary heart disease; CVD: cardiovascular disease; MHN: metabolically healthy non-obesity; MHO: metabolically healthy obesity; MUN: metabolically unhealthy non-obesity; MUO: metabolically unhealthy obesity.
Model 1: adjusted for age, sex and ethnicity. Model 2: adjusted for factors in model 1 and current smoking, current drinking, education, family income, regular exercise, and family history of cardiovascular disease. Model 3: adjusted for factors in model 2 and estimated glomerular filtration rate, low-density lipoprotein cholesterol, uric acid, statin use and aspirin use.
Among the five common metabolic risk factors, high blood pressure contributed most to population CVD risk, followed by hyperglycemia and low HDL-C (Supplementary Material eTable 1). Abdominal obesity and high blood pressure attenuated the association between general obesity defined by Asia-Pacific criteria and combined CVD by 14.6% and 12.5%, respectively (Supplementary Material eTable 2). General obesity per se related more to CHD than stroke, while metabolic markers attenuated more of the association between general obesity and stroke than CHD (32% vs 16.1%).
Among the 1255 participants who were MHO at baseline, 500 (39.8%) maintained this status and 409 (32.6%) changed to MUO during the follow-up period (Supplementary Material eTable 3). Participants who changed from MHO to MUO presented worse metabolic profile at baseline compared with those who remained MHO over the follow-up period. High TG contributed most to the transition from MHO to MUN or MUO (Supplementary Material eFigure 2). Crude incidence rates of cardiovascular events by different transition patterns are shown in Supplementary Material eFigure 3. MHN participants who developed into MUN, MHO, or MUO had higher incidence of combined and fatal CVD compared with those who maintained MHN status. Those who remained MHO or changed to MUO exhibited a higher incidence of combined CVD, stroke and CHD than MHN participants throughout.
The shift from MHO to MUO was independently associated with elevated CVD risk, with an odds ratio (OR) of 1.82 (95% CI: 1.06–3.14) compared with MHN throughout after full adjustment (Figure 2). Even remaining MHO over time was associated with higher risks of combined CVD (OR: 1.72; 95% CI: 1.00–2.97). MUO from baseline to follow-up was associated with the highest risks of combined CVD, stroke and CHD compared with MHN throughout. Similar results were observed when white blood cell count was additionally adjusted (Table 3). Using a definition of ≥ 1 component for metabolic syndrome produced insignificant results, noticing the sample size is small with only 0.7% (55 out of 7472) of participants categorized as MHO at baseline. Subgroup analysis shows that these associations were more profound in males and in participants aged ≤60 years. However, interaction analysis produced no evidence of significant heterogeneity (p > 0.05).
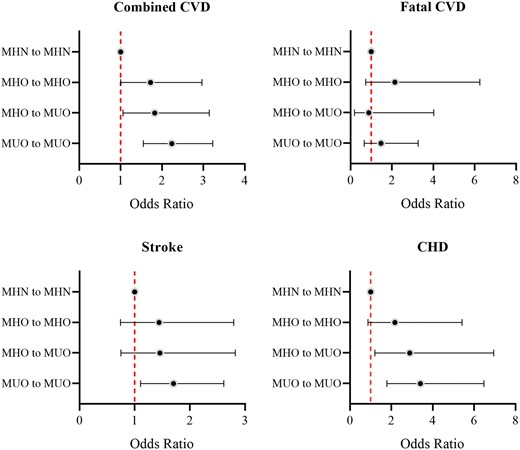
Association between transition patterns of metabolically healthy obesity (MHO) and cardiovascular events (odds ratios and 95% confidence intervals). CHD: coronary heart disease; CVD: cardiovascular disease; MHN: metabolically healthy non-obesity; MUO: metabolically unhealthy obesity.
Subgroup analyses for cardiovascular outcomes by transition patterns of metabolic and obese status.
| Metabolic and obese status | Combined CVD | Stroke | CHD | ||||
|---|---|---|---|---|---|---|---|
| OR | 95% CI | OR | 95% CI | OR | 95% CI | ||
| Adjustment for white blood cell counts | |||||||
| MHN to MHN | 1.00 (ref) | 1.00 (ref) | 1.00 (ref) | ||||
| MHO to MHO | 1.82 | 1.05–3.14 | 1.55 | 0.79–3.01 | 2.30 | 0.92–5.78 | |
| MHO to MUO | 1.91 | 1.10–3.30 | 1.56 | 0.80–3.03 | 3.01 | 1.24–7.31 | |
| MUO to MUO | 2.30 | 1.58–3.34 | 1.82 | 1.18–2.83 | 3.47 | 1.78–6.75 | |
| Metabolic syndrome as ≥1 component | |||||||
| MHN to MHN | 1.00 (ref) | 1.00 (ref) | 1.00 (ref) | ||||
| MHO to MHO | – | – | – | ||||
| MHO to MUO | 2.56 | 0.27–24.2 | 5.26 | 0.45–61.95 | – | ||
| MUO to MUO | 2.91 | 1.05–8.08 | 3.43 | 0.82–14.36 | 2.55 | 0.60–10.84 | |
| Sex | |||||||
| Male | MHN to MHN | 1.00 (ref) | 1.00 (ref) | 1.00 (ref) | |||
| MHO to MHO | 2.13 | 1.02–4.43 | 1.73 | 0.72–4.20 | 2.72 | 0.76–9.71 | |
| MHO to MUO | 2.05 | 0.99–4.27 | 2.1 | 0.96–4.86 | 1.36 | 0.27–6.79 | |
| MUO to MUO | 2.81 | 1.68–4.67 | 2.47 | 1.38–4.40 | 3.21 | 1.23–8.39 | |
| Female | MHN to MHN | 1.00 (ref) | 1.00 (ref) | 1.00 (ref) | |||
| MHO to MHO | 1.45 | 0.64–3.29 | 1.20 | 0.44–3.28 | 1.94 | 0.51–7.42 | |
| MHO to MUO | 1.61 | 0.71–3.68 | 0.72 | 0.21–2.51 | 4.78 | 1.61–14.17 | |
| MUO to MUO | 1.84 | 1.07–3.15 | 1.08 | 0.56–2.10 | 3.76 | 1.59–8.92 | |
| p Value for interaction | 0.126 | 0.061 | 0.722 | ||||
| Age | |||||||
| ≤60 years | MHN to MHN | 1.00 (ref) | 1.00 (ref) | 1.00 (ref) | |||
| MHO to MHO | 3.49 | 1.15–10.57 | 1.84 | 0.78–4.35 | 2.33 | 1.18–4.60 | |
| MHO to MUO | 3.55 | 1.10–11.49 | 1.88 | 0.76–4.67 | 2.36 | 1.15–4.85 | |
| MUO to MUO | 5.40 | 2.18–13.34 | 1.95 | 1.01–3.76 | 2.92 | 1.72–4.96 | |
| >60 years | MHN to MHN | 1.00 (ref) | 1.00 (ref) | 1.00 (ref) | |||
| MHO to MHO | 0.83 | 0.10–6.93 | 1.17 | 0.39–3.55 | 1.18 | 0.43–3.22 | |
| MHO to MUO | 2.79 | 0.68–11.49 | 0.98 | 0.36–2.65 | 1.25 | 0.52–2.98 | |
| MUO to MUO | 1.81 | 0.68–4.84 | 1.35 | 0.75–2.41 | 1.56 | 0.92–2.64 | |
| p Value for interaction | 0.59 | 0.186 | 0.666 | ||||
CHD: coronary heart disease; CI: confidence interval; CVD: cardiovascular disease; MHN: metabolically healthy non-obesity; MHO: metabolically healthy obesity; MUO: metabolically unhealthy obesity; OR: odds ratio.
All analyses adjusted for age, sex and ethnicity, current smoking, current drinking, education, family income, regular exercise, family history of cardiovascular disease, estimated glomerular filtration rate, low-density lipoprotein cholesterol, uric acid, statin use, and aspirin use.
Discussion
For this general Chinese population of over 7000 participants, we found that the MHO phenotype was prevalent among those in the obese Chinese population. Individuals who were obese but metabolically healthy at baseline were nonetheless associated with an increased risk for CVD compared with metabolically healthy, non-obese individuals (Figure 3). Participants who transitioned from MHO to MUO had higher risk of CVD than MHN throughout, although lower than that of those who started and remained MUO. Even remaining MHO was associated with a higher CVD risk.
Association of baseline metabolic health and obesity status and its transition with cardiovascular disease (CVD) risk in 7472 Chinese participants. Models adjusted for age, sex, ethnicity, current smoking, current drinking, education, family income, regular exercise, family history of cardiovascular disease, estimated glomerular filtration rate, low-density lipoprotein cholesterol, uric acid, statin use, and aspirin use. In this study, we found metabolically healthy but obese patients who had fewer metabolic abnormities had higher CVD risk compared with the metabolically healthy non-obese group. Transition from metabolically healthy obesity (MHO) to metabolically unhealthy obesity (MUO) or even maintaining MHO over time was independently associated with elevated CVD risk. MHN: metabolically healthy non-obesity; MUN: metabolically unhealthy non-obesity.
There is controversy regarding the adverse prognoses associated with the MHO phenotype, and a number of studies have sought to end the debate over the past few years.4–9,30–32 In a cohort of 3.5 m adults, Caleyachetty et al. found that obese individuals with no observed metabolic abnormalities had higher risks of CHD, cerebrovascular disease, and heart failure than their normal-weight counterparts.8 These findings were echoed by another large cohort study of over 17,000 participants using a definition of ≥ 3 components for the metabolic unhealthy.30 A recent meta-analysis including 43 studies showed that MHO was associated with higher adjusted risks of CVD and all-cause mortality, and a significant linear dose-response relationship between BMI and CVD risk was observed within metabolically healthy individuals.4 Two studies conducted among the Chinese population drew a similar conclusion.31,32 Our results are consistent with these previous findings, supporting the conclusion that MHO is not a benign condition.
The variation in metabolic risk factors over time has been emphasized as both a powerful predictor of, and an intervention target for, CVD outcomes.15 MHO is a transient phenotype,12–14,19 highlighting the importance of studying the impact of its transition patterns on CVD risk. Both MESA and ATTICA studies found that transition from MHO to MUO carries an increased risk of CVD compared with an MHN reference group.16,17 Moreover, a large cohort study conducted among female nurses showed that even remaining MHO carries a higher CVD risk compared with women of stable healthy normal weight, although metabolic conditions including diabetes, hypertension, and hypercholesterolemia were self-reported.19 Notably, these three cohort studies conducted in Western populations used BMI ≥ 30 kg/m2 for obesity definition. In a Korean cohort, Cho et al. found that CVD risk was increased in participants who transitioned from MHO to MUO compared with those who remained MHO. They used the same Asia-Pacific criteria (BMI ≥ 25 kg/m2) as in our study. However, the results were based on health insurance data, with metabolic conditions and endpoints identified by diagnostic codes.18 Our study was conducted in a general Chinese population with reliable measurement of variables and outcomes. We found that both stable MHO and transition to a metabolically unhealthy phenotype cause adverse CVD outcomes in the Chinese population.
A higher CVD risk was even observed in participants who remained MHO over time in the present study. Previous studies suggested that MHO participants had higher prevalence of subclinical carotid and coronary atherosclerosis.33,34 This process even began in children and adolescents.35 Circulating proinflammatory monocyte counts and high-sensitivity C-reactive protein were already elevated in MHO individuals.10,11 The relationship between MHO per se and its cumulative exposure to CVD risk might be partially explained by these early atherosclerotic changes and inflammatory state. As found in our study and in previous research, the CVD risk was even higher when MHO transitioned to MUO with additional unhealthy metabolic components. This supports the idea that there is a pathway from obesity to metabolically unhealthy status to CVD events. Pathogenic change of adipocytes might be the source of these downstream effects.36 Over 80% of MHO participants converted to MUO after 20 years.19 It is therefore essential to control obesity in the first place to prevent CVD.
Consistent with previous studies,37,38 we found the contribution of each metabolic component to cardiovascular outcomes was different. All five components explained 23% of the association between general obesity defined as BMI ≥ 25 kg/m2 and total CVD risk, which is lower compared with that in a Western population.16 Interestingly, we found general obesity per se related more to CHD than stroke, while metabolic markers explained more of the association between general obesity and stroke than CHD. Caleyachetty et al. also observed a higher risk of CHD than stroke in obese individuals with no metabolic abnormalities.39 Similar to our results, stroke incidence was much higher in MUN individuals compared with the MHO group in a national population of Korea.40 Further studies are expected to explore the underlying mechanisms of the different associations between metabolic and obese status and specific outcomes.
Our study has several limitations. First, the number of events in this study was small, especially for fatal CVD, which might limit the interpretation of the results. Second, to further clarify the impacts of obese and metabolic status separately, we used a stricter definition of metabolic health as the absence of all five components in sensitivity analyses, but the small sample size of MHO group might compromise the results. Third, although we adjusted for CVD risk factors, there might be residual confounding. In addition, we focused on the Chinese population, using an Asia-Pacific criteria as BMI ≥ 25 kg/m2 and thus our results might not be generalizable to Western populations.
In conclusion, in this population-based study with directly measured metabolic components, we found that metabolically healthy but obese patients who had fewer metabolic abnormities were prevalent in the obese population. CVD risk was higher in this subgroup, even when relative metabolic health was maintained. However, deterioration in metabolic status was associated with a much higher CVD risk. Our findings highlight at the population level the importance of weight control and the management of existing metabolic disorders.
Supplementary material
Supplementary material is available at European Journal of Preventive Cardiology online.
Author contribution
ZL and YS contributed to the conception or design of the work. XG, YZ, SY, HY, GS, and LZ contributed to the acquisition, analysis, or interpretation of data for the work. XG drafted the manuscript. JA and YL critically revised the manuscript. All gave final approval and agree to be accountable for all aspects of work ensuring integrity and accuracy.
Declaration of conflicting interests
The author(s) declared no potential conflicts of interest with respect to the research, authorship, and/or publication of this article.
Funding
The author(s) disclosed receipt of the following financial support for the research, authorship, and/or publication of this article: This research was supported by funds from the National Natural Science Foundation of China (Grant # 81800361), the National Key Research and Development Program from the Ministry of Science and Technology of China (Project Grant # 2017YFC1307600 and 2018YFC1312400) and Liaoning Science and Technology Project (Grant # 2017107001).
References
World Health Organization. Regional Office for the Western Pacific. The Asia-Pacific perspective: Redefining obesity and its treatment, https://apps.who.int/iris/handle/10665/206936 (2000, accessed 5 January
WHO MONICA project. MONICA manual, URN:NBN:fi-fe 19981147, https://www.thl.fi/publications/monica/index.html (1990, accessed 5 January

Comments