


Cardiac involvement in patients with systemic sclerosis (SSc) is frequent and represents a negative prognostic factor. Recent studies have described subclinical heart involvement of both the right ventricle (RV) and left ventricle (LV) via speckle-tracking-derived global longitudinal strain (GLS). It is currently unknown if SSc-related cardiomyopathy progresses through time. Our aim was to assess the progression of subclinical cardiac involvement in patients with SSc via speckle-tracking-derived GLS.
This was a prospective longitudinal study enrolling 72 consecutive patients with a diagnosis of SSc and no structural heart disease nor pulmonary hypertension. A standard echocardiographic exam and GLS calculations were performed at baseline and at follow-up.
Traditional echocardiographic parameters did not differ from baseline to 20-month follow-up. LV GLS, despite being already impaired at baseline, worsened significantly during follow-up (from –19.8 ± 3.5% to –18.7 ± 3.5%, p = .034). RV GLS impairment progressed through the follow-up period (from –20.9 ± 6.1% to –18.7 ± 5.4%, p = .013). The impairment was more pronounced for the endocardial layers of both LV (from –22.5 ± 3.9% to –21.4 ± 3.9%, p = .041) and RV (–24.2 ± 6.2% to –20.6 ± 5.9%, p = .001). A 1% worsening in RV GLS was associated with an 18% increased risk of all-cause death or major cardiovascular event (p = .03) and with a 55% increased risk of pulmonary hypertension (p = .043).
SSC-related cardiomyopathy progresses over time and can be detected by speckle-tracking GLS. The highest progression towards reduced deformation was registered for the endocardial layers, which supports the hypothesis that microvascular dysfunction is the main determinant of heart involvement in SSc patients and starts well before overt pulmonary hypertension.
Introduction
Systemic sclerosis (SSc) is a progressive autoimmune disease of unknown aetiology affecting the skin and internal organs.1 The pathogenesis of SSc is characterized by small vessel vasculopathy, autoantibodies production and exaggerated extracellular matrix deposition, leading to extensive tissue fibrosis.2,3 Cardiac involvement in patients with SSc is frequent and represents a negative prognostic factor when clinically evident.4 In fact, mortality of SSc patients with heart involvement is up to 70% at five years, with 28% of patients’ deaths related to cardiac complications such as pulmonary hypertension, heart failure and arrhythmias.5,6
The majority of cardiac involvement in patients with SSc is often subclinical, especially in the early stages.4,7 While it is widely known that SSc can lead to pulmonary arterial hypertension8 and subsequently cor pulmonale, detection of subclinical cardiac involvement is still a major issue due to the scarce sensitivity of the conventional diagnostic tools. Nonetheless, newer non-invasive techniques of myocardial deformation detection, such as speckle-tracking-derived global longitudinal strain (GLS), have shown promising results in identifying subclinical heart involvement of both the right ventricle (RV) and left ventricle (LV).9,–11 GLS can highlight cardiac involvement much earlier than the commonly used echocardiographic parameters while overcoming many technical and operator-dependent issues.9,–11 Microvascular disease is believed to play an important role in the pathogenesis of this condition,7 as it leads to hypoperfusion, hypoxia and subsequent fibrosis, which can be distributed over both ventricles regardless of coronary artery supply.12,13 Moreover, the idea of a specific form of a SSc-related condition primarily and globally affecting the heart (the so-called SSc-related cardiomyopathy) is catching on in current literature.3,10,14 Whether such a form of subclinical cardiac disease remains a bystander of SSc or progresses through time is still unclear.
Therefore, the aim of our study was to assess the progression of subclinical biventricular cardiac involvement in patients with SSc via speckle-tracking-derived GLS.
Methods
Study population
We conducted a prospective longitudinal study enrolling all consecutive patients with a diagnosis of SSc referred to the Clinica Medica, University Hospital ‘Ospedali Riuniti’, Ancona, Italy between February 2016 and December 2018. All patients met the American College of Rheumatology/European League Against Rheumatism classification criteria for SSc criteria2 and were eligible for inclusion in the absence of the following exclusion criteria: structural heart disease, heart failure with reduced or preserved ejection fraction, moderate or severe valve disease or valve replacement or repair, ischaemic heart disease, previous episodes of deep-vein thrombosis or pulmonary embolism, malignancy and pulmonary hypertension as defined by the European Society of Cardiology guidelines.8
Patients were subdivided as having limited cutaneous or diffuse cutaneous SSc based on the extent of their skin involvement.15
The study was carried out according to institutional standards, national legal requirements and the Declaration of Helsinki. Informed consent was obtained by all patients. Being an observational study, approval of the ethics committee was not sought. The present paper was designed, conducted and reported according to the STROBE initiative (Supplementary Table 1).16
Data collection
A dedicated website was used according to national regulation on personal data treatment. Clinical history and physical examination were collected for all patients enrolled. The 10-year risk of fatal cardiovascular disease was calculated according to the SCORE chart for countries at low risk.17 Autoantibody profiles, disease duration and level of skin fibrosis were registered as well as data related to patients’ medical treatment. Skin fibrosis was evaluated by the Rodnan modified skin score, which was performed by one experienced assessor.18,19 In order to define disease activity in patients with SSc, the European Scleroderma Trials and Research group revised activity criteria for SSc using the multinational database. A cut-off ≥2.5 has been established to identify patients with active illness.20 Oesophageal involvement was assessed via video fluorography21 and computed tomography (CT). Pulmonary involvement was assessed via CT and diffusion lung carbon monoxide measurement. Patients with high probability of pulmonary hypertension at echocardiogram were managed according to current guidelines.8 All diagnoses of pulmonary hypertension were confirmed by right heart catheterization and vasoreactivity test, and classified into five possible types according to the guidelines’ clinical classification and haemodynamic definitions.8
Echocardiography and speckle-tracking-derived measurements
Two operators (GS and FG) were responsible for performing all echocardiographic examinations and for evaluating bidimensional, Doppler and speckle-tracking parameters according to current guidelines.22 A monoplane ultrasound probe 4 MHz of Vivid E 65 (GE Medical Systems, Milwaukee, USA) was used for all echocardiographic examinations. Digital loops, obtained with the patient supine and in left lateral decubitus, were captured and then analysed using an off-line dedicated software (EchoPAC 13.0; GE Medical Systems, Milwaukee, USA).23 Methods to assess echocardiographic parameters were previously described.10 Feasibility of the frame-to-frame tracking technique was obtained by setting the frame rate of digital loops for speckle-tracking analysis between 60 and 80 fps. GLS of LV and RV was assessed using the speckle-tracking analysis software (EchoPAC 13.0; GE Medical Systems, Milwaukee, USA).24 The interventricular septum was excluded from right ventricular GLS calculations.25,26 Intra-observer reproducibility was 2.4% and inter-observer reproducibility was 3.2%. Strain feasibility was 95.3%, with 5.3% of all segments excluded at base, 4.2% excluded at papillary level and 4.6% excluded at the apex. Reproducibility and feasibility values were comparable to what has already been published.27
Cardiac magnetic resonance (CMR)
In order to further evaluate the pathophysiology behind cardiac involvement, the five patients with the best LV GLS values and the five with the worst values underwent CMR. Two operators (MF and NS), blinded to the patients’ characteristics and GLS values, performed the examination.
A 1.5 Tesla magnetic resonance imaging scanner (Achieva, Philips Healthcare, The Netherlands) was used for acquisitions. Signals were received via a 32-channel phased array cardiac coil. A four-lead vector electrocardiogram was used for R-wave triggering. A balanced steady-state free precession sequence with breath hold was acquired in the long-axis, two-chambers and four-chambers views, as well as a short-axis stack. This was used for volumetric as well as functional analysis.28 Late gadolinium enhancement (LGE) images were obtained 10 minutes after intravenous administration of gadoteridol (ProHance, Bracco, Milan, Italy). The dose was 0.2 ml/Kg at a 4.0 ml/s, followed by flushing 20 ml of saline at 4.0 ml/s. A segmented phase-sensitive inversion recovery turbo fast low-angle shot at the same position as cine imaging in end diastole was used. Myocardial scarring was defined as enhanced myocardium in the LGE short-axis image sequence (>5 standard deviations (SDs) above the intensity of normal myocardium).
Diastolic and systolic volumes and masses were calculated for both LV and RV. All values obtained were indexed according to body surface area. Location and pattern of LGE were assessed by two operators blinded to the clinical and GLS characteristics of the patients. In order to estimate the volume of an enhancing segment (volume percentage index, VPI) the thickness of the enhancement was multiplied by its length on the short-axis sequence. The product was multiplied by the percentage of the extension in the longitudinal dimension in the same segment on a second plane. By adding all VPIs obtained, total VPI (TVPI) was calculated.13
Statistical analysis
The Kolmogorov–Smirnov test was used to assess normality of quantitative variables. Normally distributed variables were described as mean and SD. Non-normally distributed variables were described as median and first quartile to third quartile. Analysis of variance (ANOVA) was used to compare normally distributed quantitative variables. Kruskal–Wallis ANOVA was used to compare non-normally distributed quantitative variables. ANOVA for repeated measurements was used to assess time-dependent changes in selected variables between baseline and follow-up. Different antibodies profiles, diffuse or limited variants, presence of active disease and lung and oesophageal involvement were used in order to test for interactions in GLS progression. Categorical variables were described as absolute or relative prevalence and assessed by chi-square analysis or Fisher’s exact value. According to the sample size calculation, it was estimated that 72 subjects would be needed (α = 0.05, power = 0.8) in order to detect a difference in GLS of 1% between baseline and follow-up, considering a SD of 2.5 and a two-tailed test for repeated measures.10 SPSS 21.0 for Windows (SPSS Inc., Chicago, IL, USA) and R (R Foundation for Statistical Computing, Vienna, Austria) were used for statistical analysis. Values of p < .05 (two-tailed) were considered as statistically significant.
Results
General characteristics
Seventy-two patients were consecutively enrolled during a median follow-up of 20 months (first–third quartile, 12–24 months). The baseline characteristics are shown in Table 1. Sixty-one (87.1%) patients were female and the mean age was 56.6 ± 15.4 years.
Baseline characteristics of the population.
| Total population (n = 72) | Limited variant (n = 50) | Diffuse variant (n = 22) | p-value between limited and diffuse variant | |
|---|---|---|---|---|
| Age (years), mean ± SD | 56.6 ± 15.4 | 57.1 ± 15.0 | 54.9 ± 16.9 | .598 |
| Female gender, n (%) | 61 (87.1) | 44 (89.8) | 17 (81.0) | .311 |
| Hypertension, n (%) | 18 (25.7) | 13 (26.5) | 5 (23.8) | .811 |
| Diabetes mellitus, n (%) | 4 (5.7) | 4 (8.2) | 0 (0) | .178 |
| Dyslipidaemia, n (%) | 8 (11.4) | 6 (12.2) | 2 (9.5) | .743 |
| Smoking habit, n (%) | 8 (11.4) | 6 (12.2) | 2 (9.5) | .743 |
| Heart rate (bpm), mean ± SD | 76.7 ± 23.9 | 76.9 ± 11.7 | 77.1 ± 10.8 | .245 |
| BMI (kg/m2) | 23.9 ± 4.6 | 24.4 ± 4.9 | 22.7 ± 3.8 | .162 |
| BNP (pg/ml), median (1st–3rd quartile) | 44 (19–95) | 38 (21–96) | 76 (19–95) | .452 |
| Creatinine (mg/dl), mean ± SD | 0.8 ± 0.2 | 0.8 ± 0.3 | 0.7 ± 0.2 | .030 |
| ACE-inhibitors, n (%) | 9 (12.9) | 6 (12.2) | 3 (14.3) | .815 |
| Angiotensin-receptor blockers, n (%) | 6 (8.6) | 6 (12.2) | 0 (0) | .094 |
| Beta-blockers, n (%) | 4 (5.7) | 4 (8.2) | 0 (0) | .178 |
| Calcium channel blockers, n (%) | 27 (38.6) | 22 (44.9) | 5 (23.8) | .097 |
| Statins, n (%) | 7 (10.0) | 6 (12.2) | 1 (4.8) | .339 |
| Years from diagnosis to enrolment, median (1st–3rd quartile) | 7.0 (2.8–12.1) | 7.2 (2.7–15.0) | 5.0 (2.1–11.0) | .586 |
| ANA+, n (%) | 66 (94.3) | 47 (95.9) | 19 (90.5) | .369 |
| Scl70+, n (%) | 31 (44.3) | 19 (38.8) | 12 (57.1) | .156 |
| ACA+, n (%) | 19 (27.1) | 17 (34.3) | 2 (9.5) | .030 |
| DLCO | .805 | |||
| Mildly impaired, n (%) | 27 (38.6) | 19 (38.8) | 8 (38.1) | |
| Moderately impaired, n (%) | 19 (27.1) | 12 (24.5) | 7 (33.3) | |
| Severely impaired, n (%) | 8 (11.4) | 5 (10.2) | 3 (14.3) | |
| Oesophageal involvement, n (%) | 42 (60.0) | 25 (51.0) | 17 (81.0) | .019 |
| Micophenolate, n (%) | 11 (15.7) | 5 (23.8) | 6 (12.2) | .223 |
| Prostanoids i.v., n (%) | 36 (51.4) | 23 (46.9) | 13 (61.9) | .251 |
| Glucocorticoids, n (%) | 15 (21.4) | 8 (16.3) | 7 (33.3) | .112 |
ACA: anti-centromere antibodies; ANA: anti-nuclear antibodies; ACE: angiotensin converting enzyme; BMI: body mass index; BNP: brain natriuretic peptide; DLCO: diffusion lung carbon monoxide; SD: standard deviation; Scl70: anti-topoisomerase I antibodies.
Echocardiographic parameters of systolic and diastolic function
Conventional echocardiographic parameters (Table 2) did not differ from baseline to follow-up and were all within normal range (Simpson’s biplane ejection fraction 66.0 ± 7.7 vs 64.6 ± 6.8, tricuspid annulus plane systolic excursion 22.3 ± 4.3 vs 21.8 ± 3.9, fractional area change 50.0 ± 12.3 vs 53.0 ± 12.4, all p were non-significant). The only statistically relevant change was registered for the values of LV filling pressures (E/E’), which significantly increased from baseline to follow-up (6.6 ± 2.5 vs 7.9 ± 2.7, p < .001).
Echocardiographic parameters of systolic and diastolic function.
| Baseline | Follow-up | p-value | |
|---|---|---|---|
| Left ventricle | |||
| EDV (ml/m2) | 67.4 ± 10.5 | 65.1 ± 11.6 | .060 |
| ESV (ml/m2) | 26.6 ± 6.9 | 25.9 ± 6.9 | .399 |
| EF (%) | 66.0 ± 7.7 | 64.6 ± 6.8 | .120 |
| E/A | 1.0 ± 0.4 | 1.0 ± 0.3 | .149 |
| E/E’ | 6.6 ± 2.5 | 7.9 ± 2.7 | <.001 |
| Right ventricle | |||
| Basal diameter (mm) | 34.3 ± 0.8 | 34.4 ± 8 | .962 |
| RVOT diameter (mm) | 29.9 ± 0.9 | 30.9 ± 0.8 | .110 |
| TAPSE (mm) | 22.3 ± 4.3 | 21.8 ± 3.9 | .362 |
| S’ (m/s) | 0.15 ± 0.04 | 0.15 ± 0.04 | .343 |
| FAC (%) | 50.0 ± 12.3 | 53.0 ± 12.4 | .133 |
| E/A | 1.1 ± 0.4 | 1.1 ± 0.4 | .960 |
| E/E’ | 3.6 ± 1.7 | 3.4 ± 1.3 | .607 |
| sPAP (mmHg) | 29.2 ± 12.2 | 28.4 ± 11.1 | .533 |
All volumes are indexed by body surface area.
EDV: end-diastolic volume; EF: ejection fraction; ESV: end-systolic volume; FAC: fractional area change; RVOT: right ventricular outflow tract; sPAP: systolic pulmonary arterial pressure; TAPSE: tricuspid annulus plane systolic excursion.
GLS
LV GLS was already impaired at baseline and worsened significantly during follow-up (from –19.8 ± 3.5% to –18.7 ± 3.5%, p = .034). Additionally, RV GLS impairment progressed through the follow-up period (from –20.9 ± 6.1% to –18.7 ± 5.4%, p = .013). LV and RV GLS progressions through the 20-month follow-up are shown in Figure 1. Although both LV and RV showed a homogenous impairment throughout all layers of the myocardium, the highest progression towards reduced deformation was demonstrated in the endocardial layers of both chambers (Figure 2).
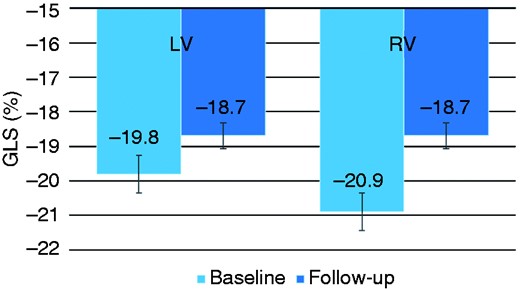
Global longitudinal strain at baseline and at follow-up.
GLS: global longitudinal strain; LV: left ventricle; RV: right ventricle.
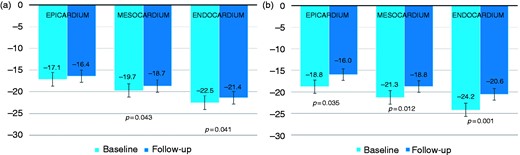
Global longitudinal strain according to myocardial layers for both left ventricle (a) and right ventricle (b).
GLS: global longitudinal strain.
Figure 3 shows GLS values at follow-up for all 18 myocardial segments and all three right segments examined. GLS progression rate was not influenced by the SSc subset variants, disease activity, autoantibodies and the presence of oesophageal or lung involvement (Figure 4). Also, ongoing therapy with mycophenolate, prostanoids or glucocorticoids provided no significant interactions with GLS progression of both ventricles (all p were non-significant; Figure 5). Among cardiovascular risk factors and cardiovascular drugs, diabetes mellitus is the only one to significantly interact with LV GLS progression in our population (Figure 6).
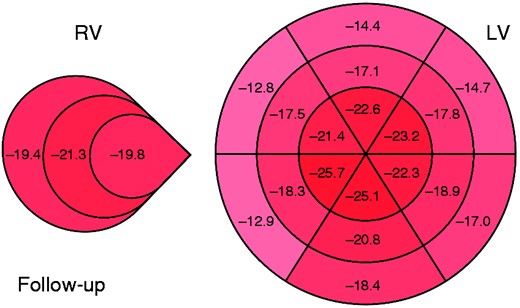
Mean global longitudinal strain score of patients with systemic sclerosis for each ventricular wall segment at follow-up.
LV: left ventricle; RV: right ventricle.
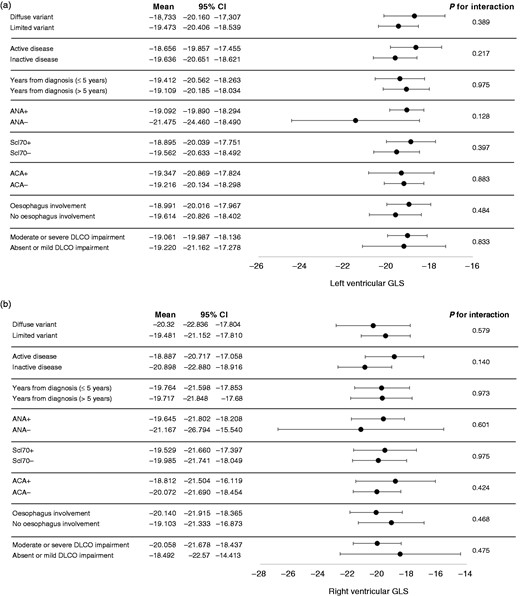
Interaction analyses between clinical variables of systemic sclerosis and global longitudinal strain for both left ventricle (a) and right ventricle (b).
ACA: anti-centromere antibodies; ANA: anti-nuclear antibodies; DLCO: diffusion lung carbon monoxide; GLS: global longitudinal strain; Scl70: anti-topoisomerase I antibodies; CI: confidence interval.
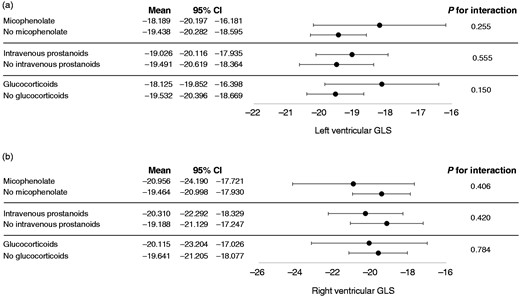
Interaction analyses between systemic sclerosis therapy and global longitudinal strain for both left ventricle (a) and right ventricle (b).
CI: confidence interval; GLS: global longitudinal strain.
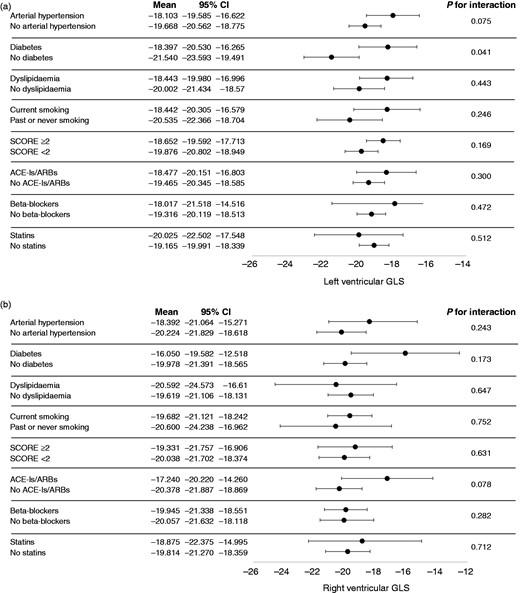
Interaction analyses between cardiovascular risk factors, therapy and global longitudinal strain for both left ventricle (a) and right ventricle (b).
CI: confidence interval; GLS: global longitudinal strain.
CMR
No differences were seen in terms of volumes, ejection fraction, stroke volumes and masses between patients with the best GLS and the worst GLS (Table 3). Moreover, these values were all within normal range in both groups for both the LV and RV. Mild LGE was observed in two patients with the best GLS and in three patients with the worst GLS (p = .527). LGE pattern was most commonly sub-endocardial and mean TVPI was 0.7 in the best GLS group and 1.5 in the worst GLS group (p = .704).
Cardiac magnetic resonance data regarding the five patients with the best left ventricular global longitudinal strain and the five patients with the worst left ventricular global longitudinal strain.
| Best GLS (n = 5) | Worst GLS (n = 5) | p-value | |
|---|---|---|---|
| Left ventricle | |||
| EDV (ml/m2) | 67.9 ± 12.1 | 63.1 ± 17.3 | .639 |
| ESV (ml/m2) | 29.6 ± 7.5 | 24.4 ± 6.7 | .314 |
| SV (ml/m2) | 43.6 ± 5.8 | 40.2 ± 11.1 | .575 |
| EF (%) | 60 ± 4 | 63 ± 4 | .319 |
| EDM (g/m2) | 44.8 ± 8.0 | 51.5 ± 15.5 | .428 |
| ESM (g/m2) | 44.6 ± 7.8 | 51.8 ± 15.4 | .389 |
| Right ventricle | |||
| EDV (ml/m2) | 56.4 ± 20.2 | 62.4 ± 15.0 | .625 |
| ESV (ml/m2) | 24.3 ± 10.1 | 24.0 ± 5.1 | .957 |
| SV (ml/m2) | 43.3 ± 6.8 | 40.8 ± 13.1 | .790 |
| EF (%) | 63 ± 4 | 63 ± 2 | .932 |
| EDM (g/m2) | 28.1 ± 10.1 | 22.9 ± 5.3 | .388 |
| ESM (g/m2) | 28.1 ± 10.6 | 22.4 ± 5.1 | .360 |
| LGE (n,%) | 2 (40%) | 3 (60%) | .527 |
| TVPI (%) | 0.7 ± 0.3 | 1.5 ± 0.4 | .704 |
All masses and volumes are indexed by body surface area.
EDM: end-diastolic mass; EDV: end-diastolic volume; EF: ejection fraction; ESM: end-systolic mass; ESV: end-systolic volume; GLS: global longitudinal strain; LGE: late gadolinium enhancement; SV: stroke volume; TVPI: total volume percentage index.
Major clinical events
Eight patients (11.1%) experienced major clinical events during follow-up. Three patients (4.2%) died, one of sudden cardiac death and two related to pulmonary causes. One patient experienced an acute coronary syndrome and another one developed de novo acute heart failure. These five patients (6.9%) had worse RV GLS values at baseline and a faster progression of GLS impairment when compared to patients with no death or cardiovascular events (–17.2 ± 4.8% vs –22.3 ± 5.9%; p = .024). A 1% worsening in RV GLS was associated with a 18% increased risk of all-cause death or major cardiovascular event at 20-month follow-up (hazard ratio (HR) 1.18; 95% confidence interval (CI) 1.02–1.38; p = .03). LV GLS values were similar at baseline and during follow-up between patients with or without all-cause death or major cardiovascular events (–18.7 ± 3.5% vs –19.8 ± 3.5%; p = .106).
Three other patients (4.2%) developed group 1 pulmonary hypertension during follow-up. Patients developing pulmonary hypertension had worse RV GLS at baseline and faster progression of GLS impairment when compared to patients with no pulmonary hypertension (–10.4 ± 3.1% vs –20.2 ± 3.7%; p = .003). A 1% worsening in RV GLS was associated with a 55% increased risk of pulmonary hypertension at 20-month follow-up (HR 1.55; 95% CI 1.02–2.37; p = .043). Similar results were found for LV GLS (–15.7 ± 1.6% vs –19.4 ± 0.4%; p = .003).
Discussion
The main finding of our study is that SSC-related subclinical organ damage is not a mere bystander but a condition which progresses over time and can be detected by speckle-tracking measurements. Moreover, GLS could represent a good risk predictor of overt manifestations of the disease, such as pulmonary hypertension. According to our data, the pathophysiology of subclinical heart involvement in SSc is probably related to microvascular dysfunction, as suggested by the endocardial distribution of altered deformation and the lack of overt fibrosis as seen in CMR.
SSc-related cardiomyopathy can be considered as a standalone entity affecting the heart in its totality, possibly leading to overt clinical damage, heart failure, conduction defects and arrhythmias.7 Supporting evidence throughout the years has confirmed this hypothesis. We previously demonstrated that primary heart involvement can occur in patients with SSc and can be detected early by GLS.10 Moreover, this is consistent with what Venalis et al.3 described in their study on murine models of SSc and autopsy specimens. In particular, they found that myocardial tissue derived from autopsy specimens of patients with SSc and no clinical sign of heart involvement showed enhanced endothelial cell apoptosis, perivascular inflammation, reduction in the density of capillaries and accumulated collagen. Therefore, microvascular dysfunction and myocardial fibrosis could both compete as the main determinant of subclinical heart damage in SSc patients.
On the one hand, in SSc fibrosis pattern is typically found along the mid-cavity segments of the LV free wall and interventricular septum,13 which, however, does not correlate to the finding of altered deformation mostly present in the endocardium. Further studies described how diffuse patchy fibrosis could be found in addition to contraction band necrosis, with no relation to stenosis of the coronary artery, as well as concentric intimal hypertrophy of intramural coronary arteries.29
On the other hand, Papagoras et al.14 confirmed the idea of microvascular dysfunction as the primary determinant of the disease. They conducted a study on cardiac single-photon emission CT, showing that two out of three SSc patients had reversible ischemia during exercise, despite a low cardiovascular risk profile. Furthermore, recent studies have demonstrated via enhanced transthoracic Doppler before and after adenosine infusion that patients with SSc can have impaired coronary flow reserve.30,31 Moreover, our findings showed that while conventional echocardiographic parameters did not change significantly during a 20-month follow-up, LV and RV GLS worsened significantly, especially in the endocardial layers. Finally, CMR showed that fibrosis was not specifically present in those with worst GLS. When LGE was found, it was mainly observed in the sub-endocardial layers, again confirming that fibrosis could not be the first and main determinant of cardiac organ damage but rather the consequence of microvascular dysfunction. Therefore, small vessels disease seems to be the real culprit of primary heart disease.
Among all tested interaction, we demonstrated a significant interaction between the presence of SSc and diabetes mellitus (p = .041). Despite only 5.7% of our population having type 2 diabetes mellitus at enrolment, they showed, on average, a LV GLS 3% worse than SSc patients without diabetes (Figure 6(a)). It is known that subclinical systolic LV dysfunction is present in up to half of all type 2 diabetic patients, can be assessed by speckle-tracking analysis and is associated with a worse outcome, independently of coronary status and diastolic function.32 Some authors got as far as coining the term ‘diabetic cardiomyopathy’, comprising structural abnormalities such as perivascular fibrosis and collagen deposition in the absence of arterial hypertension or other causes of cardiac organ damage.33 As diabetic cardiomyopathy and SSc-related cardiomyopathy share many mechanisms of microangiopathy, such as perivascular fibrosis, capillary membrane thickening and vascular density reduction,34,35 it is not surprising that they can have a synergic effect in determining GLS worsening and subclinical cardiac damage.
Our study showed an additional result to consider: LV filling-pressure parameters were significantly impaired after a median follow-up of 20 months. Although some believe that diastolic impairment may be the initial sign of cardiac involvement36 and a hallmark of increased mortality, recent studies10,11 on primary heart involvement do not confirm such an hypothesis. What we can hypothesize is that the increased LV filling pressures may be the initial signs of fibrosis affecting the heart in these patients and, therefore, causing alteration of normal relaxation. In fact, some believe that given an alteration of the smaller vessels, repeated ischaemia-reperfusion may lead to irreversible fibrosis.7
Study limitations
This study carries all the limitations of an observational, longitudinal study. Furthermore, although speckle tracking is being increasingly used in clinical practice,37 image quality, irregular arrhythmias and breast prosthetics still represent a limitation.
Our study was obviously underpowered for CMR results. In fact, 10 patients are not enough to assess whether CMR would be more sensitive than GLS in detecting subclinical cardiac damage. Therefore, we cannot confirm what was previously described in literature regarding the added clinical value of CMR in SSc patients.13
Conclusion
Subclinical heart involvement in patients with SSc progresses over time, affects both ventricles and can be assessed non-invasively and effectively through speckle-tracking-derived GLS, which should be used as a primary marker of cardiac organ damage during diagnostic work-up.
Microvascular dysfunction and fibrosis may both play a role in primary cardiac damage; however, our data suggest that the former is the real culprit of SSc-related cardiomyopathy as a standalone entity. The idea of a microvascular dysfunction as the first determinant of cardiac involvement can lead to a deeper knowledge of the disease, and more advanced non-invasive techniques such as perfusion imaging may pave the way to a deeper understanding of its pathophysiology. Although the best course of pharmacological treatment in these patients is still to be defined, some drugs such as endothelin receptor antagonists could prevent organ damage and clinical worsening.
GS and FG contributed to the conception and design of the work. GS, LM, AF, LZ, MF and FG contributed to the acquisition of data for the work. GS and GF contributed to the analysis and drafted the manuscript. All authors contributed to the interpretation of the data and critically revised the manuscript. All authors gave final approval and agree to be accountable for all aspects of work ensuring integrity and accuracy.
The author(s) declared no potential conflicts of interest with respect to the research, authorship, and/or publication of this article.
The author(s) disclosed receipt of the following financial support for the research, authorship, and/or publication of this article: This work was supported by Marche Polytechnic University (398/2019).

Comments