


Exercise performance is known to predict outcome in hypertrophic cardiomyopathy (HCM), but whether sex-related differences exist is unresolved. We explored whether functional impairment, assessed by exercise echocardiography, has comparable predictive accuracy in females and males with HCM.
We retrospectively evaluated 292 HCM patients (46 ± 16 years, 72% males), consecutively referred for exercise echocardiography; 242 were followed for 5.9 ± 4.2 years.
Peak exercise capacity was 6.5 ± 1.6 metabolic equivalents (METs). Sixty patients (21%) showed impaired exercise capacity (≤5 METs). Exercise performance was reduced in females, compared with males (5.6 ± 1.6 vs 6.9 ± 1.5 METs, p < 0.001; peak METs ≤ 5 in 40% vs 13%, p < 0.001), largely driven by a worse performance in women >50 years of age. At multivariable analysis, female sex was independently associated with impaired exercise capacity (odds ratio: 4.67; 95% confidence interval (CI): 1.83–11.90; p = 0.001). During follow-up, 24 patients (10%) met the primary endpoint (a combination of cardiac death, heart failure requiring hospitalization, sustained ventricular tachycardia, appropriate implantable cardioverter defibrillator discharge, resuscitated sudden cardiac death and cardioembolic stroke). Event-free survival was reduced in females (p = 0.035 vs males). Peak METs were inversely related to outcome in males (hazard ratio (HR) per unit increase: 0.57; 95% CI: 0.39–0.84; p = 0.004) but not in females (HR: 1.22; 95% CI: 0.66–2.24; p = 0.53).
Female patients with HCM showed significant age-related impairment in functional capacity compared with males, particularly evident in post-menopausal age groups. While women were at greater risk of HCM-related complications and death, impaired exercise capacity predicted adverse outcome only in men. These findings suggest the need for sex-specific management strategies in HCM.
Introduction
Hypertrophic cardiomyopathy (HCM) is an autosomal dominant disease of the myocardium with incomplete penetrance and heterogeneous presentation and outcome.1,,–4 Despite an equal expected prevalence by sex, women are less represented than men in HCM cohorts, ranging from 45% to 22%.5,,–8 Regardless of ethnicity, females are generally older, with more advanced disease at diagnosis and greater likelihood of heart failure progression compared with males5,6,8,–10; furthermore, female sex could be a minor risk factor for cardiovascular death in childhood HCM.11 Reasons for such discrepancies are still unknown, and may reflect sex-related differences in the pathophysiology of HCM, ultimately relevant to risk stratification and management.12 Exercise performance is known to predict outcome in HCM,13,,–16 but, unlike what has been shown in other cardiovascular diseases such as pulmonary arterial hypertension,17 its clinical value with regard to sex remains unexplored. Specifically, the question of whether a worse outcome in women is predicted by more profound functional impairment, compared with men, has not been previously addressed. Therefore, in the present study, based on a large single-center HCM cohort, we evaluated sex-related functional capacity, assessed by exercise echocardiography, and its relevance to outcome.
Methods
Study population
In this single-center study, we retrospectively evaluated 292 adults (>18 years) with a clinical diagnosis of HCM, consecutively referred to our center for exercise echocardiography between January 2004 and June 2016, including 211 men and 81 women. HCM was diagnosed in the presence of non-dilated and hypertrophied left ventricle (end-diastolic wall thickness ≥15 mm at M-mode or two-dimensional (2D) echocardiography), in the absence of another cardiac or systemic disease capable of producing that magnitude of left ventricle hypertrophy.3 Patients with known obstructive coronary artery disease were excluded from the study. Genetic testing was performed in 224 patients by the sequencing of eight sarcomeric genes, including myosin-binding protein C (MYBPC3), β-myosin heavy chain (MYH7), essential and regulatory myosin light chains (MYL2, MYL3), cardiac troponin T (TNNT2), cardiac troponin I (TNNI3), α-tropomyosin (TPM1) and cardiac actin (ACTC), as well as four genes associated with non-sarcomeric HCM mimics: GLA (for Fabry's disease), LAMP2 (for Danon's disease), PRKAG2 (for PRKAG2 cardiomyopathy) and TTR for wild-type transthyretin amyloidosis.18,19 Patients with these four HCM mimics were excluded from the study. Our institutional review board authorized use of this database according to the principles outlined in the Declaration of Helsinki. Baseline characteristics of the study population are reported in Table 1. Supplementary Figure A summarizes the study design.
Baseline characteristics of the study population by sex.
| Total cohort (n = 292) | Males (n = 211) | Females (n = 81) | p-value | |
|---|---|---|---|---|
| Demographic | ||||
| Age, years | 46 ± 16 | 44 ± 17 | 51 ± 16 | 0.001 |
| BMI, kg/m2 | 25 ± 3 | 25 ± 3 | 25 ± 3 | 0.16 |
| Family history of SCD | 56 (19%) | 37 (17%) | 19 (23%) | 0.25 |
| Family history of HCM | 115 (39%) | 77 (36%) | 38 (47%) | 0.11 |
| Medical history | ||||
| Syncope | 42 (14%) | 31 (15%) | 11 (14%) | 0.9 |
| NSVT | 30 (10%) | 22 (10%) | 8 (10%) | 0.9 |
| Atrial fibrillation | 31 (11%) | 23 (11%) | 8 (10%) | 0.8 |
| Angina | 69 (24%) | 43 (20%) | 26 (32%) | 0.045 |
| Diabetes | 22 (7%) | 14 (7%) | 8 (10%) | 0.33 |
| Hypertension | 66 (23%) | 46 (22%) | 20 (25%) | 0.64 |
| LVOT gradient at rest > 30 mmHg | 42 (14%) | 36 (17%) | 6 (7%) | 0.04 |
| ASA or myectomy | 8 (3%) | 3 (1%) | 5 (6%) | 0.04 |
| Aborted cardiac arrest/SVT | 7 (2%) | 4 (2%) | 3 (4%) | 0.4 |
| ICD | 8 (3%) | 7 (3%) | 1 (1%) | 0.45 |
| NYHA class | 0.003 | |||
| NYHA I | 186 (64%) | 147 (70%) | 39 (48%) | 0.001 |
| NYHA II | 84 (29%) | 51 (24%) | 33 (41%) | 0.006 |
| NYHA III | 22 (7%) | 13 (6%) | 9 (11%) | 0.21 |
| Pharmacological treatment | ||||
| Beta-blockers | 137 (47%) | 98 (46%) | 39 (48%) | 0.8 |
| Verapamil/Diltiazem | 20 (7%) | 11 (5%) | 9 (11%) | 0.12 |
| Disopyramide | 19 (6%) | 12 (6%) | 7 (9%) | 0.43 |
| Amiodarone | 21 (7%) | 14 (7%) | 7 (9%) | 0.6 |
| RAAS inhibitors | 26 (9%) | 19 (9%) | 7 (9%) | 1 |
| Diuretics | 22 (7%) | 15 (7%) | 7 (9%) | 0.63 |
| Genetic testing | ||||
| With pathogenic/likely pathogenic sarcomere gene mutations* | 137/224 (61%) | 96/160 (60%) | 41/64 (64%) | 0.65 |
| Resting echocardiography | ||||
| LA diameter, mm | 42 ± 7 | 43 ± 7 | 40 ± 6 | 0.001 |
| LA volume, ml | 80 ± 29 | 83 ± 31 | 71 ± 24 | 0.002 |
| LA volume indexed, ml/mq | 42 ± 15 | 43 ± 16 | 41 ± 14 | 0.44 |
| LVEDD, mm | 45 ± 5 | 46 ± 5 | 43 ± 5 | < 0.001 |
| LVEDV, ml | 101 ± 27 | 108 ± 26 | 84 ± 20 | < 0.001 |
| LVEDV indexed, ml/mq | 54 ± 12 | 56 ± 12 | 48 ± 10 | < 0.001 |
| LVESV, ml | 34 ± 13 | 36 ± 14 | 27 ± 9 | < 0.001 |
| LVESV indexed, ml/mq | 18 ± 7 | 19 ± 7 | 15 ± 5 | < 0.001 |
| LVEF, % | 67 ± 7 | 67 ± 7 | 67 ± 6 | 0.95 |
| Maximal LV thickness, mm | 21 ± 5 | 21 ± 5 | 20 ± 4 | 0.31 |
| Mitral regurgitation | 0.95 | |||
| None | 140 (48%) | 101 (48%) | 39 (48%) | |
| Mild | 131 (45%) | 94 (44%) | 37 (46%) | |
| Moderate | 18 (6%) | 14 (7%) | 4 (5%) | |
| Severe | 3 (1%) | 2 (1%) | 1 (1%) | |
| E, cm/s | 71 ± 20 | 70 ± 19 | 73 ± 23 | 0.18 |
| A, cm/s | 62 ± 22 | 60 ± 22 | 66 ± 22 | 0.04 |
| DTE, msec | 230 ± 75 | 230 ± 74 | 228 ± 78 | 0.9 |
| E/A | 1.3 ± 0.6 | 1.3 ± 0.6 | 1.2 ± 0.6 | 0.35 |
| E' septal, cm/s | 6.8 ± 2.8 | 7.1 ± 2.8 | 6.1 ± 2.8 | 0.04 |
| E' lateral, cm/s | 10.1 ± 3.8 | 10.5 ± 3.9 | 8.9 ± 3.1 | 0.004 |
| E/E' septal | 11.9 ± 5.2 | 11.3 ± 4.6 | 13.7 ± 6.4 | 0.004 |
| E/E' lateral | 8.1 ± 3.8 | 7.6 ± 3.4 | 9.4 ± 4.5 | 0.002 |
| LVOT gradient at rest, mmHg | 17 ± 19 | 18 ± 20 | 14 ± 15 | 0.13 |
| Heart rate, beats/min | 68 ± 13 | 68 ± 13 | 68 ± 14 | 0.72 |
| SBP, mmHg | 121 ± 15 | 121 ± 15 | 122 ± 17 | 0.58 |
Values are mean ± standard deviation or n (%).
On 224 genotyped patients.
A: peak velocity of diastolic filling during atrial contraction; ASA: alcohol septal ablation; BMI: body mass index; DTE: deceleration time of the E wave; E: peak velocity of early diastolic filling; E': early diastolic mitral annular velocity; E/E': early diastolic velocity ratio; HCM: hypertrophic cardiomyopathy; ICD: implantable cardioverter defibrillator; LA: left atrial; LV: left ventricular; LVEDD: left ventricular end-diastolic diameter; LVEDV: left ventricular end-diastolic volume; LVEF: left ventricular ejection fraction; LVESV: left ventricular end-systolic volume; LVOT: left ventricular outflow tract; NSVT: non-sustained ventricular tachycardia; NYHA: New York Heart Association; RAAS: renin angiotensin aldosterone system; SBP: systolic blood pressure; SCD: sudden cardiac death; SVT: sustained ventricular tachycardia.
Resting echocardiography
Standard echocardiographic studies were performed using commercially available instruments. Peak instantaneous left ventricular outflow tract (LVOT) gradient was measured at rest (and with the Valsalva maneuver) by continuous-wave Doppler interrogation in the apical five-chamber view, taking care to avoid contamination of the waveform by the mitral regurgitation jet.20 Resting LVOT obstruction was defined by a peak pressure gradient ≥30 mmHg at baseline.3,20 Mitral regurgitation was graded as none or trivial, mild, moderate or severe using multiple criteria.21 Left ventricular (LV) volume, LV ejection fraction and left atrial volume were measured from the apical view, using the biplane Simpson's rule method. Using M-Mode and 2D, we measured LV diameter, left atrial end-systolic diameter and maximal end-diastolic LV wall thickness. The peak velocity of early (E) and late (A) transmitral flow waves and peak early diastolic mitral annular velocity were measured as recommended22; for the assessment of diastolic function, we used lateral E' and not average for its best correlation with functional capacity and because septal E' is disproportionately reduced in most patients due to the typical localization of asymmetric LV hypertrophy.23,–25
Stress echocardiography
Routinely used medications were not withdrawn before the test. Maximum, symptom-limited exercise tests were performed on a bicycle ergometer in the semi-supine position, with stepwise 25-W increments every 2 minutes. Exercise echocardiography was performed under basal conditions and serially every 2 minutes during exercise to identify and grade mitral regurgitation and estimate LVOT gradient with continuous-wave Doppler. Clinically relevant exercise-induced LVOT obstruction was defined by a peak gradient ≥50 mmHg.20 Data pertaining diastolic function reserve and estimated pulmonary artery pressures on effort were not routinely collected. Wall motion abnormalities were noted, but were present only in a small minority (<5%) and were, therefore, not included in our analysis.
A 12-lead electrocardiogram was monitored continuously and recorded at baseline, at each minute during exercise and after exercise. Arterial blood pressure was measured with a sphygmomanometer at baseline and every 2 minutes during exercise and in the post-exercise phase. Abnormal blood pressure response was defined by either a failure of systolic blood pressure to raise >20 mmHg or any fall in systolic blood pressure during exercise.
Patients were encouraged to perform maximally to achieve their expected heart rate. The maximum predicted heart rate was calculated as 220 minus the patient's age, and heart rate attained was expressed as the percentage of predicted. Exercise was terminated when fatigue, dyspnea, chest pain, clinically relevant arrhythmia or hypotension intervened. Peak exercise was defined as the maximum workload attained before discontinuation. Peak functional capacity was extrapolated to metabolic equivalents (METs),13,14,26 with 1 MET defined as the energy expended at rest, equivalent to an oxygen consumption of 3.5 ml/kg of body weight/minute, as recommended.27
Study endpoints
Patients were followed up on an annual basis, or more often if clinically required. The primary endpoint was a combination of cardiac death, heart failure requiring hospitalization, sustained ventricular tachycardia, appropriate implantable cardioverter defibrillator discharge or resuscitated sudden cardiac death and cardioembolic stroke. The secondary endpoint included the primary endpoint, plus new onset atrial fibrillation or symptomatic progression to New York Heart Association (NYHA) functional classes III/IV. In patients meeting both endpoints, time to the first event was considered.
Statistical methods
Continuous variables were expressed as mean ± standard deviation, while categorical variables were reported as number of cases and percentage. The unpaired Student's t-test was used for comparison of normally distributed data after screening for normality. The chi-square test or Fischer's exact test, as appropriate, were utilized to compare non-continuous variables. For the purpose of the present study, impaired exercise capacity was defined by a peak performance ≤5 METs – that is, at or below the threshold identifying the lowest quartile for our cohort. Univariable and multivariable predictors of impaired exercise capacity were identified by binary logistic regression analysis; data are reported as odds ratios (ORs) with 95% confidence intervals (CIs). To identify predictors of outcome, a Cox proportional hazard regression model was used; data are reported as hazard ratio (HR) with 95% CI. Multivariate analyses were performed with a stepwise forward regression model, and variables with a p-value ≤ 0.05 based on univariate analysis were entered into the model. Survival curves were constructed according to the Kaplan–Meier method, and comparisons were performed using the log-rank test. All p-values are two-sided and considered significant when <0.05. Calculations were performed using the SPSS 24.0 software (IBM Corp., Armonk, NY, USA).
Results
Baseline characteristics and sex
Of the 292 HCM study patients (mean age 46 ± 16 years, maximum LV wall thickness 21 ± 5 mm), 211 (72%) were males and 81 (28%) females (Table 1). Forty-two patients (14%) had resting LVOT obstruction in basal conditions and 8 (3%) had prior history of surgical myectomy or alcohol septal ablation. The majority (n = 270, 93%) were in NYHA class I or II. Of the 224 patients who underwent genetic testing, 137 (61%) carried one or more pathogenic/likely pathogenic sarcomere gene mutations.
Compared with men, women were older (51 ± 16 vs 44 ± 17 years, p = 0.001) and more often complained of dyspnea (NYHA class > I) and angina (Table 1). Furthermore, women had LVOT obstruction at rest less frequently (7% vs 17% in males, p = 0.04), had smaller LV end-diastolic volume and volume index (p < 0.001 for both) and had indirect evidence of higher LV filling pressure (lateral E/E' 9.4 ± 4.5 vs 7.6 ± 3.4 in males, p = 0.002). All other baseline features, including the prevalence of genotype positive individuals, body mass index (BMI), maximal LV wall thickness, left atrial volume index and LV ejection fraction, were comparable (Table 1).
Comparison of exercise performance
Mean exercise time for the whole cohort was 11 ± 4 minutes, and peak exercise capacity was 6.5 ± 1.6 METs; 60 patients (21%) achieved ≤5 METs, reflecting impaired exercise capacity (Table 2). There was no sex difference in the percentage of maximum predicted heart rate achieved (77 ± 12% for males and 77 ± 13% for females, p = 0.82). Exhaustion was the most common reason for interruption and there were no significant complications during or after the test. During exercise, 82 patients (28%) developed exercise-induced LVOT obstruction ≥50 mmHg, 13 (4%) developed severe mitral regurgitation due to systolic anterior motion of the mitral valve and 38 (13%) showed an abnormal blood pressure response.
Exercise echocardiography by sex.
| Total cohort (n = 292) | Males (n = 211) | Females (n = 81) | p-value | |
|---|---|---|---|---|
| Echocardiographic parameters | ||||
| Peak stress mitral regurgitation | 0.13 | |||
| None | 108 (37%) | 70 (33%) | 38 (47%) | |
| Mild | 121 (41%) | 90 (43%) | 31 (38%) | |
| Moderate | 46 (16%) | 39 (18%) | 7 (9%) | |
| Severe | 13 (4%) | 10 (5%) | 3 (4%) | |
| LVOT gradient at peak stress, mmHg | 40 ± 34 | 45 ± 37 | 26 ± 18 | < 0.001 |
| With LVOT gradient at peak stress >50 mmHg | 82 (28%) | 74 (35%) | 8 (10%) | < 0.001 |
| LVOT gradient post-stress, mmHg | 47 ± 43 | 54 ± 47 | 32 ± 26 | < 0.001 |
| With LVOT gradient post-stress >50 mmHg | 88 (30%) | 74 (35%) | 14 (17%) | 0.001 |
| Hemodynamic parameters | ||||
| Peak SBP, mmHg | 166 ± 29 | 168 ± 29 | 160 ± 27 | 0.04 |
| Abnormal BP response | 38 (13%) | 23 (11%) | 15 (18%) | 0.12 |
| Peak heart rate, beats/min | 134 ± 25 | 135 ± 25 | 129 ± 25 | 0.08 |
| Percent of maximum predicted HR | 77 ± 12% | 77 ± 12% | 77 ± 13% | 0.82 |
| Exercise Parameters | ||||
| Exercise time, min | 11 ± 4 | 12 ± 4 | 8 ± 3 | < 0.001 |
| Peak Watts | 119 ± 37 | 131 ± 32 | 87 ± 30 | < 0.001 |
| Peak METs | 6.5 ± 1.6 | 6.9 ± 1.5 | 5.6 ± 1.6 | < 0.001 |
| Peak METs ≤5 | 60 (21%) | 28 (13%) | 32 (40%) | < 0.001 |
| Symptoms/arrhythmias | 0.38 | |||
| Dyspnea | 21 (7%) | 12 (6%) | 9 (11%) | |
| Angina | 3 (1%) | 2 (1%) | 1 (1%) | |
| NSVT | 3 (1%) | 3 (1%) | 0 (0%) |
Values are mean ± standard deviation or n (%).
BP: blood pressure; HR: heart rate; METs: metabolic equivalents; other abbreviations as in Table 1.
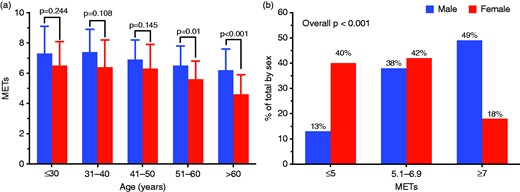
Sex-related differences in functional capacity. (a) Comparison of exercise performance between males and females according to age. (b) Sex distribution among different functional classes.
At multivariable logistic regression analysis, female sex proved to be an independent predictor of impaired exercise capacity (≤5 METs at peak), together with BMI, NYHA functional class, presence of resting LVOT obstruction and small LV cavity dimensions (defined as an end-diastolic volume in the lowest tertile for the study group; Table 3). Specifically, female sex was independently associated with an almost five-fold increase in likelihood of impaired exercise capacity (OR: 4.67; 95% CI: 1.83–11.90; p = 0.001).
Predictors of poor functional capacity (≤5 METs at peak exercise) at univariable and multivariable logistic regression analysis.
| Univariable analysis | Multivariable analysis | |||
|---|---|---|---|---|
| Variables | OR (95% CI) | p-value | OR (95% CI) | p-value |
| Age (per year increase) | 1.04 (1.02–1.06) | <0.001 | – | – |
| Female sex | 4.27 (2.35–7.76) | <0.001 | 4.67 (1.83–11.90) | 0.001 |
| BMI (per unit increase) | 1.20 (1.10–1.31) | <0.001 | 1.22 (1.08–1.37) | 0.002 |
| Beta-blockers, Verapamil or Diltiazem | 1.50 (0.84–2.67) | 0.17 | – | – |
| NYHA class (per unit increase) | 3.41 (2.20–5.31) | <0.001 | 2.68 (1.48–4.86) | 0.001 |
| LVOT gradient at rest >30 mmHg | 2.88 (1.43–5.82) | 0.003 | 3.61 (1.31–9.96) | 0.013 |
| LV ejection fraction (per unit increase) | 0.97 (0.93–1.01) | 0.15 | – | – |
| Maximum LV wall thickness (per unit increase) | 1.03 (0.97–1.09) | 0.36 | – | – |
| LA volume (per unit increase) | 1.01 (1.00–1.02) | 0.17 | – | – |
| LVEDV (per unit increase) | 0.99 (0.98–1.00) | 0.085 | – | – |
| LVEDV < I° tertile (<88 ml) | 2.40 (1.34–4.30) | 0.003 | 2.99 (1.20–7.46) | 0.019 |
| E/E' lateral (per unit increase) | 1.17 (1.08–1.27) | <0.001 | – | – |
| Moderate or severe MR at rest | 1.61 (0.60–4.34) | 0.35 | – | – |
| Presence of pathogenic/likely pathogenic sarcomere gene mutations | 0.94 (0.48–1.83) | 0.86 | – | – |
Outcome
Fifty patients were excluded from survival analysis due to a follow-up <1 year. The remaining 242 HCM patients were followed over a median follow-up of 5.9 ± 4.2 years after exercise echocardiography (5.7 ± 4.1 years in males vs 6.3 ± 4.2 in females; p = 0.39). Of the 242 patients, 24 (10%) met the primary endpoint and 55 (23%) the secondary endpoint (Supplementary Table A). The breakdown of individual endpoints was as follows: six cardiovascular deaths (2%), two episodes of sustained ventricular tachycardia (1%), one resuscitated sudden cardiac death (0.4%), nine heart failure episodes requiring hospitalization (4%) and 13 cardioembolic strokes (5%). In addition, 40 patients developed new onset atrial fibrillation (16%) and eight progressed to NYHA class III/IV (3%).
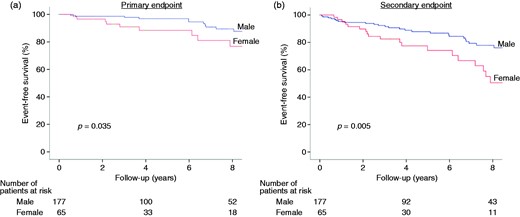
Outcomes according to sex. Event-free survival according to sex for the primary ((a) combination of cardiac death, heart failure requiring hospitalization, sustained ventricular tachycardia, appropriate implantable cardioverter defibrillator (ICD) discharge or resuscitated sudden cardiac death and cardioembolic stroke) and secondary endpoint ((b) the primary endpoint, plus new onset atrial fibrillation or symptomatic progression to NYHA functional classes III/IV).
When sexes were analyzed separately, peak METs were inversely related to outcome in males (HR per unit increase: 0.57, 95% CI: 0.39–0.84, p = 0.004 for primary endpoint) but not in females (HR: 1.22, 95% CI: 0.66–2.24, p = 0.53). Among males, a peak exercise METs <7 proved the best threshold for the prediction of adverse events (Supplementary Figure B), with very high sensitivity (100%) but low specificity (50%); negative and positive predictive values were 100% and 14%, respectively.
Discussion
Our main result was the novel finding that exercise performance is more diffusely impaired in HCM women compared with men, particularly after mid-life and, in the present series, largely unrelated to obstruction. Furthermore, we found that exercise performance, previously shown to predict outcome in HCM,13,,–16 seems to have true predictive value in male patients only, while the occurrence of clinical endpoints in females was largely independent of exercise capacity. Of note, females showed reduced exercise capacity both in terms of absolute METs and exercise time, and were almost four times more represented (40% vs 13%) in the lowest exercise capacity group (peak METs ≤5) compared with males. Conversely, the occurrence of exercise-induced obstruction was lower in women, suggesting that, while a substantial proportion of HCM men may owe their reduced performance to provocable LVOT gradients, this is often not the case in women. Rather, these findings suggest more severe degrees of myocardial dysfunction in female patients, which become overt after mid-life. Indeed, the impact of age on exercise performance was striking in women with HCM. Even though female sex could be a minor risk factor for cardiovascular death since childhood,11 limited discrepancy in peak METs was seen in younger age categories, while the sex gap became evident in the group >50 years (Figure 1(a)). This is probably due to the fact that older women had more advanced heart failure at time of referral for HCM evaluation compared with men, reflected in a higher prevalence of congestive symptoms (NYHA class II or III) at the time of enrollment. Such a finding leads us to speculate that postmenopausal endocrine changes may impact the phenotypic expression and clinical course of women with HCM, consistent with prior observations by our group,5 including loss of the protective role of estrogens seen in animal models.28,29 In addition, the contribution of a more sedentary lifestyle in reducing exercise tolerance of older women might be hypothesized.30
The fact that exercise impairment appears related to intrinsic myocardial dysfunction, rather than dynamic obstruction, appears relevant to the adverse prognosis of HCM women, as their form of heart failure seems to be less “reversible”.7,31 Heart failure secondary to dynamic obstruction is known to be associated with no or minimal LV fibrosis and to have a favorable natural history following successful relief of the gradient.31 Conversely, heart failure in the context of primary myocardial dysfunction, generally subtended by diffuse microvascular dysfunction and fibrosis,2 tends to progress despite optimal care, reflecting a substantial lack of disease-modifying drugs for HCM.32
Furthermore, while baseline phenotypic expression limited to LV hypertrophy did not differ between sexes, LV cavity size, considered genetically determined in HCM,33,34 was significantly smaller in women,35 even when indexed per body size, suggesting more severe disease involvement. A small LV cavity size, defined as an end-diastolic volume in the lowest tertile, proved to be an independent predictor of exercise capacity in our cohort, consistent with the recent report by Axelsson et al.36 For any given value of ejection fraction, a smaller LV cavity is associated with reduced stroke volume, which may account for impaired exercise capacity. In addition, the combination of small cavity dimensions and LV hypertrophy may synergistically determine higher diastolic filling pressures and diastolic dysfunction during effort, emphasizing the role of exercise-induced diastolic dysfunction as a main determinant of functional capacity in HCM.37
The main clinical implication of our study is that exercise performance evaluated by stress echocardiography confirms its value in the prognostication of male HCM patients but does not seem to have a similar role in women. Specifically, no male patients with a peak exercise capacity above 7 METs met the primary endpoint, confirming the recent observation by Desai et al.14 A potential interpretation is that the male HCM spectrum is more heterogeneous and includes patients with truly well-compensated forms of disease, deserving reassurance. Conversely, females exhibit a more diffuse and severe clinical instability and their risk of adverse outcome cannot be ruled out as confidently by preserved exercise capacity. These data require confirmation in larger datasets and, in a broader perspective, point out the need for further research addressing the sex gap in survival in HCM. For example, a recent randomized trial showed that moderate-intensity exercise produces a significant increase in exercise capacity in HCM patients.30 It is intriguing to speculate that tailored activities and well-conducted training programs might provide a safe and effective measure to overcome functional impairment associated with sex in post-menopausal women.
The present study has several limitations. A notable one, shared by similar studies,38 is that only 28% of our patients were females, suggesting underrepresentation of women in exercise testing referral. By comparison, the prevalence of females in the whole Florence cohort is 41%. This may reflect the fact that females presented at an older age, had more severe limitations and presented obstruction at rest more frequently, compared with men, thus representing less suitable candidates for stress testing.5,8 Conversely, males are more often young and active, exerting more pressure upon physicians in order to be allowed sporting activities, resulting in preferential referral for exercise testing.39 In general, however, female underrepresentation may also reflect a complex mix of social bias, reduced patient awareness40 and reduced access to medical screening programs.41
In the present study, we chose to measure exercise capacity by estimated METs from external work rate. Although calculated METs are less robust than peak VO2 values by cardiopulmonary testing, they are easier to obtain and widely usable in clinical practice. Previous studies14 expressed functional capacity as a percentage of age and sex predicted METs. However, this approach requires the use of additional dated formulas derived from a healthy population, which could definitely add bias. Furthermore, functional capacity expressed as an absolute value has an important role in prognostic stratification, as already shown in other clinical settings such as pulmonary arterial hypertension, pre-operative cardiac risk evaluation and perioperative management of patients undergoing non-cardiac surgery.42,43
In our retrospective study, we used exercise echocardiography mainly to assess provocable LV outflow tract obstruction, while diastolic function reserve and pulmonary artery systolic pressure during stress were not routinely available (as noted in the Methods section). Regional wall motion analysis was performed in all, but abnormalities proved rare (<5%), whereas ST-T segment abnormalities during effort were more common but are notoriously nonspecific in HCM. Therefore, we were not able to dissect the pathophysiologic basis of sex-related differences in performance. These issues will be addressed in a large-scale prognostic validation of stress echo in HCM recently started as a specific subproject of the “SE 2020” study endorsed by the Italian Society of Echocardiography.44
Finally, due to the low event rate of hard events during follow-up – a well-established feature of the natural history of HCM – the study unavoidably employed less robust, combined endpoints, consistent with prior literature.13,14
In conclusion, female patients with HCM showed significant age-related impairment in functional capacity compared with males, particularly evident in post-menopausal age groups. While women were at greater risk of HCM-related complications and death, impaired exercise capacity predicted adverse outcome only in men. These findings suggest the need for sex-specific management strategies in HCM.
IO, LG, AM, FC, OA, PA, GF, ER, FM, MC, FR, AA, MT, SP, FP and MM contributed to the conception or design of the work or to the acquisition of data. IO, CF, NM, LG and AM contributed to the analysis and/or interpretation of results. LG, AM, CF and NM drafted the manuscript. IO, FG, CF and NM critically revised the manuscript. All authors gave final approval and agree to be accountable for all aspects of work ensuring integrity and accuracy.
The author(s) declared no potential conflicts of interest with respect to the research, authorship, and/or publication of this article.
The author(s) disclosed receipt of the following financial support for the research, authorship, and/or publication of this article: IO was supported by the Italian Ministry of Health (“Left ventricular hypertrophy in aortic valve disease and hypertrophic cardiomyopathy: genetic basis, biophysical correlates and viral therapy models”, RF-2013-02356787) and NET-2011-02347173 (“Mechanisms and treatment of coronary microvascular dysfunction in patients with genetic or secondary left ventricular hypertrophy”); by Telethon Italy (GGP13162); and by the ToRSADE project (FAS-Salute 2014, Regione Toscana).
References
Author notes
The first two authors equally contributed to this work.

Comments