


Abstract
A low prevalence of type 2 diabetes mellitus has been reported in familial hypercholesterolaemia. Whether a healthier lifestyle could explain it has not been explored. This cross-sectional study determines the prevalence of lifestyle-related cardiovascular risk factors in heterozygous familial hypercholesterolaemia (HeFH) from the Dyslipidaemia Registry of the Spanish Atherosclerosis Society and in the ENRICA study, a representative sample of the adult Spanish general population, weighted to match the age and sex distribution of the HeFH sample. A total of 2185 HeFH patients and 11,856 individuals from ENRICA were included. HeFH had lower body mass index and fewer of them were smokers than in the reference population. A model adjusted for age, sex and body mass index showed that HeFH more frequently had cardiovascular disease (odds ratio (OR) 23.98; 95% confidence interval (CI) 18.40–31.23) and hypertension (OR 1.20; 95% CI 1.07–1.35), and took anti-hypertensive medication (OR 1.36; 95% CI 1.18–1.56) and anti-diabetic medication (OR 1.25; 95% CI 1.00–1.56), but less frequently were smokers (OR 0.79; 95% CI 0.71–0.89). In a HeFH subsample (n = 513) with complete blood glucose information, those patients without cardiovascular disease showed lower prevalence of smoking and type 2 diabetes mellitus, lower body mass index and glucose, and higher diastolic blood pressure than the Spanish population. The differences in type 2 diabetes mellitus were justified mostly by the difference in body mass index. Body mass index adjustment also showed higher prevalence of hypertension and use of anti-hypertensive drugs in HeFH. In summary, HeFH patients had lower body mass index, which may contribute to explaining the lower prevalence of diabetes, and lower current smoking but higher hypertension.
Introduction
Familial hypercholesterolaemia is one of the most common genetic diseases worldwide.1 The estimated prevalence of heterozygous familial hypercholesterolaemia (HeFH) is one in every 200–250 persons2,3 and it is even higher in areas with some genetic isolation.4 Familial hypercholesterolaemia patients are characterized by very high plasma concentration of low-density lipoprotein (LDL) cholesterol with autosomal co-dominant pattern of transmission, tendon xanthomas and high risk of premature coronary heart disease (CHD).5 Most cases of familial hypercholesterolaemia are caused by mutations in the genes encoding for the LDL particle receptor (LDLR),6 apolipoprotein B (APOB),7 proprotein convertase subtilisin/kexin type 9 (PCSK9)8 and apolipoprotein E (APOE).9 Untreated individuals have a markedly elevated long-term CHD risk, with hazard ratios up to 5.0 with respect to the general population and 100-fold increase in early CHD mortality in young adults.10,11
Several recent studies have found that patients with HeFH might be less prone to developing type 2 diabetes mellitus (T2DM).12,13 This protection is puzzling because these patients are frequently treated with high doses of potent statins for long periods, and it is well established that hydroxy-methyl-glutaryl-CoA reductase (HMGCR) inhibition increases the risk of T2DM.13 Several observational studies14,15 and a large meta-analysis of statin trials showed that statins increase the risk for new onset T2DM by 9–12% with a dose-dependent effect, supporting a causal relationship.16 The mechanism of this apparent protection of HeFH for the development of T2DM is unknown. It has been hypothesized that a reduction of cholesterol uptake by pancreatic β cells in HeFH may improve insulin secretion.11,17
T2DM is the result of complex interactions between genetic and environmental factors. The genetic component is very polygenic in most cases, and attributable to modest deleterious effects of common regulatory gene variants present in the general population.18 However, the genes causing familial hypercholesterolaemia have not been found associated with T2DM, neither in the genome-wide association studies19 nor in exome sequencing of T2DM populations.20 These data suggest that T2DM protection is not related with the primary defect of familial hypercholesterolaemia.21
On the contrary, some reports suggest that certain cardiovascular disease (CVD) risk factors could be diminished in the HeFH population, especially those related to healthy behaviours12,13 such as diet and physical activity. Maintaining a healthy lifestyle throughout young adulthood is strongly associated with a low cardiometabolic risk later in life.22,23 It is plausible that the low prevalence of T2DM in patients with HeFH could be related to a healthy lifestyle early in life, which can modulate the risk of T2DM. Hence, the aim of this study is to assess the frequency of some behaviour-dependent CVD risk factors in patients with HeFH and compare it against the general population.
Methods
Aim, design and participants
This observational, multicentre, national study in Spain was designed to determine the prevalence of lifestyle-related cardiovascular risk factors in patients with HeFH and to compare it against that observed in the general population. Data on HeFH patients and general population information were obtained from the Dyslipidaemia Registry of the Spanish Atherosclerosis Society (SEA)24 and the ENRICA study,25 respectively. The Dyslipidaemia Registry of the SEA is an active online registry, where 65 certified lipid clinics across all regions of Spain report cases of various types of primary hyperlipidaemias.24 Anonymous clinical data collection in this registry was approved by a central ethics committee (Comité Ético de Investigación Clínica de Aragón) and participants gave their informed written consent. The ENRICA study was conducted between June 2008 and October 2010 on a representative sample of the Spanish population aged 18 years and older. The information was collected by trained personnel in participants’ homes in three sequential stages: i) computer-assisted telephone interview, ii) first home visit to obtain biological samples (blood and urine), and iii) second home visit to measure anthropometric variables and blood pressure as well as to take a dietary history. The ENRICA protocol was approved by the Clinical Research Ethics Committees of the ‘La Paz’ University Hospital in Madrid and the Hospital ‘Clinic’ in Barcelona; all study participants gave informed written consent.
Subjects in both studies were eligible for inclusion in this analysis if they were 18 years of age or older and, in the case of the Dyslipidaemia Registry cohort, if they had a clinical or genetic diagnosis of HeFH. Clinical diagnosis was based on the diagnostic criteria proposed by the Dutch Lipid Clinics Network: 6–8 points (probable) and >8 points (definitive).1 Genetic diagnosis was based on tested carrier status of a known pathogenic mutation for familial hypercholesterolaemia (78.1% of HeFH cohort). Homozygous familial hypercholesterolaemia were not included in this study.
Study variables
Arterial hypertension was defined as having systolic blood pressure ≥140 mmHg or diastolic blood pressure ≥90 mmHg, or self-reported use of antihypertensive medication. Blood pressure was measured three consecutive times using automatic oscillometric sphygmomanometers with the participant sitting after a 5-min rest. Body mass index (BMI) was calculated as weight in kilograms divided by the square of height in metres. Diabetes was defined as fasting plasma glucose ≥126 mg/dl or self-reported treatment with anti-diabetic medication. Glucose was not available in all subjects in the Dyslipidaemia Registry and diabetes was considered based on the physician diagnosis encoded in the registry. However, a subgroup analysis with the aforementioned strict definition was performed (see below). Smoking was defined as smoking at present (current smoker) or having ever smoked. Former smoker was defined as a subject having smoked for at least one year in his lifetime but being a non-smoker in the last year.
Subgroup analysis
In the Dyslipidaemia Registry of the SEA the information about current blood glucose, although it is present in most cases, is not mandatory, in contrast to information on the diagnosis of T2DM and anti-diabetic medication use. To avoid any selection bias, we selected a subgroup of HeFH cases from those lipid clinics in which 100% of HeFH cases had full information of current blood glucose.
Statistical analysis
Summaries of risk factors, continuous and categorical variables, were calculated as mean (standard deviation) and percentage, respectively. Estimations with 95% confidence intervals (CIs) were calculated using Student’s t and binomial distributions or its normal approximation, as appropriate. Sex and age strata were created in both studies and weights were created for the ENRICA study so that the sample would have the same age and sex composition as HeFH patients in the Dyslipidaemia Registry, that is, ENRICA estimations would provide summary values for the registry sample should they have been members of the general population instead of HeFH patients. This approach dealt with the sparse and irregular demographics distribution of the registry sample and avoided assumptions implied when adjusting through the use of linear models, like those on linearity of the association of risk factors with age and those on absence of sex interactions.
Differences between the registry and ENRICA samples were tested with weighted Student’s t and Chi squared tests. Plots of sex and 5-years-of-age strata provided detailed information on which patients were most different. Linear models were used to analyse the differences, adjusting for pre-hypothesized variables that could justify environmental influences on the differences observed, such as BMI, and preventive drugs. Given that some of these variables are associated with demographics, conditioning on them reintroduces an artificial confounding association in spite of weighting, which was resolved including age and sex in the adjusted regression models. We also performed stratified analyses by lipid-lowering drug use, genetic results and CVD.
Analyses were performed with the statistical software R version 3.4.4.
Results
A total of 2185 subjects with HeFH from the Dyslipidaemia Registry and 11,856 subjects as reference population from the ENRICA were selected according to inclusion criteria. In a first analysis where the ENRICA population was weighted to match age and sex distribution of the familial hypercholesterolaemia sample, HeFH patients had lower levels of systolic blood pressure, lower BMI and fewer of them were current smokers and ever smokers than the reference population (Table 1). The prevalence of CVD was much higher in HeFH than in the general population (15.1% vs. 0.9%). Antihypertensive medication was more frequently taken by HeFH subjects than the reference population (20.0% vs. 17.7%) in spite of similar prevalence of hypertension in both cohorts. There were not any differences in the prevalence of T2DM or in the consumption of anti-diabetic drugs (Table 1).
Clinical characteristics of heterozygous familial hypercholesterolaemia and ENRICA populations matched for age and sex.
| ENRICA | FH registry | ||
|---|---|---|---|
| Mean/% (95% CI) | Mean/% (95% CI) | p | |
| N | 11,856 | 2182 | |
| Age, years | 49.2 | 49.1 | 0.939 |
| (48.9, 49.4) | (48.5, 49.7) | ||
| Women, % | 52.5 | 52.5 | 1.000 |
| (51.5, 53.4) | (50.4, 54.6) | ||
| Systolic blood pressure, mmHg | 128.8 | 127.4 | <0.001 |
| (128.5, 129.2) | (126.7, 128.1) | ||
| Diastolic blood pressure, mmHg | 76.8 | 77.3 | 0.093 |
| (76.7, 77.0) | (76.8, 77.7) | ||
| Body mass index, kg/m2 | 27.1 | 26.3 | <0.001 |
| (27.0, 27.2) | (26.1, 26.4) | ||
| Waist circumference, cm | 91.8 | 89.6 | <0.001 |
| (91.5, 92.0) | (89.0, 90.2) | ||
| LDL-c, mg/dl | 125.7 | 265.9 | <0.001 |
| (125.1, 126.3) | (262.8, 268.9) | ||
| HDL-c, mg/dl | 53.4 | 55.0 | <0.001 |
| (53.1, 53.7) | (54.3, 55.6) | ||
| Current smoking, % | 26.6 | 22.8 | <0.001 |
| (25.8, 27.5) | (21.1, 24.6) | ||
| Ever smoking, % | 52.8 | 46.7 | <0.001 |
| (51.8, 53.8) | (44.6, 48.8) | ||
| Former smoking, % | 26.2 | 23.9 | 0.026 |
| (25.3, 27.1) | (22.1, 25.7) | ||
| Lipid-lowering medication, % | 14.9 | 88.4 | <0.001 |
| (14.2, 15.6) | (86.9, 89.6) | ||
| Hypertension medication, % | 17.7 | 20.0 | 0.011 |
| (16.9, 18.4) | (18.4, 21.7) | ||
| Diabetes medication, % | 4.7 | 5.1 | 0.392 |
| (4.3, 5.1) | (4.2, 6.1) | ||
| Personal history of cardiovascular disease, % | 0.9 | 15.0 | <0.001 |
| (0.8, 1.2) | (13.6, 16.6) | ||
| Hypertension, % | 34.2 | 35.2 | 0.389 |
| (33.2, 35.1) | (33.2, 37.2) | ||
| Diabetes, % | 6.6 | 6.7 | 0.881 |
| (6.2, 7.2) | (5.8, 7.9) |
Unadjusted estimates from linear and logistic regression models. ENRICA is weighted to match age and sex distribution of familial hypercholesterolaemia sample (by 5-year wide age and sex strata).
FH: familial hypercholesterolaemia; CI: confidence interval; LDL-c: low-density lipoprotein cholesterol; HDL-c: high-density lipoprotein cholesterol
After adjusting for age, sex and BMI, HeFH patients more frequently had CHD (OR 23.98; 95% CI 18.40 to 31.23) and hypertension (OR 1.20; 95% CI 1.07 to 1.35) and took anti-hypertensive medication (OR 1.36; 95% CI 1.18 to 1.56) and anti-diabetic medication (OR 1.25; 95% CI 1.00 to 1.56), but less frequently were current smokers (OR 0.79; 95% CI 0.71 to 0.89) (Table 2).
Unadjusted and adjusted differences in cardiovascular risk factors between heterozygous familial hypercholesterolaemia and the general population.
| Unadjusted | Adjusted | |||
|---|---|---|---|---|
| Difference/OR (95% CI) | Difference/OR (95% CI) | |||
| Age, years | −0.03 | 0.937 | ||
| (−0.67, 0.62) | ||||
| Women, OR | 1.00 | 1.000 | ||
| (0.91, 1.10) | ||||
| Systolic blood pressure, mmHg | −1.45 | <0.001 | −0.71 | 0.045 |
| (−2.22, −0.67) | (−1.41, −0.02) | |||
| Diastolic blood pressure, mmHg | 0.42 | 0.093 | 0.96 | <0.001 |
| (−0.07, 0.90) | (0.50, 1.41) | |||
| Body mass index, kg/m2 | −0.87 | <0.001 | ||
| (−1.07, −0.66) | ||||
| Waist circumference, cm | −2.19 | <0.001 | ||
| (−2.80, −1.58) | ||||
| LDL-c, mg/dl | 140.14 | <0.001 | 140.71 | <0.001 |
| (137.00, 143.28) | (137.64, 143.78) | |||
| HDL-c, mg/dl | 1.53 | <0.001 | 0.93 | 0.008 |
| (0.81, 2.26) | (0.25, 1.61) | |||
| Current smoking, OR | 0.81 | <0.001 | 0.79 | <0.001 |
| (0.73, 0.91) | (0.71, 0.88) | |||
| Ever smoking, OR | 0.78 | <0.001 | 0.77 | <0.001 |
| (0.71, 0.86) | (0.70, 0.85) | |||
| Former smoking, OR | 0.88 | 0.026 | 0.90 | 0.050 |
| (0.79, 0.99) | (0.80, 1.00) | |||
| Lipid-lowering medication, OR | 43.37 | <0.001 | 60.87 | <0.001 |
| (37.58, 50.04) | (50.87, 72.83) | |||
| Hypertension medication, OR | 1.16 | 0.011 | 1.36 | <0.001 |
| (1.04, 1.31) | (1.18, 1.56) | |||
| Diabetes medication, OR | 1.10 | 0.392 | 1.24 | 0.064 |
| (0.89, 1.36) | (0.99, 1.55) | |||
| Personal history of cardiovascular disease, OR | 18.55 | <0.001 | 24.03 | <0.001 |
| (14.44, 23.84) | (18.44, 31.33) | |||
| Hypertension, OR | 1.04 | 0.389 | 1.20 | 0.002 |
| (0.95, 1.15) | (1.07, 1.35) | |||
| Diabetes, OR | 1.01 | 0.881 | 1.14 | 0.183 |
| (0.84, 1.22) | (0.94, 1.40) | |||
Estimates from linear and logistic regression models. Unadjusted are obtained from the same models as Table 1. Adjusted estimates are calculated from models adjusted by age, sex and body mass index.
OR: odds ratio; CI: confidence interval; LDL-c: low-density lipoprotein cholesterol; HDL-c: high-density lipoprotein cholesterol
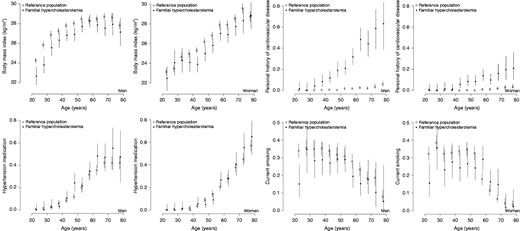
Plots of sex and 5-years-of-age strata of means and percentages of relevant variables. Two plots (one per sex) are created for each variable. Circles (solid for familial hypercholesterolaemia and hollow for the reference population) denote the mean or percentage for each 5-year interval. Vertical lines are the 95% confidence interval of the estimation.
Subsequently, we performed a sub-analysis with identical methodology, selecting 513 HeFH subjects from lipid clinics where 100% of HeFH subjects had information on blood glucose, as described in Methods, and 11,856 subjects of the reference population. The existing differences were very similar to those in the first analysis (Tables 3 and 4).
Clinical characteristics of heterozygous familial hypercholesterolaemia sub-cohort and ENRICA populations matched for age and sex.
| ENRICA | FH registry | ||
|---|---|---|---|
| Mean/% (95% CI) | Mean/% (95% CI) | p | |
| N | 11,797 | 513 | |
| Age, years | 49.9 | 49.9 | 0.955 |
| (49.6, 50.1) | (48.7, 51.2) | ||
| Women, % | 54.8 | 54.8 | 1.000 |
| (53.8, 55.8) | (50.4, 59.0) | ||
| Systolic blood pressure, mmHg | 129.0 | 129.8 | 0.344 |
| (128.7, 129.4) | (128.3, 131.2) | ||
| Diastolic blood pressure, mmHg | 76.9 | 78.8 | <0.001 |
| (76.7, 77.1) | (77.9, 79.7) | ||
| Glucose, mg/dl | 94.2 | 91.7 | 0.001 |
| (93.8, 94.7) | (90.3, 93.2) | ||
| Body mass index, kg/m2 | 27.2 | 26.0 | <0.001 |
| (27.1, 27.3) | (25.6, 26.3) | ||
| Waist circumference, cm | 91.7 | 89.6 | <0.001 |
| (91.5, 92.0) | (88.6, 90.7) | ||
| LDL-c, mg/dl | 126.3 | 258.8 | <0.001 |
| (125.7, 127.0) | (253.1, 264.6) | ||
| HDL-c, mg/dl | 53.7 | 56.6 | <0.001 |
| (53.4, 54.0) | (55.1, 58.1) | ||
| Current smoking, % | 26.1 | 19.9 | 0.002 |
| (25.3, 27.0) | (16.7, 23.6) | ||
| Ever smoking, % | 52.2 | 53.2 | 0.663 |
| (51.2, 53.3) | (48.9, 57.5) | ||
| Former smoking, % | 26.1 | 33.3 | <0.001 |
| (25.2, 27.0) | (29.4, 37.5) | ||
| Lipid-lowering medication, % | 15.6 | 85.6 | <0.001 |
| (14.8, 16.4) | (82.3, 88.4) | ||
| Hypertension medication, % | 18.5 | 22.6 | 0.020 |
| (17.6, 19.3) | (19.2, 26.4) | ||
| Diabetes medication, % | 4.8 | 4.9 | 0.917 |
| (4.3, 5.2) | (3.3, 7.1) | ||
| Personal history of cardiovascular disease, % | 1.0 | 13.1 | <0.001 |
| (0.8, 1.2) | (10.4, 16.3) | ||
| Hypertension, % | 35.1 | 38.4 | 0.129 |
| (34.1, 36.1) | (34.3, 42.7) | ||
| Diabetes, % | 7.0 | 5.5 | 0.182 |
| (6.5, 7.6) | (3.8, 7.8) |
FH: familial hypercholesterolaemia; CI: confidence interval; LDL-c: low-density lipoprotein cholesterol; HDL-c: high-density lipoprotein cholesterol
Unadjusted and adjusted differences in cardiovascular risk factors between the heterozygous familial hypercholesterolaemia sub-cohort and the general population.
| Unadjusted | Model 1 | |||
|---|---|---|---|---|
| Difference/OR (95% CI) | Difference/OR (95% CI) | |||
| Age, years | 0.04 | 0.955 | ||
| (−1.22, 1.29) | ||||
| Women, OR | 1.00 | 1.000 | ||
| (0.84, 1.20) | ||||
| Systolic blood pressure, mmHg | 0.71 | 0.344 | 1.67 | 0.009 |
| (−0.76, 2.17) | (0.41, 2.93) | |||
| Diastolic blood pressure, mmHg | 1.92 | <0.001 | 2.66 | <0.001 |
| (1.01, 2.83) | (1.80, 3.51) | |||
| Glucose, mg/dl | −2.48 | 0.001 | −1.41 | 0.071 |
| (−4.01, −0.95) | (−2.94, 0.12) | |||
| Body mass index, kg/m2 | −1.19 | <0.001 | ||
| (−1.58, −0.81) | ||||
| Waist circumference, cm | −2.10 | <0.001 | ||
| (−3.23, −0.98) | ||||
| LDL-c, mg/dl | 132.50 | <0.001 | 133.77 | <0.001 |
| (126.71, 138.29) | (127.92, 139.62) | |||
| HDL-c, mg/dl | 2.82 | <0.001 | 2.12 | 0.005 |
| (1.29, 4.34) | (0.64, 3.61) | |||
| Current smoking, OR | 0.70 | 0.002 | 0.67 | 0.001 |
| (0.56, 0.88) | (0.54, 0.85) | |||
| Ever smoking, OR | 1.04 | 0.663 | 1.05 | 0.624 |
| (0.87, 1.24) | (0.87, 1.26) | |||
| Former smoking, OR | 1.42 | <0.001 | 1.49 | <0.001 |
| (1.17, 1.71) | (1.22, 1.81) | |||
| Lipid-lowering medication, OR | 32.10 | <0.001 | 52.92 | <0.001 |
| (24.91, 41.38) | (37.89, 73.91) | |||
| Hypertension medication, OR | 1.29 | 0.020 | 1.60 | <0.001 |
| (1.04, 1.60) | (1.25, 2.06) | |||
| Diabetes medication, OR | 1.02 | 0.917 | 1.18 | 0.462 |
| (0.68, 1.55) | (0.76, 1.83) | |||
| Personal history of cardiovascular disease, OR | 15.24 | <0.001 | 18.55 | <0.001 |
| (10.68, 21.74) | (12.64, 27.22) | |||
| Hypertension, OR | 1.15 | 0.129 | 1.40 | 0.002 |
| (0.96, 1.38) | (1.13, 1.74) | |||
| Diabetes, OR | 0.77 | 0.182 | 0.86 | 0.481 |
| (0.52, 1.13) | (0.57, 1.30) | |||
Estimates from linear and logistic regression models. Unadjusted are obtained from the same models as Table 1. Model 1: adjusted estimates are calculated from models adjusted by age, sex and body mass index.
OR: odds ratio; CI: confidence interval; LDL-c: low-density lipoprotein cholesterol; HDL-c: high-density lipoprotein cholesterol
We analysed whether the higher prevalence of CVD among HeFH could be responsible for the CVD risk factors differences found between cohorts. HeFH subjects without CVD from the HeFH showed lower BMI and blood glucose, and prevalence of current smokers and T2DM, and higher mean diastolic blood pressure than the general population (Table 5). The differences in T2DM disappeared after adjustment for age, gender and BMI; however, this adjustment showed higher prevalence of hypertension and anti-hypertensive drugs in HeFH (Table 5). Identical results, with the exception in the prevalence of hypertension but with similar higher diastolic blood pressure, were observed when the whole HeFH group was analysed (Supplementary Material Table 1 online). Regarding only subjects under lipid-lowering treatment, which are most of the HeFH group, still shows reduced prevalence of T2DM among HeFH (Supplementary Tables 2 and 3). Finally, we analysed adjusted differences between both cohorts without CVD but in genetically confirmed familial hypercholesterolaemia (Supplementary Table 4). In this last analysis, all differences remained significant except for the prevalence of hypertension.
Unadjusted and adjusted differences in cardiovascular risk factors between the heterozygous familial hypercholesterolaemia sub-cohort and the general population in absence of cardiovascular disease.
| Unadjusted | p | Adjusted | p | |
|---|---|---|---|---|
| Age, years | −1.03 | 0.135 | ||
| (−2.38, 0.32) | ||||
| Women, OR | 1.17 | 0.105 | ||
| (0.97, 1.42) | ||||
| Systolic blood pressure, mmHg | 0.10 | 0.897 | 1.99 | 0.004 |
| (−1.47, 1.68) | (0.64, 3.34) | |||
| Diastolic blood pressure, mmHg | 1.74 | <0.001 | 2.86 | <0.001 |
| (0.76, 2.71) | (1.95, 3.76) | |||
| Glucose, mg/dl | −3.02 | <0.001 | −1.28 | 0.137 |
| (−4.67, −1.36) | (−2.97, 0.41) | |||
| Body mass index, kg/m2 | −1.42 | <0.001 | ||
| (−1.83, −1.01) | ||||
| Waist circumference, cm | −3.08 | <0.001 | ||
| (−4.27, −1.90) | ||||
| LDL-c, mg/dl | 132.38 | <0.001 | 134.50 | <0.001 |
| (126.08, 138.67) | (128.10, 140.90) | |||
| HDL-c, mg/dl | 3.65 | <0.001 | 2.44 | 0.003 |
| (2.01, 5.29) | (0.86, 4.03) | |||
| Current smoking, OR | 0.76 | 0.020 | 0.72 | 0.006 |
| (0.60, 0.96) | (0.56, 0.91) | |||
| Ever smoking, OR | 0.97 | 0.722 | 0.99 | 0.946 |
| (0.80, 1.17) | (0.82, 1.21) | |||
| Former smoking, OR | 1.23 | 0.056 | 1.35 | 0.007 |
| (1.00, 1.51) | (1.09, 1.67) | |||
| Lipid-lowering medication, OR | 28.18 | <0.001 | 47.23 | <0.001 |
| (21.76, 36.48) | (33.42, 66.74) | |||
| Hypertension medication, OR | 0.99 | 0.961 | 1.37 | 0.033 |
| (0.78, 1.27) | (1.03, 1.82) | |||
| Diabetes medication, OR | 0.81 | 0.414 | 1.07 | 0.798 |
| (0.50, 1.33) | (0.63, 1.81) | |||
| Hypertension, OR | 0.97 | 0.796 | 1.31 | 0.026 |
| (0.80, 1.19) | (1.03, 1.66) | |||
| Diabetes, OR | 0.61 | 0.036 | 0.78 | 0.336 |
| (0.38, 0.97) | (0.48, 1.29) |
Estimates from linear and logistic regression models. Unadjusted are obtained from the same models as Table 1. Adjusted estimates are calculated from models adjusted by age, sex and body mass index.
OR: odds ratio; CI: confidence interval; LDL-c: low-density lipoprotein cholesterol; HDL-c: high-density lipoprotein cholesterol
Discussion
In the present work, we have analysed different CVD risk factors in subjects with HeFH and compared their prevalence with a representative population of the same country. The main results are that patients with HeFH have lower prevalence of certain CVD risk factors than the general population in spite of a much higher prevalence of CVD. Considering that these risk factors are influenced strongly by environmental factors,26 our results suggest that a healthier lifestyle in HeFH may be a major contributor to these findings. These differences are present early in life, supporting the idea that the familial environment induces a higher consciousness about CVD.27 This seems to be obvious because of the history of precocious CVD in most of these families.28 In addition, medical intervention seems to play a major role. A relevant fact of our data is that the treatment of risk factors not directly dependent on cholesterol, that is, T2DM, hypertension and smoking, is higher in subjects with HeFH than in subjects of the general population, which probably translates into a greater contact with a highly specialized health system that favours the diagnosis and treatment of all risk factors.29
It is well known that the prevalence of T2DM is lower in patients with HeFH.12,13 In our study it appears that a large part of this lower prevalence could be related to the fact that BMI is lower at any age than in the general population. Without being able to rule out that familial hypercholesterolaemia itself causes or plays a role in the control of weight in these subjects, it does not seem that this is a relevant factor since the genes related to the familial hypercholesterolaemia (LDLR, APOB, PCSK9 and APOE) have not been related to the inter-individual variation of weight in the general population.30,31 Therefore, it seems reasonable that the HeFH subjects are thinner due to environmental factors probably linked to a healthier lifestyle since childhood and the aforementioned medical intervention. This environmental action is in line with the observed data of smoking that shows that HeFH subjects smoke less from early stages of life, as previously reported.32 However, previous studies used different populations as controls, including non-affected relatives, and the bias of a shared environment makes interpretation difficult.12,33
The differences attributed to the prevalence of T2DM in subjects with familial hypercholesterolaemia have been attributed to a lower disposition of the pancreatic beta cell when LDL cholesterol uptake is defective in the presence of mutations in the receptor.34 This defect in peripheral uptake would be compensated for by an increase in endogenous cholesterol synthesis. In accordance with this hypothesis, the genetic variation in HMGCR, the gene responsible for intracellular cholesterol synthesis, is associated with the risk of T2DM and variants with gain of function are associated with T2DM.35 However, whether or not this phenomenon is responsible for the lower risk in familial hypercholesterolaemia is unknown. Without being able to rule out that the genetic factors that cause familial hypercholesterolaemia play a causal role, our data suggest that environmental factors, such as a lower weight, are important to explain a large part of the phenomenon. This would explain a previously known fact: the lower prevalence of T2DM occurs in subjects with familial hypercholesterolaemia with independence in the presence or absence of a mutation in the candidate gene, implying that it is the familial hypercholesterolaemia itself, or as we suggest with our data, the healthier behaviour that it prompts, and not the molecular cause, that is responsible for the described reduced prevalence of diabetes.13
The use of statins is associated with the risk of T2DM.36 Our HeFH cohort, where most subjects take statins for many years, shows that prevalence of T2DM is not increased, which emphasizes the value of a healthy lifestyle in the prevention of T2DM in subjects with high doses of statins.37 The risk of T2DM in statin users is increased in those who had predisposition factor for T2DM, such as obesity or metabolic syndrome, and independent of the concentration of LDL cholesterol.13 So, a lower BMI may be an important factor explaining this protection against T2DM in familial hypercholesterolaemia.
It is noteworthy that subjects with HeFH have higher diastolic blood pressure, higher prevalence of hypertension and higher anti-hypertensive drug treatment than the general population in spite of a lower BMI. The association of hypertension with familial hypercholesterolaemia has not been studied in depth previously. A recent report from our country in a different population has found almost double prevalence of hypertension among clinically defined HeFH.38 Whether this phenomenon is related to a closer medical control and discovery, a higher prevalence of anti-hypertensive drugs associated with CVD, a true higher prevalence of hypertension, a misdiagnosis of some clinically defined HeFH but truly having familial combined hyperlipidaemia, which is a phenotype highly related to hypertension,39 or a disorder causally associated with familial hypercholesterolaemia, cannot be concluded from our study, although our analysis suggests that it is the result of the combination of all these circumstances.
Our study has some limitations. The diagnosis of tobacco consumption is self-reported by patients and this may cause underestimation in the medical environment of a lipid unit and there may be biases with respect to an interview in the patient’s own home. However, the differences are important enough to be hardly explained by this phenomenon. Similarly, the diagnosis of hypertension has been made in both studies according to the figures of blood pressure and medication, and blood pressure at home is usually lower than the clinical blood pressure. However, our study has important strengths: the high number of subjects studied in both samples, the control population being representative of the same population from which subjects with familial hypercholesterolaemia are extracted, and the homogeneous criteria used for the diagnosis of the main risk factors.
In conclusion, subjects with HeFH have a different prevalence of CVD risk factors than the general population. This includes a lower mean BMI, which could explain much of the lower prevalence of diabetes in this population, and a lower frequency of current smoking, but they have higher hypertension prevalence.
Supplemental Material
CPR896138 Supplemental Material - Supplemental material for Behavioural cardiovascular risk factors and prevalence of diabetes in subjects with familial hypercholesterolaemia
Supplemental material, CPR896138 Supplemental Material for Behavioural cardiovascular risk factors and prevalence of diabetes in subjects with familial hypercholesterolaemia by Sofia Perez-Calahorra, Fernando Civeira, Pilar Guallar-Castillón, Xavier Pinto, José R Banegas, Juan Pedro-Botet, Manuel Suarez-Tembra, Marta Mauri, Cristina Soler, Fernando Rodriguez-Artalejo and Martín Laclaustra in European Journal of Preventive Cardiology
Author contribution
Both authors FR-A and ML should be considered senior authors in this work. All authors contributed to the study conception and design. Material preparation and data collection were performed by all authors. Data analysis was performed and the first draft of the manuscript was written by SP-C, FC and ML, and all authors commented on previous versions of the manuscript. All authors read and approved the final manuscript.
Declaration of conflicting interests
The author(s) declared no potential conflicts of interest with respect to the research, authorship, and/or publication of this article.
Funding
The author(s) disclosed receipt of the following financial support for the research, authorship, and/or publication of this article: This study was funded by CIBERCV (grant number CB16/11/00451) and Sociedad Española de Arteriosclerosis (SEA 2019).

Comments