


Abstract
There are important ethnic differences in the prevalence of hypertension and hypertension-mediated cardiovascular complications, but there is ongoing debate on the nature of these differences. We assessed the contribution of lifestyle, socio-economic and psychosocial variables to ethnic differences in hypertension prevalence.
We used cross-sectional data from the Healthy Life In an Urban Setting (HELIUS) study, including 21,520 participants aged 18–70 years of South-Asian Surinamese (n = 3032), African Surinamese (n = 4124), Ghanaian (n = 2331), Turkish (n = 3594), Moroccan (n = 3891) and Dutch (n = 4548) ethnic origin. Ethnic differences in hypertension prevalence rates were examined using logistic regression models.
After adjustment for a broad range of variables, significant higher hypertension prevalence compared to the Dutch population remained in Ghanaian men (odds ratio 2.62 (95% confidence interval 2.14–3.22)) and women (4.16 (3.39–5.12)), African Surinamese men (1.62 (1.37–1.92)) and women (2.70 (2.29–3.17)) and South-Asian Surinamese men (1.22 (1.15–1.46)) and women (1.84 (1.53–2.22)). In contrast, Turkish men (0.72 (0.60–0.87)) and Moroccan men (0.50 (0.41–0.61)) and women (0.57 (0.46–0.71)) had a lower hypertension prevalence compared with the Dutch population. The differences in hypertension prevalence were present across different age groups and persisted after stratification for body mass index and waist-to-hip ratio.
Large ethnic differences in hypertension prevalence exist that are already present in young adulthood. Adjustment for common variables known to be associated with a higher risk of hypertension explained the higher adjusted prevalence rates among Turks and Moroccans, but not in African and South-Asian descent populations who remained to have a higher rate of hypertension compared to the Dutch host population.
Introduction
Globally, hypertension remains the leading risk factor for incident cardiovascular disease.1 However, the prevalence of hypertension varies significantly across different ethnic groups and along geographic boundaries. In high income countries, various studies have shown significant differences in blood pressure and the prevalence of hypertension across ethnic minority groups.2–4 The origin of these ethnic differences has been subject of debate.5,6 While differences in the distribution of socio-economic, psychosocial and lifestyle factors have been proposed as the principal cause of ethnic differences in hypertension prevalence by some, others have underlined the importance of differences in ethnic-specific physiological traits as a major contributing factor. For example, different studies have shown that African descent populations are more salt-sensitive and have a higher vascular resistance compared to Western European descent populations.7,8 However, increased salt-sensitivity is also associated with adiposity, suggesting that the origin of ethnic differences in salt-sensitive hypertension may also relate to differences in lifestyle.9 Most epidemiologic studies on hypertension did not adjust for, or separately assess the contribution of, major determinants of hypertension. Also, previous studies mostly focused on African and South-Asian origin populations, while data on other major ethnic minority groups in Europe, in particular from North-Africa and the Middle East, are still limited. We examined the contribution of lifestyle, socio-economic and psychosocial variables to ethnic differences in hypertension prevalence in a large multi-ethnic population-based study, and assessed the age-specific hypertension prevalence across the various ethnic groups.
Methods
Study population
The aims and design of the Healthy Life in an Urban Setting (HELIUS) study have been described in detail elsewhere.10 In brief, the HELIUS study is a large-scale prospective cohort study on health and health-care utilization among different ethnic groups living in Amsterdam, the Netherlands. Baseline data collection took place in 2011–2015 and included people aged 18–70 years living in Amsterdam, including African Surinamese, South-Asian Surinamese, Turkish, Moroccan, Ghanaian and Dutch origin people. Data were collected by questionnaire and a physical examination (including collection of biological samples). The study protocols were approved by the Academic Medical Center (AMC) Ethical Review Board, and all participants provided written informed consent.
For the current analysis, baseline data were used from 22,165 participants. We excluded individuals with missing data on blood pressure (BP) or obesity (n = 91), and also excluded individuals of Javanese Surinamese origin (n = 233), other/unknown Surinamese origin (n = 267) and subjects with other or unknown ethnic origin (n = 48) due to small numbers. This resulted in a dataset consisting of 21,520 participants including 3032 South-Asian Surinamese, 4124 African Surinamese, 2331 Ghanaian, 3594 Turkish, 3891 Moroccan and 4548 Dutch origin participants.
Definitions and measurements
Ethnic origin was defined according to the country of birth of the participant as well as that of his/her parents. For the Dutch sample, we invited people who were born in the Netherlands and whose parents were born in the Netherlands. A participant was considered as of non-Dutch ethnic origin if he/she fulfilled either of the following criteria: he/she was born outside the Netherlands and has at least one of her/his parents born abroad (first generation); or he/she was born in the Netherlands but both parents were born outside the Netherlands (second generation). Surinamese ethnic origin subgroups were classified through self-report, Further details and migration histories of these populations have been given in detail elsewhere.10
Information on alcohol use, current smoking and educational level was obtained by questionnaire. We classified participants as regular alcohol users if they stated to use alcohol four or more times a week. Educational level was based on the highest qualification attained and was categorised into four groups: 1: never been to school or elementary schooling only, 2: lower vocational schooling or lower secondary schooling, 3: intermediate vocational schooling or intermediate/secondary schooling, or 4: university or higher vocational schooling (e.g. post-secondary schooling or university of applied sciences). Physical activity was measured by the Short QUestionnaire to ASsess Health-enhancing physical activity (SQUASH)11 and participants were categorised as achieving the Dutch norm for healthy physical activity (≥5 times a week 30 min moderate intensive activity) or not. Experienced psychological stress at work and/or at home was assessed using two psychological stress items from INTERHEART,12 respondents reporting some periods, several periods or permanent stress on either of these two items were considered to experience stress. Major depressive disorder was assessed through the Patient Health Questionnaire (PHQ)-9.13 Weight and height were measured in duplicate in barefoot subjects wearing light clothing only. Body mass index (BMI) was calculated as weight (kg) divided by height squared (m2). Waist circumference was measured twice using a tape measure at the level midway between the lowest rib margin and the iliac crest, and hip circumference was measured twice at the widest level over the trochanter major. Waist-to-hip ratio (WHR) was calculated as waist circumference divided by hip circumference. Diabetes mellitus (DM) was defined according to self-reported diagnosis of diabetes, a fasting glucose level ≥7.0 mmol/l, and/or the use of glucose lowering medication. BP was measured after the participant had been seated for at least five minutes using a validated semi-automatic oscillometric device (Microlife WatchBP Home; Microlife AG, Switzerland) and using appropriate cuff sizes. The mean of two readings was used for analyses. Hypertension was defined as systolic blood pressure (SBP)≥140 mm Hg, diastolic blood pressure (DBP)≥90 mm Hg, or the use of BP-lowering medication. The estimated glomerular filtration rate (eGFR) was calculated according to the Chronic Kidney Disease Epidemiology Collaboration (CKD-EPI) formula.
Statistical analysis
Baseline characteristics of the study population are described by means with standard deviations for continuous variables, or percentages for categorical variables. Logistic regression analysis was performed to study ethnic differences in hypertension prevalence rates. Since the ethnic differences in hypertension were significantly modified by sex (p < 0.001), all analyses were performed separately for men and women. We performed the regression analyses without and with adjustment for a number of covariates known to be associated with hypertension. Selection of covariates was based on previously established associations with BP or hypertension and a significant correlation with hypertension prevalence in univariate analysis. Covariates included in the analysis were age, measures of obesity (BMI, WHR), other lifestyle variables (achieving the Dutch norm for physical activity, current smoking, regular alcohol use), educational level, psychosocial variables (stress at work and/or home, major depressive disorder), presence of diabetes, and kidney function. To further study whether the ethnic differences in hypertension prevalence were related to age, an age-stratified regression analysis was conducted according to five age categories (18–30 years, 31–40 years, 41–50 years, 51–60 years and 61–70 years). To study whether ethnic differences in WHR and BMI influenced the results of the ethnic differences in hypertension prevalence, we also performed a sensitivity analysis selecting individuals with a normal BMI (<25 kg/m2) and WHR (<0.9 for men and <0.85 for women). All statistical analyses were conducted using IBM SPSS Statistics version 24.
Results
Baseline characteristics of the study population, stratified by ethnicity and sex are shown in Table 1. African Surinamese, South-Asian Surinamese and Ghanaians had a higher hypertension prevalence rate, while Moroccans had a lower hypertension rate compared to the Dutch reference population. Moroccans and Turks were on average younger than the other ethnic groups and also had the lowest average SBP and DBP. Ghanaian and Turkish people had the highest BMI, while South-Asian Surinamese had the most unfavourable WHR.
Characteristics of the study population by sex and ethnicity.
| Dutch | Moroccan | Turkish | South-Asian Surinamese | African Surinamese | Ghanaian | |
|---|---|---|---|---|---|---|
| Men | ||||||
| n | 2084 | 1510 | 1627 | 1366 | 1607 | 902 |
| Age (years) | 46.9 ± 13.8 | 42.1 ± 12.8 | 40.9 ± 12.1 | 44.9 ± 13.6 | 48.1 ± 12.9 | 46.9 ± 11.5 |
| Hypertension (%) | 32.5 | 22.9 | 29.7 | 41.6 | 46.7 | 57.8 |
| SBP (mmHg) | 130 ± 15 | 127 ± 14 | 127 ± 14 | 130 ± 16 | 134 ± 18 | 139 ± 18 |
| DBP (mmHg) | 81 ± 10 | 79 ± 9 | 81 ± 9 | 83 ± 10 | 85 ± 11 | 87 ± 11 |
| BMI (kg/m2) | 25.2 ± 3.8 | 26.7 ± 4.0 | 27.8 ± 4.4 | 25.8 ± 4.2 | 26.3 ± 4.5 | 26.7 ± 3.8 |
| WHR | 0.94 ± 0.07 | 0.94 ± 0.07 | 0.96 ± 0.07 | 0.97 ± 0.08 | 0.93 ± 0.07 | 0.94 ± 0.07 |
| Educational level (%) | ||||||
| 1 (lowest) | 3.4 | 25.6 | 24.6 | 12,9 | 6.6 | 15.9 |
| 2 | 13.6 | 21.9 | 30.8 | 32.5 | 40.8 | 45.9 |
| 3 | 23.4 | 33.5 | 28.5 | 30.8 | 34.0 | 29.4 |
| 4 (highest) | 59.6 | 19.0 | 16.0 | 23.8 | 18.6 | 8.9 |
| Diabetes (%) | 5.5 | 13.3 | 12.5 | 23.7 | 14.0 | 17.6 |
| eGFR<60 ml/min (%) | 1.7 | 0.6 | 0.7 | 2.5 | 1.7 | 1.8 |
| Achieving Dutch norm for physical activity (%) | 73.0 | 56.1 | 50.0 | 58.0 | 68.7 | 62.5 |
| Currently smoking (%) | 26.3 | 26.4 | 41.1 | 39.9 | 42.9 | 7.6 |
| Regular alcohol use (%) | 17.4 | 3.8 | 11.1 | 22.8 | 23.7 | 14.6 |
| Stress at home or work (%) | 70.4 | 63.4 | 66.5 | 61.1 | 53.9 | 47.5 |
| Major depressive disorder (%) | 2.6 | 10.4 | 11.2 | 7.4 | 3.3 | 4.2 |
| Women | ||||||
| n | 2464 | 2382 | 1970 | 1666 | 2519 | 1429 |
| Age (years) | 45.5 ± 14.2 | 39.4 ± 12.9 | 40.0 ± 12.2 | 46.1 ± 13.2 | 47.8 ± 12.3 | 43.4 ± 10.8 |
| Hypertension (%) | 18.5 | 15.5 | 21.2 | 35.6 | 45.6 | 49.3 |
| SBP (mm Hg) | 120 ± 16 | 119 ± 16 | 120 ± 16 | 127 ± 20 | 130 ± 19 | 133 ± 20 |
| DBP (mm Hg) | 74 ± 9 | 72 ± 9 | 75 ± 9 | 78 ± 10 | 80 ± 11 | 83 ± 11 |
| BMI (kg/m2) | 24.4 ± 4.5 | 28.1 ± 5.8 | 29.2 ± 6.6 | 26.7 ± 5.3 | 28.8 ± 5.9 | 29.6 ± 5.4 |
| WHR | 0.84 ± 0.08 | 0.86 ± 0.09 | 0.87 ± 0.09 | 0.90 ± 0.09 | 0.88 ± 0.08 | 0.88 ± 0.08 |
| Educational level (%) | ||||||
| 1 (lowest) | 3.2 | 34.6 | 37.6 | 15.7 | 5.0 | 36.9 |
| 2 | 14.8 | 15.4 | 19.9 | 34.1 | 32.8 | 36.2 |
| 3 | 20.7 | 33.4 | 28.5 | 27.9 | 36.6 | 22.5 |
| 4 (highest) | 61.4 | 16.5 | 13.9 | 22.3 | 25.7 | 4.5 |
| Diabetes (%) | 2.6 | 11.8 | 10.5 | 21.0 | 14.6 | 12.3 |
| eGFR<60 ml/min (%) | 1.2 | 0.5 | 0.5 | 2.1 | 1.1 | 1.1 |
| Achieving Dutch norm for physical activity (%) | 77.8 | 40.9 | 35.0 | 49.6 | 56.2 | 47.3 |
| Currently smoking (%) | 23.5 | 5.4 | 29.1 | 19.0 | 24.6 | 2.5 |
| Regular alcohol use (%) | 21.5 | 1.3 | 3.8 | 13.6 | 19.3 | 11.1 |
| Stress at home or work (%) | 80.2 | 67.2 | 71.2 | 74.9 | 69.3 | 54.7 |
| Major depressive disorder (%) | 3.0 | 11.1 | 15.5 | 11.5 | 6.1 | 4.6 |
BMI: body mass index; DBP: diastolic blood pressure; eGFR: estimated glomerular filtration rate; SBP: systolic blood pressure; SD: standard deviation; WHR: waist hip ratio.
Data are presented as mean±SD (continuous variables) of percentages (categorical variables);
Table 2 displays the odds ratios (ORs) for hypertension in each ethnic group compared with the Dutch reference population, with and without adjustment for a number of lifestyle, socio-economic and psychosocial variables associated with hypertension. In both men and women, age-adjusted ORs for hypertension prevalence were significantly higher for almost all ethnic minority groups with the highest OR in Ghanaians and African Surinamese followed by South-Asian Surinamese and Turkish men and women. Hypertension prevalence was higher in Moroccan women, while Moroccan men had a comparable OR as the Dutch reference population. Adjustment for BMI and WHR resulted in significant attenuation of the ethnic differences in hypertension odds, especially in women, and attenuated or reversed the OR for hypertension for Moroccans and Turkish men. Further adjustment for the remaining study variables did not materially change the differences in ORs for hypertension.
The odds ratio (OR) for being hypertensive in different ethnic groups as compared to Dutch reference population in men and women, before and after adjustment for various potential determinants of hypertension.
| Dutch | Moroccan | Turkish | South-Asian Surinamese | African Surinamese | Ghanaian | |
|---|---|---|---|---|---|---|
| Men | ||||||
| Age | Ref | 0.86 (0.73–1.01) | 1.43 (1.23–1.67) | 1.86 (1.59–2.18) | 1.89 (1.63–2.19) | 3.53 (2.96–4.21) |
| Age, BMI | Ref | 0.64 (0.54–0.76) | 0.90 (0.76–1.06) | 1.74 (1.47–2.04) | 1.70 (1.46– 2.00) | 3.05 (2.54–3.66) |
| Age, WHR | Ref | 0.70 (0.59–0.83) | 0.96 (0.81–1.13) | 1.29 (1.10–1.53) | 2.10 (1.80–2.45) | 3.64 (3.04–4.38) |
| Age, WHR, BMI | Ref | 0.63 (0.52–0.74) | 0.83 (0.70–0.98) | 1.47 (1.24–1.74) | 1.85 (1.58–2.16) | 3.23 (2.68–3.88) |
| Age, BMI, WHR, educational level, smoking, alcohol use, physical activity | Ref | 0.54 (0.45–0.66) | 0.76 (0.63–0.91) | 1.40 (1.17–1.67) | 1.75 (1.48–2.06) | 2.89 (2.36–3.53) |
| Age, BMI, WHR, educational level, smoking, alcohol use, physical activity, stress. major depressive disorder | Ref | 0.54 (0.44–0.65) | 0.75 (0.63–0.91) | 1.38 (1.15–1.64) | 1.71 (1.44–2.02) | 2.79 (2.28–3.43) |
| Age, BMI, WHR, educational level, smoking, alcohol use, physical activity, stress. major depressive disorder, diabetes, eGFR <60 | Ref | 0.50 (0.41–0.61) | 0.72 (0.60–0.87) | 1.22 (1.15–1.46) | 1.62 (1.37–1.92) | 2.62 (2.14–3.22) |
| Women | ||||||
| Age | Ref | 1.67 (1.40–1.98) | 2.72 (2.29–3.23) | 3.29 (2.79–3.88) | 4.83 (4.16–5.61) | 9.95 (8.36–11.83) |
| Age, BMI | Ref | 0.90 (0.75–1.07) | 1.33 (1.10–1.60) | 2.66 (2.25–3.2) | 3.20 (2.74–3.74) | 5.80 (4.84–6.96) |
| Age, WHR | Ref | 1.22 (1.02–1.46) | 2.07 (1.73–2.47) | 2.45 (2.06–2.90) | 4.15 (3.57–4.83) | 7.62 (6.41–9.13) |
| Age, WHR, BMI | Ref | 0.84 (0.70–1.01) | 1.29 (1.07–1.56) | 2.35 (1.98–2.80) | 3.15 (2.70–3.68) | 5.50 (4.59–6.60) |
| Age, BMI, WHR, educational level, smoking, alcohol use, physical activity | Ref | 0.63 (0.51–0.77) | 0.99 (0.80–1.23) | 2.06 (1.71–2.46) | 2.89 (2.46–3.39) | 4.21 (3.44–5.16) |
| Age, BMI, WHR, educational level, smoking, alcohol use, physical activity, stress. major depressive disorder | Ref | 0.63 (0.50–0.78) | 0.99 (0.80–1.23) | 2.07 (1.72–2.48) | 2.88 (2.45–3.39) | 4.33 (3.53–5.32) |
| Age, BMI, WHR, educational level, smoking, alcohol use, physical activity, stress. major depressive disorder, diabetes, eGFR <60 | Ref | 0.57 (0.46–0.71) | 0.94 (0.75–1.16) | 1.84 (1.53–2.22) | 2.70 (2.29–3.17) | 4.16 (3.39–5.12) |
BMI: body mass index; eGFR: estimated glomerular filtration rate; WHR: waist hip ratio.
The age-stratified hypertension prevalence for men and women is presented in Figure 1. Ethnic differences in hypertension prevalence were present from age 30 years onwards with higher ORs for hypertension in African Surinamese and Ghanaians, which remained after adjustment for covariates (Table 3). Moroccan men and women, on the other hand, displayed significant lower ORs for hypertension in all age categories, while individuals of Turkish origin in general had slightly lower ORs of hypertension compared with Dutch, although these differences did not reach statistical significance. Sensitivity analysis among lean subjects (with a normal BMI and WHR) only showed that higher ORs remained in Ghanaians and African Surinamese, while the higher OR disappeared in South-Asian Surinamese (Supplementary Material Table 1). In contrast, Moroccan men and women continued to have a lower OR for hypertension compared to the Dutch reference population.
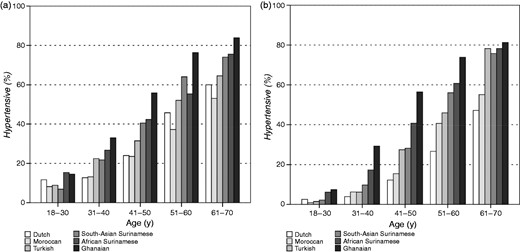
Hypertension prevalence in men (a) and women (b), stratified by ethnicity and age.
The odds ratio (OR) for being hypertensive in different ethnic groups compared to the Dutch reference population in men and women, stratified by age groups.
| 18–30 | 31–40 | 41–50 | 51–60 | 61–70 | |
|---|---|---|---|---|---|
| Men | |||||
| Dutch | Ref | Ref | Ref | Ref | Ref |
| Moroccan | 0.45 (0.25–0.80) | 0.57 (0.35–0.92) | 0.50 (0.34–0.74) | 0.48 (0.34–0.69) | 0.42 (0.25–.72) |
| Turkish | 0.52 (0.30–0.90) | 0.79 (0.49–1.26) | 0.62 (0.43–0.90) | 0.78 (0.56–1.09) | 0.53 (0.28–1.02) |
| South-Asian Surinamese | 0.40 (0.21–0.75) | 0.98 (0.59–1.63) | 1.41 (0.99–2.02) | 1.59 (1.15–2.19) | 0.97 (0.61–1.54) |
| African Surinamese | 1.14 (0.65–2.01) | 1.92 (1.18–3.12) | 2.14 (1.49–3.07) | 1.27 (0.95–1.69) | 1.84 (1.24–2.75) |
| Ghanaian | 1.12 (0.54–2.32) | 1.98 (1.10–3.57) | 2.90 (1.95–4.32) | 3.03 (2.14–4.28) | 2.50 (1.18–5.33) |
| Women | |||||
| Dutch | Ref | Ref | Ref | Ref | Ref |
| Moroccan | 0.26 (0.09–0.78) | 0.66 (0.33–1.33) | 0.46 (0.30–0.69) | 0.66 (0.46–0.94) | 0.42 (0.24–0.75) |
| Turkish | 0.36 (0.12–1.10) | 0.48 (0.23–1.02) | 0.98 (0.66–1.43) | 0.90 (0.62–1.31) | 1.09 (0.54–2.19) |
| South-Asian Surinamese | 0.62 (0.21–1.86) | 1.12 (0.54–2.35) | 1.56 (1.08–2.25) | 2.16 (1.62–2.89) | 2.00 (1.30–3.08) |
| African Surinamese | 1.56 (0.64–3.77) | 2.44 (1.29–4.62) | 2.74 (1.97–3.81) | 2.72 (2.11–3.50) | 2.21 (1.55–3.14) |
| Ghanaian | 2.94 (1.09–7.98) | 3.51 (1.79–6.90) | 3.63 (2.51–5.25) | 4.13 (2.91–5.87) | 1.70 (0.62–4.64) |
BMI: body mass index; eGFR: estimated glomerular filtration rate; WHR: waist hip ratio.
ORs are adjusted for BMI, WHR, educational level, physical activity, current smoking, regular alcohol use, stress major depressive disorder, eGFR and diabetes mellitus.
Discussion
We show that large differences in hypertension prevalence exist among six ethnic groups living in the Netherlands. These differences in hypertension prevalence were already present in young adulthood and were larger for women than for men, with five- to 10-fold higher odds of hypertension in African-origin (African Surinamese and Ghanaian) participants as compared with those of Dutch origin. Adjustment for a broad spectrum of lifestyle, socio-economic and psychosocial variables could only partially explain the observed ethnic differences in hypertension prevalence, which remained two-fold higher in African-origin men and three- to four-fold higher in African-origin women after adjustment. In Moroccan and Turkish men and women, adjustment for BMI and WHR attenuated or reversed differences in hypertension prevalence compared with those of Dutch origin.
Various population-based studies in both Europe and the USA have consistently shown higher hypertension prevalence rates among African-descent populations living in Western societies.3,14,15 For South-Asian descent populations both higher and lower hypertension prevalence rates have been reported, which may be attributable to the heterogeneity of South-Asians living in Europe.16 This study shows not only that hypertension prevalence rates are very high among sub-Saharan African-descent populations, especially among women, but also that South-Asian Surinamese men and women have a higher hypertension prevalence rate compared to the Dutch reference population. In general, our results display a 10-year (men) and 20-year (women) advance in hypertension prevalence rates in African-origin groups as compared with Dutch men and women. For instance, the prevalence rates of Ghanaian women aged 31–40 years exceeded those of Dutch women aged 51–60 years. Moreover, in the age-stratified analyses we found that significant differences in adjusted hypertension risk for Ghanaians and African Surinamese were already present in young adulthood. These findings are in line with results from the Amsterdam Born Children and their Development (ABCD) study which showed higher diastolic BP in children of African descent aged 5–6 years.17 This suggests that besides lifestyle, socio-economic and psychosocial determinants, gene-environment interactions may be an important driving force of the observed ethnic inequalities.
We used WHR in addition to BMI because body fat distribution has been shown to differ between ethnic groups and is an independent determinant of hypertension.18 Compared to the other ethnic groups, South-Asian Surinamese showed a larger reduction in hypertension risk when adjusting for WHR instead of BMI. This suggests that ethnic differences in body fat distribution may have an important contribution in cardiovascular disease risk in this ethnic group. Indeed, evidence from studies conducted in South-Asian populations have shown a stronger association between BMI, percentage of body fat and health risks as compared to European-descent populations.19
Little has been documented about hypertension prevalence in Turkish and Moroccan populations, two of the largest ethnic migrant groups with regard to migration and naturalization in the European Union.20 In our age-adjusted analysis, Moroccans had a substantially lower hypertension prevalence compared to the Dutch reference population, from early adulthood onwards, suggestive of a lower susceptibility for hypertension and hypertension-mediated complications. This is supported by the lower rate of cardiovascular disease (CVD) mortality of Moroccan men in the Netherlands.21 Although acculturation and urbanization have been associated with an increased prevalence of hypertension in ethnic migrant groups,22,23 the hypertension prevalence of Moroccans and Turks found in this study is lower in comparison with those reported in Morocco24 and Turkey.25 Whether this is caused by selection of a relatively healthy subgroup of migrants for work purposes (‘the healthy migrant effect’) or socio-economic differences remains to be determined. It could also be that Turkish and Moroccan populations in the Netherlands have more access to preventative measures than their home countries where CVD and risk factors are rising.
The nature of the globally observed ethnic differences in hypertension prevalence is subject of ongoing debate, and little is known about the contribution of lifestyle, psychosocial and socio-economic determinants to the observed differences in hypertension prevalence.26,27 Two large ethnic studies in the USA, the Atherosclerosis Risk in Communities Study (ARIC) and Multi-Ethnic Study of Atherosclerosis (MESA), conducted in a middle-aged and older multi-ethnic population showed that ethnic differences in hypertension risk remained present in African-descent populations after adjustment for BMI, waist circumference and educational level, while the increased hypertension risk in Hispanics disappeared.28,29 The age-adjusted hypertension prevalence in African-Americans was approximately 1.5-fold in MESA and two-fold in ARIC, compared to Americans of European descent. This suggests that the increased rate of hypertension among African descent populations is at least as high in African migrants in Europe compared to African-Americans in the USA. The finding that the age-adjusted ORs of hypertension in Ghanaians and African Surinamese remained higher in our study, after further adjustment for various other variables known to be associated with hypertension, further supports the concept that other mechanisms may be important.
Indeed, previous studies have shown that genetic variants associated with BP and hypertension risk are highly methylated and that these methylation patterns can be observed in different ethnic groups.30 Whether epigenetic mechanisms may also explain the striking differences observed in hypertension prevalence between ethnic groups remains to be determined. Migration studies have shown that the higher burden of hypertension in certain ethnic groups is highly modifiable through lifestyle and environmental factors, also suggesting an important role for direct environmental factors to explain the ethnic variation in hypertension prevalence.16 However, genetic and environmental factors remain difficult to disentangle given the shared environment often found amongst ethnic communities.
Strengths of this study include the large study sample consisting of the major ethnic minority groups in Europe, which enabled us to thoroughly investigate the ethnic differences in hypertension prevalence within the same setting. Furthermore, we were able to adjust for a broad range of lifestyle, psychosocial and socio-economic determinants. Limitations of this study include its cross-sectional design which makes it impossible to draw any conclusions on causality. The diagnosis of hypertension was made on the average of two BP measurements at a single visit, this might have led to an overestimation of the true prevalence rate, however, we consider the effect on ethnic differences in hypertension prevalence rate to be small. Finally, we did not have data on dietary salt intake and other dietary factors, which may affect BP and hypertension risk, but are also difficult to measure.
In conclusion, we observed large ethnic differences in hypertension prevalence from young adulthood onwards, with African-origin populations showing the highest prevalence rates compared with the Dutch reference population. Lifestyle, psychosocial and socio-economic determinants, particularly BMI and WHR, contributed importantly to the higher hypertension prevalence rate among ethnic minority groups, especially among Turks and Moroccans. However, these variables could not fully explain the observed higher prevalence rates in African and South-Asian origin populations. The high rate of hypertension and obesity observed in different ethnic minority groups and the accompanying health inequalities are an important public health concern. Future studies should focus on dietary influences, (epi)genetic mechanisms and gene-environment interactions to explain the very high residual rate of hypertension observed among different ethnic groups, particularly among individuals of African and South-Asian ancestry.
Acknowledgements
The authors are most grateful to the participants of the HELIUS study and the management team, research nurses, interviewers, research assistants and other staff who took part in gathering the data of this study.
Author contribution
SL, MBS and BB were responsible for the conceptualization of the design. SL did the data analysis. SL and BB drafted the manuscript. MBS contributed to acquisition of the data. All authors contributed to interpretation of the data and critically revised the manuscript. All authors gave final approval and agreed to be accountable for all aspects of work to ensure integrity and accuracy.
Declaration of conflicting interests
The author(s) declared no potential conflicts of interest with respect to the research, authorship and/or publication of this article.
Funding
The author(s) disclosed receipt of the following financial support for the research, authorship, and/or publication of this article: The HELIUS study is conducted by the Academic Medical Center Amsterdam and the Public Health Service of Amsterdam. Both organisations provided core support for HELIUS. The HELIUS study is also funded by the Dutch Heart Foundation (Grant no. 2010T084), the Netherlands Organization for Health Research and Development (ZonMw) (Grant no. 200500003), the European Union (FP‐7) (Grant no. 278901), and the European Fund for the Integration of non-EU immigrants (EIF) (Grant no. 2013EIF013).

Comments