


Abstract
Atherosclerotic cardiovascular disease is highly prevalent in Eastern and Central Europe, where the incidence is the highest in the world. The Kardiovize Brno 2030 study was designed as a prospective cohort study to investigate the complex relationships of cardiovascular disease and outcomes with a range of biological, psychosocial, environmental, behavioral, and economic factors in an urban population of the Czech Republic.
We randomly selected a 1% sample of the city of Brno residents aged 25–64 years stratified by sex and age. The study assessed traditional and novel cardiovascular disease risk factors, including sociodemographic and smoking status, physical activity, diet, depression, stress, body fat, cardio-ankle vascular index, and intima media thickness, complemented by blood tests; biological samples were stored for future analyses.
The study enrolled 2160 participants (54.8% women), with a mean age of 47 ± 11.3 years. They were mostly full-time employed (75.6%) and married (62.1%). Hyperlipidemia was highly prevalent (70.7% in men, and 67.1% in women, NS). Hypertension and diabetes mellitus were more prevalent in men than in women (54.3% vs. 38.7% and 7.1% vs. 3.5%, respectively, P < 0.001 for both). A total of 25.3% of men and 21.9% of women smoked, whereas 20.0% and 43.0% of men and 18.1% and 26.6% of women were obese and overweight, respectively.
Cardiovascular risk factors are highly prevalent in the city of Brno, an urban population from Central Europe. The Kardiovize Brno 2030 study will provide unique multidimensional and longitudinal cardiovascular health data from a region where epidemiological studies are scarce.
Introduction
Cardiovascular diseases (CVDs) cause nearly one-third of all deaths worldwide. Atherosclerotic CVDs, particularly coronary heart disease (CHD), account for the greatest proportion of CVD deaths. CVD risk factors such as hypertension, cigarette smoking, diabetes mellitus or impaired fasting glucose, elevated cholesterol levels, and obesity or overweight are the top causes of death globally.1 Population-based longitudinal studies, conducted globally or within individual countries, have established the role of traditional and novel risk factors in the incidence of CHD.
Despite the remarkable reduction in cardiovascular mortality and morbidity due to improved health behaviors and quality of health care following a major societal transition,2 the Czech Republic and other countries in the region still have one of the highest rates of CVD and deaths among the member states of the European Union and in the world.3
The Czech Republic is one of the few Central and East European countries launching population-based surveillance of cardiovascular risk factors through the WHO MONICA and Czech post-MONICA surveys.4 The Czech post-MONICA study is conducted through periodic cross-sectional population surveys5 in nine predominantly rural districts. However, distinct differences in health exposures and outcomes in urban versus rural populations exist worldwide.6 The Czech post-MONICA cross-sectional design allows monitoring of the prevalence of CVD and its risk factors over time; however, the incidence of CVD events and associated factors cannot be examined. Moreover, the nationwide design of the Czech post-MONICA study limits its potential to assess non-conventional, novel CVD risk factors.
Inspired by the milestone projects of the 20th century such as the Framingham Heart Study and the Minnesota Heart Health Program,1 Kardiovize Brno 20307 was conceived and conducted as a prospective cohort study of an urban population in the Czech Republic. The primary objectives of the Kardiovize Brno 2030 cohort were: (a) to assess the prevalence of conventional and novel cardiovascular risk factors in adults aged 25–64 years in the city of Brno; (b) to assess their change over time; and (c) to investigate the incidence of CVD events over time. Secondary objectives included: (a) analyses of the complex relationships of social, behavioral and environmental factors and the incidence of CVD and other outcomes; and (b) genetic analyses of biological samples to elucidate inherited risk profiles.
Methods
Study design
Kardiovize Brno 2030 is an ongoing multidisciplinary epidemiological project with a random stratified by sex and gender sample of 25–64-year-old residents of the city of Brno designed as a prospective cohort. The recruitment and core baseline examinations were completed in 2014. A few additional measurements including cognitive tests were completed in 2015–2016. Follow-up will be carried out regularly at 5-year intervals, with the first follow up planned for 2018–2019. It is envisioned that the study will run until 2030.
The follow-up health interview along with the examinations will be administered similar to the baseline, with minimal modifications, to ensure comparability.
We will collect outcome information, such as the incidence of CVD, directly from the study participants during follow-up visits and, whenever possible, these data will be confirmed using medical reports. We will use standard definitions of myocardial infarction, percutaneous coronary revascularization, stable angina with documented myocardial ischemia, stroke, heart failure and atrial fibrillation. The deaths will be verified based on the city’s official registry data.
Study population
Brno is the second largest city in the Czech Republic (after Prague with a population of 1.2 million) and an emerging technology, science and international education hub in Central Europe. As of 1 January 2013, Brno had a general population of 373,327 residents, including 106,512 men and 109,293 women.8
The study aimed to enroll 1% of the adult population of Brno randomly selected and stratified by sex and age. Eligibility criteria included age (25–64 years), permanent residence in Brno, and registration (required by the law) with any of the five health insurance companies operating in the Czech Republic.
Survey sampling was done in January 2013 with the technical assistance from the largest (state-run) health insurance company using the registries of all health insurance companies, except one that declined to cooperate (thus excluding 8.9% of the population). A random stratified sample of 3300 persons adjusted for a response rate of 64.4% (as projected from the Czech post-MONICA study)9 was drawn from the registries. The health insurance companies mailed invitation letters with a description of the study goals while ensuring the confidentiality of personal information. The invitees were asked to provide a preliminary consent through phone call, e-mail, or prepaid mail. The invitation letters were mailed in January 2013, with two reminder mailings. Following the same procedure, another random sample of 3077 was selected in April 2014; the study target of 1% of the adult urban population was met on 19 December 2014. Based on the two samplings with a total 6377 randomly selected invitees, the overall response rate was 33.9% (Figure 1). No information on non-respondents was available due to confidentiality restrictions. Despite the relatively low response rate, the number of enrolled participants was large enough to ensure optimal representativeness of sociodemographic strata in the sample.
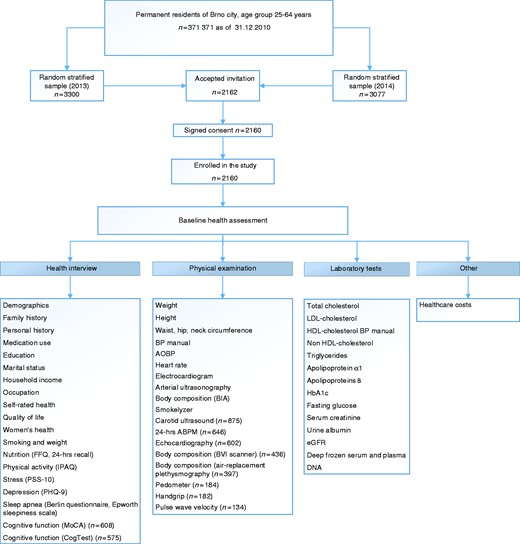
Study recruitment and baseline data collection.
Data collection
Baseline health assessment
The baseline health assessment was performed by trained nurses and physicians at St Anne’s University Hospital in Brno, who also entered the collected data into the web-based research electronic data capture (REDCap) database.10 The baseline health assessment included a comprehensive health interview, anthropological, device-assisted examination and laboratory tests including the collection and storage of biosamples (Figure 1).
Health interview
The face-to-face health interview was carried out by a physician using a comprehensive questionnaire.9 It included demographics and socioeconomic status (age, gender, education, household income, and occupation) (Table 1), cardiovascular risk behaviors (smoking status, nutrition, alcohol consumption, and physical activity) (Table 2), history (family and personal, medications, and hospitalizations) (Table 3), mental health (depression, stress level) and sleep disorders (obstructive sleep apnea, daytime sleepiness).
Baseline cohort: sociodemographic data by gender.
| Variable, n (%) | Total n = 2160 | Men n = 977 | Women n = 1183 | P value |
|---|---|---|---|---|
| Age, mean (SD) | 47.3 (11.3) | 46.7 (11.3) | 47.8 (11.3) | 0.03 |
| Age group, years | 0.25 | |||
| 25–34 | 347 (16.1) | 168 (17.2) | 179 (15.1) | |
| 35–44 | 357 (24.7) | 252 (25.8) | 285 (24.1) | |
| 45–54 | 568 (26.3) | 256 (26.2) | 312 (26.4) | |
| 55–64 | 708 (32.8) | 301 (30.8) | 407 (34.4) | |
| Marital status | <0.001 | |||
| Single | 408 (19.0) | 207 (21.3) | 210 (17.0) | |
| Married | 1336 (62.1) | 639 (65.7) | 697 (59.1) | |
| Divorced | 341 (15.8) | 116 (11.9) | 225 (19.1) | |
| Widowed | 68 (3.2) | 11 (1.1) | 57 (4.8) | |
| Education | <0.001 | |||
| Primary | 427 (19.8) | 203 (20.8) | 224 (19.0) | |
| Secondary | 889 (41.3) | 350 (35.9) | 539 (60.6) | |
| Higher | 836 (38.9) | 422 (43.3) | 414 (35.2) | |
| Household income (CZK) | <0.001 | |||
| Low (<30,000) | 877 (43.4) | 315 (34.1) | 562 (51.2) | |
| Middle (30,000–45,000) | 632 (31.3) | 313 (33.8) | 319 (29.1) | |
| High (>45,000) | 513 (25.4) | 297 (32.1) | 216 (19.7) | |
| Occupation | <0.001 | |||
| Manager/self-employed | 692 (32.3) | 417 (42.9) | 275 (23.5) | |
| Skilled/professional | 1234 (57.6) | 479 (49.2) | 755 (64.5) | |
| Non-skilled/junior | 141 (4.9) | 47 (4.8) | 67 (8.0) | |
| Unemployed | 77 (3.6) | 30 (3.1) | 47 (4.0) | |
| Employment type | <0.001 | |||
| Full-time | 1559 (75.6) | 813 (86.5) | 746 (66.5) | |
| Part-time/disability | 172 (8.34) | 54 (5.7) | 118 (10.5) | |
| Retired/housekeeping | 331 (16.1) | 73 (7.8) | 258 (23.0) | |
| Household size | 0.04 | |||
| Small (1–2 persons) | 1094 (50.8) | 467 (47.9) | 627 (53.3) | |
| Medium (3–4 persons) | 950 (44.1) | 457 (46.8) | 493 (41.9) | |
| Large (5–6 persons) | 108 (5.0) | 52 (5.3) | 56 (4.8) |
P value, Pearson chi-square test for categorical and t-test for continuous variables.
CZK: Czech koruna.
Baseline cohort: cardiovascular risk factors by gender and age group.
| Men n = 977 | Women n = 1183 | |||||||||||||
|---|---|---|---|---|---|---|---|---|---|---|---|---|---|---|
| CVD risk factors | All n = 2160 | All ages | 25–34 | 35–44 | 45–54 | 55–64 | P value | All ages | 25–34 | 35–44 | 45–54 | 55–64 | P value | *P value |
| Smoking, (%/n) | <0.001 | 0.270 | <0.001 | |||||||||||
| Never | 51.1 (1100) | 45.1 (440) | 51.2 (86) | 54.4 (137) | 44.5 (114) | 34.3 (103) | 56.1 (660) | 57.0 (102) | 61.6 (175) | 56.5 (175) | 51.5 (208) | |||
| Current | 23.5 (505) | 25.3 (247) | 28.0 (47) | 24.6 (62) | 25.8 (66) | 24.0 (72) | 21.9 (258) | 20.1 (36) | 19.0 (54) | 22.6 (70) | 24.3 (98) | |||
| Past | 25.5 (548) | 29.6 (289) | 20.8 (35) | 21.0 (53) | 29.7 (76) | 41.7 (125) | 22.0 (259) | 22.9 (41) | 19.4 (55) | 21.0 (65) | 24.3 (98) | |||
| Physical activity, (%/n) | ns | ns | 0.01 | |||||||||||
| High | 54.3 (1172) | 52.8 (516) | 50.6 (85) | 49.6 (125) | 56.6 (145) | 53.5 (161) | 55.5 (656) | 54.8 (98) | 57.2 (163) | 55.8 (174) | 54.3 (221) | |||
| Moderate | 31.4 (678) | 30.4 (297) | 35.1 (59) | 32.5 (82) | 26.6 (68) | 29.2 (88) | 32.2 (381) | 34.6 (62) | 30.9 (88) | 32.1 (100) | 32.2 (131) | |||
| Low | 14.4 (310) | 16.8 (164) | 14.3 (24) | 17.9 (45) | 16.8 (43) | 17.3 (52) | 12.3 (146) | 10.6 (19) | 11.9 (34) | 12.2 (38) | 13.5 (55) | |||
| Fruit and vegetable consumption, (%/n) | ns | ns | <0.001 | |||||||||||
| Less than daily | 84.4 (1821) | 90.8 (887) | 94.6 (159) | 91.3 (230) | 89.8 (229) | 89.4 (269) | 79.2 (934) | 79.3 (142) | 78.9 (224) | 80.7 (251) | 78.1 (317) | |||
| Daily (≥1 a day) | 15.5 (335) | 9.1 (89) | 5.4 (9) | 8.7 (22) | 10.2 (26) | 10.6 (32) | 20.6 (246) | 20.7 (37) | 21.1 (60) | 19.3 (60) | 21.9 (246) | |||
| BMI, mean (SD) | 26.1 (5.1) | 26.9 (4.5) | 25.4 (4.5) | 25.9 (4.0) | 27.4 (5.0) | 28.0 (4.1) | <0.001 | 25.5 (5.4) | 22.1 (3.5) | 24.0 (4.4) | 26.2 (5.3) | 27.6 (5.8) | <0.001 | |
| BMI, (%/n) | <0.001 | <0.001 | <0.001 | |||||||||||
| Underweight | 2.2 (48) | 1.1 (11) | 1.8 (3) | 2.4 (6) | 0.4 (1) | 0.3 (1) | 3.1 (37) | 10.1 (18) | 2.8 (8) | 1.6 (5) | 1.5 (6) | |||
| Normal weight | 44.8 (967) | 35.8 (350) | 50.6 (85) | 40.9 (103) | 32.4 (83) | 26.3 (79) | 52.2 (617) | 72.1 (129) | 65.3 (186) | 48.7 (152) | 36.9 (150) | |||
| Overweight | 34.0 (735) | 43.0 (420) | 35.1 (59) | 42.9 (108) | 45.7 (117) | 45.2 (136) | 26.6 (315) | 15.1 (27) | 21.8 (62) | 29.8 (93) | 32.7 (133) | |||
| Obese | 19.0 (410) | 20.1 (196) | 12.5 (21) | 13.9 (35) | 21.5 (55) | 28.2 (85) | 18.1 (214) | 2.8 (5) | 10.2 (29) | 19.9 (62) | 29.0 (118) | |||
| Blood pressure | ||||||||||||||
| Systolic, mean (SD) | 127.3 (15.7) | 131.2 (14.6) | 127.3 (12.4) | 126.7 (12.8) | 130.7 (13.9) | 137.4 (15.7) | <0.001 | 124.0 (15.8) | 115.6 (11.0) | 117.8 (13.5) | 124.0 (13.9) | 132.2 (16.5) | <0.001 | <0.001 |
| Diastolic, mean (SD) | 82.4 (9.4) | 85.4 (9.1) | 83.1 (9.1) | 84.5 (8.5) | 86.6 (8.9) | 86.5 (9.4) | <0.001 | 79.9 (9.0) | 76.3 (7.3) | 77.5 (8.7) | 80.5 (8.7) | 82.8 (9.2) | <0.001 | <0.001 |
| High blood pressure, (%/n) | 31.2 (673) | 41.3 (403) | 32.1 (54) | 30.6 (77) | 45.3 (116) | 51.8 (156) | <0.001 | 22.8 (270) | 7.3 (13) | 13.7 (39) | 19.6 (61) | 38.6 (157) | <0.001 | <0.001 |
| Hypertension, (%/n) | 45.7 (974) | 54.3 (523) | 37.6 (62) | 38.9 (96) | 57.5 (145) | 73.6 (220) | <0.001 | 38.7 (451) | 11.8 (21) | 20.9 (58) | 38.6 (119) | 62.8 (253) | <0.001 | <0.001 |
| Serum lipids, mean (SD) | ||||||||||||||
| Total cholesterol | 5.2 (1.2) | 5.1 (1.2) | 4.6 (0.9) | 5.0 (1.0) | 5.4 (1.5) | 5.2 (1.0) | <0.001 | 5.2 (1.1) | 4.7 (0.9) | 4.8 (0.8) | 5.4 (1.1) | 5.6 (1.2) | <0.001 | 0.054 |
| LDL-cholesterol | 3.1 (0.9) | 3.1 (0.9) | 2.8 (0.8) | 3.1 (0.9) | 3.2 (0.8) | 3.2 (0.9) | <0.001 | 3.1 (0.9) | 2.5 (0.7) | 2.7 (0.7) | 3.3 (0.8) | 3.5 (1.0) | <0.001 | ns |
| HDL-cholesterol | 1.5 (0.4) | 1.3 (0.4) | 1.4 (0.4) | 1.3 (0.4) | 1.3 (0.3) | 1.3 (0.3) | <0.001 | 1.7 (0.4) | 1.8 (0.4) | 1.7 (0.4) | 1.7 (0.4) | 1.7 (0.4) | ns | <0.001 |
| Non-HDL-cholesterol | 3.7 (1.1) | 3.8 (1.2) | 3.2 (0.9) | 3.7 (1.0) | 4.0 (1.6) | 3.9 (1.0) | <0.001 | 3.6 (1.0) | 2.9 (0.8) | 3.2 (0.8) | 3.7 (1.0) | 4.0 (1.1) | <0.001 | <0.001 |
| Triglycerides | 1.3 (1.5) | 1.5 (2.2) | 1.3 (0.9) | 1.3 (0.8) | 1.9 (4.0) | 1.5 (0.7) | 0.013 | 1.1 (0.6) | 1.0 (0.5) | 1.1 (0.6) | 1.1 (0.6) | 1.3 (0.7) | <0.001 | <0.001 |
| Apolipoprotein A1 | 1.7 (0.4) | 1.6 (0.3) | 1.5 (0.2) | 1.5 (0.3) | 1.6 (0.3) | 1.6 (0.3) | 0.004 | 1.9 (0.4) | 1.9 (0.4) | 1.8 (0.4) | 1.9 (0.4) | 1.8 (0.3) | 0.04 | <0.001 |
| Apolipoprotein B | 1.0 (0.3) | 1.0 (0.2) | 0.9 (0.2) | 1.0 (0.3) | 1.1 (0.3) | 1.1 (0.3) | <0.001 | 0.9 (0.3) | 0.8 (0.2) | 0.9 (0.3) | 1.0 (0.3) | 1.1 (0.3) | <0.001 | <0.001 |
| Hypercholesterolemia, (%/n) | 45.8 (946) | 42.9 (407) | 22.6 (37) | 38.0 (92) | 50.8 (126) | 51.5 (152) | <0.001 | 48.3 (539) | 26.3 (45) | 29.7 (81) | 59.7 (179) | 62.7 (234) | <0.001 | 0.02 |
| Hyperlipidemia, (%/n) | 68.8 (1428) | 70.7 (672) | 45.1 (74) | 63.9 (154) | 79.4 (197) | 83.2 (247) | <0.001 | 67.1 (756) | 35.7 (61) | 46.3 (125) | 75.3 (226) | 89.1 (344) | <0.001 | 0.07 |
| Low HDL-cholesterol, (%/n) | 9.4 (195) | 11.0 (104) | 9.8 (16) | 12.0 (29) | 14.1 (35) | 8.1 (24) | ns | 8.2 (91) | 4.1 (7) | 9.5 (26) | 6.7 (20) | 10.2 (38) | 0.060 | 0.03 |
| Fasting glucose, mean (SD) | 5.0 (1.0) | 5.2 (1.0) | 4.9 (0.5) | 4.9 (0.5) | 5.3 (1.2) | 5.5 (1.2) | <0.001 | 4.9 (0.9) | 4.6 (0.5) | 4.7 (0.5) | 4.9 (1.2) | 5.2 (0.9) | <0.001 | <0.001 |
| Hyperglycemia, (%/n) | 2.8 (57) | 4.0 (38) | 0.6 (1) | 0.4 (1) | 4.8 (12) | 8.1 (24) | <0.001 | 1.7 (19) | 0 (0) | 0 (0) | 2.3 (7) | 3.2 (12) | 0.004 | 0.002 |
| Diabetes mellitus, (%/n) | 5.1 (106) | 7.1 (67) | 2.4 (4) | 2.1 (5) | 7.3 (18) | 13.6 (40) | <0.001 | 3.5 (39) | 0.6 (1) | 1.1 (3) | 2.3 (7) | 7.5 (28) | <0.001 | <0.001 |
Physical activity level, high (IPAQ score of 3), moderate (IPAQ score of 2), low (IPAQ score if 1).
BMI (body mass index), underweight (BMI <18.5 kg/m2), normal weight (18.5–24.9 kg/m2), overweight (25–29.9 kg/m2), obese (≥30 kg/m2).
Hypertension, BP ≥140/90 mmHg or history of hypertension or treatment.
Hyperlipidemia, total cholesterol ≥5.0 mmol/l or LDL-cholesterol ≥3 mmol/l or triglycerides ≥1.7 mmol/l or on lipid-lowering drugs.
Low HDL-cholesterol, HDL-cholesterol <1 mmol/l in men or HDL <1.2 mmol/l in women.
Diabetes mellitus, fasting blood glucose ≥7 mmol/L or with a prior diagnosis of diabetes mellitus or on antidiabetic medications.
P value, Pearson chi-square test for proportions or analysis of variance for mean values, by age groups.
P value, Pearson chi-square test for proportions or t-test for mean values, by gender.
Self-report of selected diseases in the baseline cohort, by gender.
| Diseases (%/n) | Total n = 2160 | Men n = 977 | Women n = 1183 | P value |
|---|---|---|---|---|
| Ischemic heart disease | ||||
| Angina pectoris | 0.9 (19) | 1.2 (12) | 0.6 (7) | 0.1 |
| Myocardial infarction | 0.8 (18) | 1.6 (16) | 0.2 (2) | <0.001 |
| Percutaneous coronary intervention | 0.8 (18) | 1.4 (14) | 0.3 (4) | 0.005 |
| Coronary artery bypass grafting | 0.1 (3) | 0.3 (3) | 0.0 (0) | 0.06 |
| Other cardiovascular diseases | ||||
| Peripheral artery disease | 0.3 (6) | 0.3 (3) | 0.3 (3) | 0.8 |
| Stroke/transient ischemic attack | 1.4 (30) | 2.1 (20) | 0.9 (10) | 0.02 |
| Revascularisation (except myocardial) | 0.3 (6) | 0.5 (5) | 0.1 (1) | 0.06 |
| Hospitalizations for CVD (any) | 6.3 (133) | 8.9 (85) | 4.2 (48) | <0.001 |
| Diabetes mellitus | ||||
| Type 1 | 0.8 (17) | 1.0 (10) | 0.6 (7) | 0.3 |
| Type 2 | 3.8 (81) | 5.3 (52) | 2.5 (29) | <0.001 |
| Chronic kidney failure | 0.4 (8) | 0.8 (8) | 0 (0) | 0.002 |
| Liver/gallbladder diseases | 7.7 (166) | 6.8 (66) | 8.5 (100) | 0.1 |
| Chronic obstructive pulmonary disease | 1.5 (32) | 1.7 (17) | 1.3 (15) | 0.4 |
| Bronchial asthma | 5.2 (112) | 3.4 (33) | 6.7 (79) | 0.001 |
| Hypothyroidism | 7.4 (159) | 1.8 (18) | 11.8 (141) | <0.001 |
| Depression | 11.9 (256) | 6.7 (65) | 16.2 (191) | <0.001 |
| Other diseases | 69.2 (1494) | 67.0 (655) | 70.92 (839) | 0.05 |
P value, Pearson chi-square test.
The level of tobacco dependence was assessed using the Fagerstrom nicotine dependence test.11 A validated Czech translation of the long version of the international physical activity questionnaire (IPAQ-L) was used to assess physical activity level and intensity (walking, moderate, and vigorous) across four domains (leisure time, work/commuting, home and garden/yard).12
A food frequency questionnaire (FFQ) was used to assess food intake in 43 food groups in the past week, with added questions on dietary habits (salt intake, number of daily meals)13 and daily fluid intake and consumption of caffeine-rich beverages (coke drinks, coffee). Alcohol use was assessed using seven items, including beverage-specific weekly recall.14 The diet assessment was extended by a 24-hour dietary recall using a food-nutrient software to assess energy and nutrient intake. Most of the participants also completed a 3-day diet diary.
The patient health questionnaire (PHQ-9) and perceived stress scale (PSS-10) were used to assess depressive symptoms and the level of perceived stress.15,16 The Berlin questionnaire and Epworth sleepiness scale were used to screen for sleep apnea and daytime sleepiness.17,18
We also assessed a cognitive function using the Montreal cognitive assessment (MoCA), and a cogstate brief battery (CBB) test (in a subsample, March 2015 to July 2016).19 The study used single questions to measure self-rated health and self-reported quality of life (QoL), both on a scale from 1 (very poor) to 100 (excellent).20
Physical and device-assisted examinations
The standard study protocol was followed. Blood pressure (BP) was measured using a mercury sphygmomanometer (Baumanometer, W.A. Baum, Co., Inc., USA) in three positions. In addition, the BP and heart rate were measured with the patient alone using an automated office measurement device (BpTRU, model BPM 200; Bp TRU Medical Devices Ltd., Canada).
The baseline examination included a 12-lead surface electrocardiogram (Schiller AT-104; Schiller AG, Switzerland), cardio-ankle vascular index (CAVI) measurement (VaSera VS-1500N; Fukuda Denshi Co., Ltd., Japan) and ultrasonography of the dorsal aorta (Ultrasound GE Vivid E9; GE Healthcare, USA). Other clinical examinations such as echocardiography, 24-hour ambulatory BP monitoring (ABPM 90207-17Q; Spacelabs Healthcare, USA) and carotid ultrasound (MyLabClass-C; ESAOTE SpA, Italy) to measure intima media thickness were performed in smaller subsamples (Figure 1).
The anthropometric assessment included height and weight measurements using a medical digital scale with meter (SECA 799; SECA, GmbH and Co. KG, Germany) and manual tape measurement of waist, hip and neck circumference. They were complemented with body composition analyses including: (a) direct segmental multifrequency bioelectrical impedance analysis (InBody 370; BIOSPACE Co., Ltd., Korea); (b) whole-body plethysmograph (BOD POD, Body Composition System 2007A; COSMED USA, Inc., USA); or (c) body volume index scanner (BVI; Select Research Co., Ltd., British Virgin Islands).
We also assessed carbon monoxide in expired breath using a smokelyser (Micro Smokerlyzer; BedFont Scientific Ltd., UK) to validate self-reported smoking status.
Definitions of major cardiovascular risk factors
We defined never smoking as having smoked fewer than 100 cigarettes in a lifetime, past smoking as having stopped smoking at least a year ago, and current smoking as smoking either daily or less than daily. Obesity was diagnosed as having a body mass index (BMI) of 30 kg/m2 or greater, and being overweight if the BMI was 25–29.9 kg/m2. Normal weight was defined as a BMI of 18.5–24.9 kg/m2, and a BMI of less than 18.5 kg/m2 was defined as being underweight. Hypertension was defined as BP of 140/90 mmHg or greater or a prior diagnosis of hypertension or taking antihypertensive drugs. Hyperlipidemia was defined as total cholesterol of 5.0 mmol/L or greater or low-density lipoprotein (LDL)-cholesterol of 3 mmol/L or greater or triglycerides of 1.7 mmol/L or greater or taking lipid-lowering drugs. Low high-density lipoprotein (HDL)-cholesterol was defined as HDL-cholesterol of 1 mmol/L or less in men or HDL-cholesterol of 1.2 mmol/L or less in women. Diabetes mellitus was defined as fasting blood glucose of 7 mmol/L or greater or a prior diagnosis of diabetes mellitus or taking antidiabetic drugs.
Laboratory analyses
Laboratory analyses were performed with 12-hour fasting full blood samples using a Modular SWA P800 analyzer (Roche, Basel, Switzerland) with total cholesterol, triglycerides, glucose and creatinine assayed by the enzymatic colorimetric method (Roche Diagnostics GmbH, Germany), HDL-cholesterol by the homogeneous method for direct measuring without precipitation (Sekisui Medical, Japan). LDL-cholesterol was calculated according to the Friedewald equation only if triglyceride levels were lower than 4.5 mmol/L; if higher, LDL-cholesterol was assayed by the homogeneous method for direct measuring (Sekisui Medical, Japan). Urine albumin was assayed by immunoturbidimetry (Roche Diagnostics GmbH, Germany) in a morning spot urine sample, and the urinary albumin/creatinine ratio was calculated. DNA (extracted using the standard salting-out method) and blood samples (serum and plasma) were stored at –80℃.
Quality control
The study involves an extensive data collection that is guided by the study research protocol. The team members were assigned specific roles and responsibilities to maximize data quality, and had a backup in case of absence. All received training on standard performance of the measurements, working with the online database, and training on good clinical practice.
The baseline health examination (except laboratory tests) was piloted with 329 volunteers ensuring proper data collection and optimization of operational methods. The study devices were either annually calibrated or checked by maintenance tests of medical devices.
Data management
The open source software REDCap application,10 hosted at secure servers of St Anne’s University Hospital, Brno, was used for data collection and management. The questionnaire was accessible to users with sufficient access privileges set by the study principal investigator. Validation codes were assigned to specific fields to ensure data quality and integrity. Data were cleaned using Microsoft Excel 2013 (Microsoft Corp., Redmond, WA, USA) and STATA 11.0 statistical software (StataCorp., College Station, TX, USA). Some data such as healthcare costs, laboratory tests, medications and diet diaries were stored in retrievable files in the REDCap repository. Study participants were assigned a unique study identification number to anonymize the dataset and interlink the repository files.
Ethics approval
The baseline study protocol was approved by the ethics committee of St Anne’s University Hospital, Brno, Czech Republic on 13 June 2012 (reference number 2 G/2012). In accordance with the Declaration of Helsinki, all participants provided written informed consent.
Results
Sociodemographic characteristics at baseline
The study enrolled a total of 2160 participants (54.8% women), with a mean age of 47.3 (±11.3) years. The main characteristics of the participants at baseline are presented in Table 1. The majority were married (62.1%), lived in a family of one to two persons (50.8%), were employed as skilled workers or professionals (57.6%), and had full-time jobs (75.6%). Attainment of secondary (including vocational) and higher education was reported by 41.3% and 38.9% of the participants, respectively.
Baseline findings
Of the three conventional CVD risk behaviors, i.e. cigarette smoking, lack of physical activity, and insufficient fruit and vegetables consumption, the latter was the most prevalent (Table 2). An overwhelming majority of the men and women reported less than daily intake of fruit and vegetables (90.8% and 79.2%, P < 0.001). In contrast, vigorous and moderate physical activity was prevalent among the baseline participants, of whom only 14.4% were physically inactive. Cigarette smoking was reported by 25.3% and 21.9% of men and women, respectively (Table 2). In the baseline participants, education reliably predicted smoking and quitting rates in both genders.21 The gender-specific prevalence of these lifestyle behaviors did not vary in different age groups except male smoking that decreased with age (Table 2).
The mean BMI was 26.9 (±5.1) kg/m2 for men and 25.5 (±5.4) kg/m2 for women. Obesity was found in 20.1% and 18.1% of men and women, whereas 43.0% and 26.6%, respectively, were overweight. Most of the study participants had abnormal blood lipid levels, including hyperlipidemia (70.7% men, 67.1% women, P = 0.07). Less than 10.0% of the sample had a low level of HDL (Table 2). Fasting glucose mean values of 5.2 (±1.0) mmol/L and 4.9 (±0.9) mmol/L were found in male and female participants, respectively. Diabetes mellitus was more prevalent among men (7.1% vs. 3.5%, P < 0.001). Men also had a significantly higher prevalence of hypertension (54.3% vs. 38.7%, P < 0.001). The prevalence and mean values of metabolic risk factors such as BMI, hyperlipidemia, high BP and glucose increased significantly with age in both sexes (Table 2).
Men were twice as likely to be hospitalized for CVD (8.9% vs. 4.2%, P < 0.001) (Table 3). CVDs increased with age only in men; in contrast, a history of stroke was more prevalent in older persons regardless of gender (data not shown). Other pre-existing diseases included diabetes mellitus (type 2), depression, liver/gallbladder disease, hypothyroidism and bronchial asthma, with a notable cross-gender variability. Thus, hypothyroidism, depression, and bronchial asthma were markedly more common in women, whereas type 2 diabetes mellitus and myocardial infarction were more prevalent among men.
Other findings included: (a) establishing a threshold value for diagnosing hypertension using an automated office blood pressure (AOBP) device;22 and (b) establishing new CAVI reference values as an alternative to the currently used values that are likely to underestimate cardiovascular risk in the younger Caucasian population.23
Discussion
To the best of our knowledge, Kardiovize Brno 2030 is the only prospective cardiovascular cohort study in Central/Eastern European populations with the highest cardiovascular mortality in Europe.24 Designed as a longitudinal study, it employs a multidisciplinary approach to account for a range of psychosocial, environmental, behavioral, and biological factors with established or probable relationships with CVD, and has a potential to elucidate their complex relationships in these populations. While building on the Czech post-MONICA survey, the Kardiovize Brno 2030 study examines a broader range of both conventional and novel CVD risk factors including, but not limited to, CAVI, intima media thickness, body fat distribution, and genetic factors.
The use of standardized validated questionnaires, including IPAQ, FNDT, PHQ-9, and PSS-10, along with the modified Czech post-MONICA study questionnaire, adds strength to our study allowing valid comparisons. The study focus is consistent with the recent paradigm shift from CVD risk reduction towards enhancing cardiovascular health.25,26
There are two major weaknesses to acknowledge in this study. First, the Kardiovize Brno 2030 population represents a single urban area in Central Europe. Second, the response rate was low resulting in self-selection of more educated participants compared to the general population.27 Education is believed to enhance access to psychosocial and economic resources and to be associated with better cardiovascular outcomes.28 This self-selection bias may potentially have an impact on some baseline findings, including cross-sectional associations. However, having more privileged participants should not affect the future prospective studies. Moreover, such a profile could be an advantage when considering the future participation and risks of drop out.
Future directions
In addition to longitudinal follow-up examinations, we plan to recruit a parental subsample (65 years old and above) to investigate an interplay of biological, behavioral, and environmental risk factors. The depth of the data available from the cohort will highlight priority areas for future investigation and will inform interventional policy. Furthermore, in the era of genomics and personalized medicine, the Kardiovize Brno 2030 bio-bank of blood and DNA samples can be utilized in evaluating the ‘omics’ data.
The Kardiovize Brno 2030 dataset is a unique source of health information from Central Europe, with anonymized datasets available for data analyses. Collaborations on future follow-up studies, on predictive, preventive, personalized and participatory (P4) medicine approaches, and on utilization of the serum bio-bank are encouraged. All resources are available for research collaboration through the study infrastructure (www.fnusa-icrc.org), and by directly contacting the principal investigators: [email protected] and [email protected].
Author contribution
NKM, MV, FLJ, RC and OS contributed to the conception, design, interpretation and critical revision of the manuscript. SK, MH, and JJ acquired and NKM, SK and MH analyzed data. NKM, MV, MH and JJ drafted the manuscript. All authors gave final approval and agreed to be accountable for all aspects of work ensuring integrity and accuracy.
Acknowledgements
The authors are grateful to all participants in the study for their long-term support. They want to extend their gratitude and appreciation to all members of the Kardiovize team involved in planning, implementing, and advising on the project. The authors would also like to thank Dr Antonella Agodi for reviewing an earlier draft of the manuscript and providing constructive suggestions.
Declaration of conflicting interests
The author(s) declared no potential conflicts of interest with respect to the research, authorship, and/or publication of this article.
Funding
The author(s) disclosed receipt of the following financial support for the research, authorship, and/or publication of this article: the Kardiovize Brno 2030 study was supported by the European Regional Development Fund – Project FNUSA-ICRC (no. CZ.1.05/1.1.00/02.0123), by project no. LQ1605 from the National Program of Sustainability II (MEYS CR), by project ICRC-ERA-HumanBridge (no. 316345) funded by the 7th Framework Programme of the European Union, and partly by a grant by the Ministry of Health of the Czech Republic (NT13434-4/2012).
References
Author notes
These two authors contributed equally.

Comments