


Abstract
Silent/asymptomatic peripheral artery disease may occur in patients with chronic obstructive pulmonary disease, but it is poorly investigated. The primary aim of this study was to evaluate in chronic obstructive pulmonary disease patients the impact of asymptomatic/silent peripheral artery disease on maximal exercise capacity; the secondary aim was to search for predictors of peripheral artery disease.
We prospectively enrolled chronic obstructive pulmonary disease outpatients. Data on anthropometric characteristics, lung function, cardiopulmonary exercise test and ankle-brachial index were recorded. The cut-off of ankle-brachial index used to define patients with peripheral artery disease was ≤0.90.
We studied 47 patients and found 24 patients (51%) who showed peripheral artery disease. As compared to patients without peripheral artery disease, patients with peripheral artery disease had lower values of peak oxygen uptake, peak workload, energy expenditure (metabolic equivalents) and heart rate recovery, but showed the same degree of airflow obstruction and static and dynamic hyperinflation. In a multivariate linear regression model performed to identify variables predicting metabolic equivalents, ankle-brachial index (β 2.59; 95% confidence interval 0.51–4.67; p = 0.016) was an independent variable. In the search for predictors of peripheral artery disease, heart rate recovery (odds ratio 8.80; 95% confidence interval 1.30–59.35; p = 0.026) increased the risk of peripheral artery disease, whereas metabolic equivalents (odds ratio 0.50; 95% confidence interval 0.26–0.94, p = 0.033) and inhaled corticosteroids+long-acting β2 agonists (odds ratio 0.13; 95% confidence interval 0.02–0.83; p = 0.030) reduced this risk.
In chronic obstructive pulmonary disease outpatients, asymptomatic/silent peripheral artery disease affects the maximal exercise capacity regardless of airflow obstruction and lung hyperinflation. A delay of heart rate recovery increase the risk of peripheral artery disease, whereas high values of metabolic equivalents and the use of inhaled corticosteroids+long-acting β2 agonists reduces this risk.
Introduction
The clinical and epidemiological notion that several comorbidities may be present in chronic obstructive pulmonary disease (COPD) patients is well-established.1 Although metabolic and heart diseases represent the most prevalent conditions associated with COPD,1 and COPD is frequently associated with an endothelial dysfunction,2 the presence of an underlying arterial disease is little investigated, especially because patients have few or no specific symptoms. Peripheral artery disease (PAD) is a progressive, atherosclerotic process involving non-coronary arteries and is defined by ankle-brachial index (ABI) value≤0.9.3,4 A low value of ABI in the general population is associated with increased risk of death from cardiovascular events;5 details of measurement, interpretation and the role of ABI in clinical practice are provided in a scientific statement of the American Heart Association (AHA).3
The prevalence of PAD in patients with COPD is higher in comparison to healthy smokers and nonsmokers;6 of note, more than two-thirds of these patients did not report PAD in their medical history.6 Furthermore, PAD considerably impacts on health status and exercise tolerance of COPD patients, measured by the walk distance in the six-minute walking test (6MWT).6,7 The 6MWT is an easy and widely used test, and the walk distance is a measure of physical activity which can be used as a response to interventions, such as pulmonary rehabilitation (PR).8 However, this test does not provide a comprehensive measure of maximal capacity, ventilatory and cardiovascular responses to exercise, which may be provided by the cardiopulmonary exercise test (CPET).8–10
The primary aim of the present study was, therefore, to investigate in a cohort of COPD outpatients the impact of silent/asymptomatic PAD on maximal exercise capacity, assessed by means of CPET; the secondary aim was to search for predictors of PAD.
Methods
Study sample
We conducted this prospective study at the University Hospital of Parma, Italy, over a period of 30 months between September 2013–March 2016. By a systematic sampling method, all consecutive adult COPD outpatients admitted to the PR programme at our Lung Function Unit and who met criteria according to the Global Initiative for Chronic Obstructive Lung Disease (GOLD) guidelines11 were considered for the study.
The main inclusion criteria for the patients were having a former or current smoking history of at least 10 pack-years and having a cardio-respiratory stable condition for at least six weeks previous the enrolment (i.e. patients free from exacerbations or with well-controlled blood pressure if they were suffering from systemic hypertension). We excluded patients having: (a) a concomitant respiratory disease other than COPD, such as asthma or bronchiectasis; (b) a chronic respiratory failure needing long-term oxygen therapy; (c) any signs or symptoms potentially attributable to a PAD (i.e. leg pain on walking that is alleviated by rest and is attributed to reduced lower limb blood flow due to atherosclerotic disease); (d) inability to perform a CPET with a peak respiratory exchange ratio (RER)<1.05 in order to exclude poor motivation;9 (e) morbid obesity, diabetes mellitus,12 hyperlipidaemia or any kidney disease; (f) any comorbidities influencing exercise performance (anaemia, chronic heart failure, recent or previous myocardial infarction, neuromuscular disorders or malignancies); (g) severe arterial hypertension needing more than two antihypertensive drugs.
All the procedures were explained to the patients, who gave their written informed consent to participate. The study was conducted according to the Declaration of Helsinki and the Ethics Committee of the University Hospital of Parma approved the protocol.
General measurements
In all patients, anthropometric characteristics (age and gender), smoking habit (current/former and number of pack-year), and the use of inhaled bronchodilators, such as a long-acting β2 agonist (LABA) and long-acting muscarinic antagonist (LAMA), inhaled corticosteroid (ICS) and antihypertensive drugs (angiotensin-converting enzyme (ACE) inhibitors, β-blockers, calcium-channel blockers and diuretics) were recorded at enrolment.
In addition, body height and weight were measured anthropometrically to calculate body mass index (BMI) in kg/m2. Body composition was also assessed by a bioelectrical impedance analysis (BIA) method that is based on the conductance of an electrical sinusoidal alternating current through body fluids. BIA measures the impedance or resistance to the signal as it travels through the water that is found in muscle and fat. Foot-to-foot BIA was measured using a body composition analyser (model SC-331S, Tanita, Tokyo, Japan). Patients were evaluated in the standing position with bare feet on the analyser footpads. The fat-free mass (FFM) was standardised for height similarly to BMI: and the FFM index (FFMI) was calculated as FFM/height squared, in kg/m2.
Dyspnoea perception, health status impairment, concomitant chronic diseases and walking capacity were measured by the modified Medical Research Council (mMRC) scale, the COPD assessment test (CAT), the Charlson Index and the 6MWT, respectively. Briefly, the mMRC is a simple measure of exertional dyspnoea consisting of a five-point grading scale (I–V) developed by Fletcher et al.13 The CAT is a short, easy-to-use, self-administered questionnaire providing a measure of the health-related impact of COPD patients,14 also across different countries.15 The CAT score ranges from 0–40. The Charlson Index assigns a score to each disease that is proportional to the disease-related risk of death from the individuals' self-reported comorbidities.16 The 6-MWT is a self-paced, field-walking test, which does not require complex equipment and consists simply of the measurement of the distance walked in 6 min along a corridor.17
Lung function and CPET measurements
Pulmonary function tests were performed according to the international recommendations.18,19 A flow-sensing spirometer and a body plethysmograph connected to a computer for data analysis (Vmax 22 and 6200, Sensor Medics, Yorba Linda, USA) were used for the measurements. Forced vital capacity (FVC) and forced expiratory volume in the first second (FEV1) were recorded. The FEV1/FVC ratio was taken as the index of airflow obstruction.
Thoracic gas volume (TGV) was measured by body plethysmography with the patients panting against a closed shutter at a frequency slightly <1 Hz and supporting their cheeks with their hands. Total lung capacity (TLC) was obtained as the sum of TGV and related inspiratory capacity (IC), while residual volume (RV) was obtained by subtracting vital capacity (VC) from TLC. The IC/TLC ratio at rest was taken as an index of static hyperinflation of the lung. At least three measurements were taken for each spirometry and lung volume variable to ensure reproducibility and the highest value was used in subsequent calculations. The flow-sensor was calibrated before each test using a three-litre syringe. TLC, FVC and FEV1 were expressed as a percentage of the predicted values, which were obtained from regression equations.20,21
CPET was performed according to the standardised international procedure.10 Detailed information concerning CPET is provided in the Supplementary Material.
ABI measurements
The ABI was used to objectively diagnose PAD. The ABI value for each leg was obtained by calculating the ratio between the highest lower and upper limb values of systolic blood pressure (SBP). SBP was measured by a non-invasive and pocket device (G2002, GIMA-Italy) having a vascular Doppler probe of 8 MHz and a blood pressure cuff in both arms and both ankles in supine position. The lower limb SBP value incorporates the average SBP of the posterior tibial and the dorsalis pedis. The pressure measurement was repeated twice; the first beginning from the right arm, right limb, left limb and left arm, the second was done in reverse. In this study, ABI was considered as the lower value among the right and the left measurements; the cut-off of ABI used to define patients with PAD was ≤0.90.3
Statistical analysis
The analyses were performed with IBM SPSS Statistics 23.0 (Armonk, New York, USA) and a Shapiro-Wilk test was used to assess the normality of distribution. Data were reported as medians (1st quartile; 3rd quartile) for continuous variables with non-normal distribution or means ± standard deviation (SD) for those with normal distribution. Number of patients (%) was used for categorical variables. Categorical variables were compared using the χ2 test or the Fisher exact test and continuous variables with the t test or the nonparametric Mann-Whitney test. For the analyses of correlation, the Pearson r and the Spearman ρ were used for linear or normally distributed variables and for not linear or not normally distributed variables, respectively.
A multivariate regression linear model (Enter method) was performed to identify variables predicting metabolic equivalents (METs; the dependent variable). Variables that showed a significant result (p < 0.05) were included in the model; to avoid collinearity, strongly correlated variables (r>|±0.4|) were excluded from the multivariate analyses. Betas (β), standard error (SE), a 95% confidence interval (CI) for β and f2 (size effect to explain the dependent variable) were calculated.
Univariate and multivariate regression logistic models (method: Stepwise) were performed to predict the probability of having PAD (the dependent variable). The variables included in the univariate analysis were: age, gender (male/female), BMI, FFMI, pack/year, smoking habit (former/current), FEV1 % predicted value (pred.), FEV1/FVC, IC/TLC at rest, Δrest-to-peak IC, 6MWT, mMRC, CAT, Charlson Index, peak VO2 (ml/min), peak VO2 (ml/kg/min), peak workload, VO2/workload, O2 pulse, chronotropic response index (CRI), heart rate recovery (HRR), Δdouble product (DP), end-tidal pressure of CO2 (PETCO2 change), METs, peak dyspnoea, peak fatigue, presence of arterial hypertension (no/yes), use of LABA (no/yes), use of LAMA (no/yes), use of ICS+LABA (no/yes), use of ICS+LABA+LAMA (no/yes), use of diuretics (no/yes), use of angiotensin-converting enzyme (ACE) inhibitors (no/yes), use of β-blockers (no/yes), use of calcium antagonists (no/yes). Variables that showed a significant result (p < 0.1) were included in the corresponding multivariate regression stepwise model. Variables that correlated strongly (r>|±0.3|) were excluded from the multivariate analyses.
A p value <0.05 was considered significant for all analyses.
Results
General characteristics
Forty-seven adult stable COPD outpatients (31 males and 16 females) were included in our study cohort; of these, 24 patients (51%) reported PAD. Patients showed moderate to severe airflow obstruction (mean ± SD, FEV1 56 ± 19% of pred.), low number of comorbidities (median (1st quartile; 3rd quartile), Charlson Index 1 (0.7; 2) score), satisfactory walking capacity (6MWT 364 ± 76 m), and a mild degree of dyspnoea perception (mMRC 1.5 score (1; 2) and impact of disease (CAT 11.9 ± 6.0 total score). There was no difference between patients with and without PAD in baseline characteristics, except for mMRC (2 (1; 2) vs 1 (1; 2), p = 0.008) (Table 1).
General characteristics of study cohort, according presence of peripheral arterial disease (PAD).
| Variables | Total sample n = 47 | Patients with PADa n = 24 | Patients without PADa n = 23 | p Value |
|---|---|---|---|---|
| Age, years | 68.3 ± 7.1 | 68.7 ± 8.4 | 67.9 ± 5.5 | 0.692 |
| Gender, m/f (%) | 31/16 (66/34) | 16/8 (67/33) | 15/8 (65/35) | 0.917 |
| BMI, kg/m2 | 26.7 ± 3.9 | 25.9 ± 4.0 | 27.4 ± 3.6 | 0.187 |
| FFMI, kg/m2 | 17.3 (14.9; 18.8) | 17.4 (14.9; 18.6) | 17.1 (14.7; 19.5) | 0.153 |
| Smoking habit, former/current, n (%) | 35/12 (75/25) | 16/8 (67/33) | 19/4 (83/17) | 0.210 |
| Pack/year | 40 (22.3; 58.7) | 40 (29.5; 77.5) | 40 (20; 50) | 0.903 |
| FEV1, % pred. | 56.3 ± 19.0 | 52.6 ± 22.7 | 60.2 ± 13.7 | 0.175 |
| FEV1/FVC, % | 48.8 ± 11.6 | 46.4 ± 12.8 | 51.1 ± 10.0 | 0.169 |
| TLC, % pred. | 117.8 ± 16.3 | 119.7 ± 14.4 | 115.6 ± 18.3 | 0.404 |
| Rest IC/TLC | 0.28 (0.25; 0.32) | 0.28 (0.23; 0.31) | 0.30 (0.26; 0.34) | 0.063 |
| ABI | 0.90 (0.77; 1.00) | 0.80 (0.65; 0.90) | 1.07 (1.00; 1.10) | <0.001 |
| 6MWT, m | 363.9 ± 76.1 | 356.1 ± 71.0 | 374.2 ± 83.3 | 0.452 |
| mMRC, dyspnoea score | 1.5 (1; 2) | 2 (1; 2) | 1 (1; 2) | 0.008 |
| CAT, total score | 11.9 ± 6.0 | 13.3 ± 6.9 | 10.7 ± 5.0 | 0.177 |
| Charlson Index, score | 1 (0.7; 2) | 1 (0.5; 2) | 1 (0.5; 2) | 0.660 |
| Arterial hypertension, n (%) | 24 (51) | 14 (58) | 10 (43) | 0.308 |
| LABA, n (%) | 13 (30) | 9 (37) | 4 (17) | 0.123 |
| LAMA, n (%) | 18 (38) | 11 (46) | 7 (30) | 0.278 |
| ICS + LABA, n (%) | 29 (62) | 12 (50) | 17 (74) | 0.092 |
| ICS + LABA + LAMA, n (%) | 24 (51) | 10 (42) | 14 (61) | 0.188 |
| Angiotensin-converting-enzyme inhibitors, n (%) | 19 (40) | 11 (46) | 8 (35) | 0.440 |
| β-Blockers, n (%) | 12 (25) | 6 (25) | 6 (26) | 0.932 |
| Calcium channel blockers, n (%) | 7 (15) | 3 (12) | 4 (17) | 0.638 |
| Diuretics, n (%) | 8 (17) | 3 (12) | 5 (22) | 0.400 |
6MWT: six-minute walking test; BMI: body mass index; CAT: chronic obstructive pulmonary disease assessment test; FEV1: forced expiratory volume at 1st second; FFMI: fat-free mass index; FVC: forced vital capacity; IC: inspiratory capacity; ICS: inhaled corticosteroid; LABA: long-acting β2 agonist; LAMA: long-acting muscarinic antagonist; mMRC: modified Medical Research Council; TLC: total lung capacity.
Data are shown as number of patients (%), means ± standard deviation (SD) or medians (1st quartile; 3rd quartile), unless otherwise stated. ICS includes fluticasone and budesonide; LABA includes formoterol, salmeterol, indacaterol and vilanterol; and LAMA includes tiotropium, glycopyrronium and umeclidinium.
Patients with PAD were defined according to the cut-off of ABI ≤ 0.90 (see Methods section).
CPET variables and impact of PAD on maximal exercise capacity
The COPD patients with PAD, as compared to those without PAD showed lower values of peak VO2 ml/min (1134.7 ± 374.3 vs 1416.1 ± 528.6, p = 0.042), peak VO2 ml/kg/min (15.0 (12.9; 17.3) vs 16.3 (13.9; 20.4), p = 0.027), peak workload (66 (52; 87.5) vs 80 (67; 86.5), p = 0.020), METs (4.1 ± 1.1 vs 5.3 ± 1.4, p = 0.003), and HRR (9 (4; 12.5) vs 13 (6.5; 21.5), p = 0.021) (Table 2 and Figure 1). It is of note that no difference was found between patients with PAD in comparison to patients without PAD when IC/TLC values were considered both at rest and at peak of exercise (Tables 1 and 2, Figure 2). In addition, Δrest-to-peak IC values did not differ between patients with PAD and patients without PAD as well as the percentage of patients with a significant decrease in IC during exercise (≥140 ml) was no different between patients with PAD and patients without PAD. Lastly, PETCO2 change values also did not differ between patients with PAD and patients without PAD (Table 2). On the contrary, peak dyspnoea was higher in patients with PAD in comparison to patients without PAD (1.12 (0.75; 1.63) vs 0.95 (0.71; 1.28), p = 0.034).
Variables related to cardiopulmonary exercise test (CPET).
| Variables | Total sample n = 47 | Patients with PAD n = 24 | Patients without PAD n = 23 | p Value |
|---|---|---|---|---|
| Peak VO2, ml/min | 1269.3 ± 471.4 | 1134.7 ± 374.3 | 1416.1 ± 528.6 | 0.042 |
| Peak VO2, ml/kg/min | 15.2 (13.0; 18.6) | 15.0 (12.9; 17.3) | 16.3 (13.9; 20.4) | 0.027 |
| Peak workload, watts | 70.5 (56.5; 86.7) | 66 (52; 87.5) | 80 (67; 86.5) | 0.020 |
| METs | 4.7 ± 1.4 | 4.1 ± 1.1 | 5.3 ± 1.4 | 0.003 |
| Peak IC/TLC | 0.24 (0.19; 0.29) | 0.21 (0.17; 0.29) | 0.24 (0.22; 0.29) | 0.096 |
| Δrest-to-peak IC, l | 0.33 ± 0.30 | 0.33 ± 0.31 | 0.32 ± 0.30 | 0.935 |
| DH yes/no, % | 73/27 | 67/33 | 81/19 | 0.280 |
| PETCO2 change,a mm Hg | 5.8 ± 3.0 | 5.5 ± 3.6 | 6.0 ± 2.3 | 0.611 |
| O2 pulse, ml/beats/min | 9.6 (7.7; 12.0) | 9.9 (7.6; 12.4) | 8.4 (7.8; 11.6) | 0.259 |
| CRI, % | 52.8 ± 23.9 | 52.1 ± 24.6 | 53.5 ± 23.6 | 0.834 |
| HRR, beats | 10.5 (5.7; 14.7) | 9 (4; 12.5) | 13 (6.5; 21.5) | 0.021 |
| DP reserve, mm Hg/bpm | 9652.4 ± 4086.6 | 8863.1 ± 4088.4 | 10476.1 ± 4007.1 | 0.179 |
| Peak dyspnoeab | 1.05 (0.73; 1.40) | 1.12 (0.75; 1.63) | 0.95 (0.71; 1.28) | 0.034 |
| Peak leg fatigueb | 0.95 (0.52; 1.13) | 0.97 (0.51; 1.43) | 0.78 (0.52; 1.07) | 0.264 |
CRI: chronotropic response index; DH: dynamic hyperinflation; DP: double product; HRR: heart rate recovery; IC: inspiratory capacity; METs: metabolic equivalents; PAD: peripheral arterial disease; PETCO2: end-tidal pressure of CO2; TLC: total lung capacity; VO2: oxygen uptake.
Data are shown as number of patients (%), means ± standard deviation (SD) or medians (1st quartile; 3rd quartile), unless otherwise stated.
Calculated as peak PETCO2 less at rest PETCO2.
Described as visual analogic scale with 0–100 score and peak workload ratio.
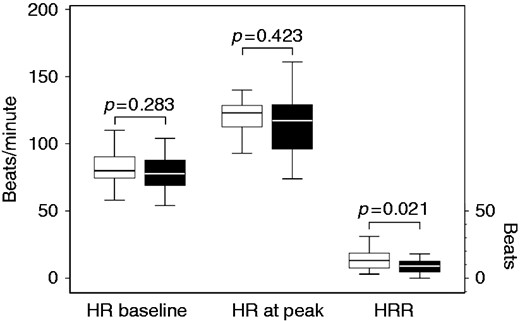
Boxplot of heart rate (HR) measured at baseline and at peak (beats/min), and of heart rate recovery (HRR) in patients with peripheral arterial disease (PAD) and in patients without PAD.
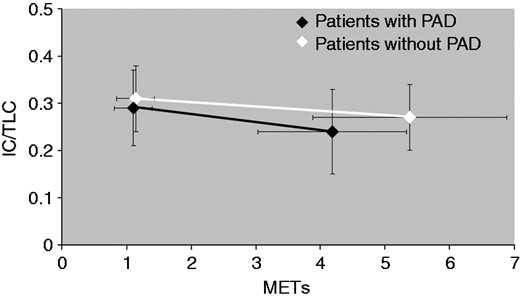
Values of metabolic equivalents (METs) evaluated at baseline and at peak, and related to static and dynamic hyperinflation in patients with peripheral arterial disease (PAD) and in patients without PAD. IC: inspiratory capacity; TLC: total lung capacity.
The multivariate linear regression models performed to identify variables predicting METs are reported in Table 3. In the unadjusted model, ABI (β 2.83; 95% CI for β 0.75–4.91; p = 0.009), 6MWT (β 0.00; 95% CI for β 0.00–0.01; p = 0.036) and mMRC (β −0.51; 95% CI for β −1.00– −0.01; p = 0.045) were the independent predictive variables; in the model adjusted for age, sex and smoking habit ABI (β 2.59; 95% CI for β 0.51–4.67; p = 0.016) and mMRC (β −0.51; 95% CI for β −1.00– −0.02; p = 0.042) confirm their predictive role.
Multivariate linear regression model performed to identify variables predicting metabolic equivalents (METs; dependent variables).
| Multivariate unadjusteda | Multivariate adjustedb,c | |||||||||||
|---|---|---|---|---|---|---|---|---|---|---|---|---|
| Variables | β | SE | 95% CI for β | t | p | f 2 | β | SE | 95% CI for β | t | p | f 2 |
| ABI | 2.83 | 1.03 | 0.75–4.91 | 2.76 | 0.009 | 0.32 | 2.59 | 1.03 | 0.51–4.67 | 2.52 | 0.016 | 0.56 |
| 6MWT, m walked | 0.00 | 0.00 | 0.00–0.01 | 2.18 | 0.036 | 0.15 | 0.00 | 0.00 | 0.00–0.01 | 1.93 | 0.061 | 0.38 |
| mMRC, dyspnoea score | –0.51 | 0.24 | −1.00–0.01 | –2.08 | 0.045 | 0.19 | –0.51 | 0.24 | −1.00–0.02 | –2.11 | 0.042 | 0.44 |
6MWT: six-minute walking test; ABI: ankle-brachial index; CI: confidence interval; mMRC: modified Medical Research Council; SE: standard error.
Model summary: R = 0.631, R2 = 0.398, adjusted R2 = 0.350, SE of the estimate = 1.178, p < 0.001; badjusted for age, sex and smoking habit; cmodel summary: R = 0.696, R2 = 0.484, adjusted R2 = 0.396, SE of the estimate = 1.136, p < 0.001.
Predictors of PAD
The logistic regression models are reported in Table 4. In the univariate model, peak VO2 ml/min (odds ratio-OR 0.99; 95% CI 0.99–1.00; p = 0.051), peak VO2 ml/kg/min (OR 0.84; 95% CI 0.73–0.97; p = 0.017), peak workload (OR 0.97; 95% CI 0.95–1.00; p = 0.018), mMRC (OR 3.48; 95% CI 1.37–8.83; p = 0.009), METs (OR 0.50; 95% CI 0.30–0.84, p = 0.008), HRR (OR 4.14; 95% CI 1.15–14.92; p = 0.030), and ICS + LABA (OR 0.35; 95% CI 0.10–1.20; p = 0.096) predict the probability of having PAD. In the multivariate model, METs (OR 0.48; 95% CI 0.27–0.86, p = 0.013) and ICS+LABA (OR 0.12; 95% 0.002 to 0.72; p = 0.020) reduce the risk of having PAD while HRR (OR 7.47; 95% CI 1.24–44.80; p = 0.028) increases this risk; in a model adjusted for age, sex, BMI and smoking habit the three predictors confirm their independent predictive role.
Univariate and multivariate logistic regression model predicting the probability of having peripheral arterial disease (PAD).
| Variables | Univariate | Multivariate | ||||
|---|---|---|---|---|---|---|
| OR | 95% CI | p Value | OR | 95% CI | p Value | |
| Peak VO2, ml/min | 0.99 | 0.99–1.00 | 0.051 | |||
| Peak VO2, ml/kg/min | 0.84 | 0.73–0.97 | 0.017 | |||
| Peak workload, watts | 0.97 | 0.95–1.00 | 0.018 | |||
| mMRC dyspnoea score | 3.48 | 1.37–8.83 | 0.009 | |||
| METs | 0.50 | 0.30–0.84 | 0.008 | 0.49 (0.50) | 0.27–0.88 (0.26–0.94) | 0.016 (0.033) |
| HRR (≤12 vs >12) | 4.14 | 1.15–14.92 | 0.030 | 7.47 (8.80) | 1.24–44.80 (1.30–59.35) | 0.028 (0.026) |
| ICS + LABA (yes vs no) | 0.35 | 0.10–1.20 | 0.096 | 0.13 (0.13) | 0.02–0.75 (0.02–0.83) | 0.023 (0.030) |
CI: confidence interval; HRR: heart rate recovery; ICS: inhaled corticosteroid; LABA: long-acting β2 agonist; METS: metabolic equivalents; mMRC: modified Medical Research Council; OR: odds ratio; VO2: oxygen uptake.
Adjusted model for variables related to age, sex, body mass index and smoking habit shown in round brackets. Hosmer and Lemeshow goodness-of-fit tests p=0.681 and p = 0.582 for multivariate and multivariate adjusted models, respectively.
Discussion
Our study demonstrates that in a selected population of COPD outpatients with a low comorbidity index and without symptoms related to PAD, the maximal exercise capacity can be significantly limited by PAD, as assessed by means of ABI. Interestingly, this finding was independent of airflow obstruction, as well as static and dynamic hyperinflation of the patients. Moreover, high METs values, a HRR≤12 beats and the use of ICS+LABA can predict the risk of PAD in COPD patients.
Of COPD outpatients undergoing a PR program, 50–60% may have more than one associated chronic condition.1 In the comprehensive evaluation of COPD patients, the presence of PAD is often not well defined and is clinically considered only if a complicating metabolic (obesity, diabetes or nephropathy) or cardiovascular disease occurs. For this reason, the prevalence of PAD is not uniform in COPD patients (from 8–81%),6,7,22–24 depending on the degree of airflow obstruction,25 functional capacity,2,7 associated cardiovascular risk factors,7,22–24 and the nationality of the study population.7,22–24 In a large cohort of patients with COPD of all degrees of severity, 8.8% were objectively diagnosed with PAD by means of ABI, even if the majority of these patients did not report any PAD-related symptom.6 The higher prevalence of PAD (81%) in the French study of Castagna et al.7 was found in COPD patients, who had a reduced walking ability (290 m in the 6MWT) and included patients with diabetes and hypercholesterolaemia. In this context, our study is the first one performed in Italy which reports a mid-prevalence of PAD (51%) in COPD outpatients with moderate to severe airflow obstruction and without significant comorbidities.
The role of PAD on exercise tolerance has previously been investigated by means of the 6MWT.2,6,7,26 Although in COPD patients with symptomatic PAD, the presence of PAD was a conditioning factor the walking capacity2,7 with a direct relationship between peripheral arterial impairment and walked distance,7 in COPD patients with asymptomatic PAD this relationship was not found.26 Our results are in line with this previous study26 and confirm that the 6MWT has a limited role in the functional assessment of exercise in COPD patients with asymptomatic PAD. On the contrary, our CPET data provide the first evidence that patients with PAD in comparison to patients without PAD had lower level of maximal workload, peak oxygen uptake (measured in absolute value in ml/min and ml/kg/min) and energy expenditure (METs). Importantly, the reduced exercise capacity of patients with PAD and COPD was found regardless of their degree of airflow obstruction as well as of static and dynamic hyperinflation (Figure 2). It is also worth noting that the patients with PAD did not differ in terms of PETCO2 change, as compared to the patients without PAD. Although, PETCO2 values may underestimate the partial arterial pressure of CO2, PETCO2 change is considered as a reliable marker of ventilatory efficiency during exercise.27,28 Accordingly, a quite similar and positive value of PETCO2 change found in patients with PAD and in those without PAD gives evidence of severe ventilatory limitation during exercise in both groups of patients (Table 2).
Of note, the HRR, a marker of the cardiac autonomic dysfunction29 and a powerful predictor of mortality both in the general population30 and in COPD patients,31 was significantly lower in our patients with PAD (median=9). Moreover, the threshold value of HRR≤12 beats, considered as the abnormal value for the recovery of heart rate,30 was significantly associated with an increased risk of PAD in our patients (see Table 3). At the end of exertion, in healthy individuals, the combination of sympathetic withdrawal and increased parasympathetic tone can cause a rapid decline in HR.28 On the contrary, in COPD patients a compensatory mechanism, related to the increase of airway resistance and work of breathing and consisting in an increased sympathetic tone and/or a decreased parasympathetic tone, may occur, thereby leading to autonomic system dysfunction.32 Interestingly, a delayed HRR was found to be associated with carotid atherosclerosis.33 HRR delay was also associated with impaired endothelial function,34,35 which in turn may facilitate inflammatory processes in the vascular wall and accelerate the development of atherosclerosis. Accordingly, we might speculate that HRR delay may further represent a marker of peripheral impairment in patients with PAD.
A previous study found that the presence of hyperlipidaemia or hypertension, an age ≥65 years, and the number of pack-years were independent predictors of PAD in COPD patients.22 However, this study22 did not exclude comorbidities, such as hyperlipidaemia, that represent a common risk factor for cardiovascular disease and that may increase the possibility of having PAD. In consideration of the intriguing association between metabolic chronic disorders and both COPD1,36 and PAD,5,12,37,38 we have excluded a priori any comorbidity representing a risk factor for PAD. Accordingly, we found that a lower level of energy expenditure (METs) achieved at CPET is an exercise-induced sign of asymptomatic PAD. We also found that the use of ICS+LABA has a protective effect on the risk of PAD. This finding is in line with previous data about the reduced risk of cardiovascular mortality in ICS-exposed COPD patients39 and with recent data from a nationwide COPD population-based study in Taiwan, where the combination treatment with inhaled ICS and LABA was associated with a reduced the risk of stroke.40 COPD is an inflammatory disease involving neutrophils, macrophages and elevated levels of interleukin (IL)-1β, IL-6, IL-8 and tumour necrosis factor (TNF)-α.41 The inflammatory process may spill over from the lungs to the blood stream, thereby inducing a systemic inflammatory response which in turn may cause endothelial dysfunction, leading to atherothrombosis, and this could provide a mechanistic link between COPD and atherosclerosis.41 Since the anti-inflammatory effects on airways are well-established for ICS, and LABA may improve the anti-inflammatory properties of ICS,42 the ICS+LABA combination might diminish systemic inflammation by reducing the spill over of airway inflammation.
Strengths and limitations
The major strength of the present study is that, to our knowledge, this is the first study investigating the role of asymptomatic PAD in COPD patients on maximal exercise capacity, as assessed by CPET. Moreover, we applied strict selection criteria to patients and reported data about a selected population of COPD without symptoms of PAD. As a consequence of this, however, a limitation concerns the small number of patients recruited in this study and for this reason our findings must be considered with prudence. Moreover, we lack information about quadriceps muscular strength; however, a comparable FFMI among patients with and without PAD gives us a reasonable guarantee about general nutritional status and physical activity of our study sample.43 Lastly, one in four patients used ß-blockers to control arterial hypertension and this fact can affect exercise parameters; however, the number of patients using this class of drugs was no different when patients with and without PAD were compared. Furthermore, since β-blockers can worsen limb ischaemia in patients with PAD, accordingly, we have re-considered the antihypertensive treatment in these patients.
In conclusion, our study demonstrates that in COPD outpatients the presence of a silent/asymptomatic PAD influences exercise tolerance regardless of baseline airflow obstruction, static and dynamic hyperinflation of patients. A delay on HRR (≤12 beats) increases the risk of having PAD whereas high values of energy expenditure and use of ICS+LABA reduce this risk.
These findings might also infer some clinical implications. It is conceivable, in fact, that during a pulmonary rehabilitation programme COPD patients with concomitant silent/asymptomatic PAD might behave and respond to exercise differently, thereby having a different impact on their disability and symptoms in the long-term. This should be a field for further investigations.
Author contribution
EC, CS, PT, MA, GB and AC contributed to the conception or design of the work. EC, CS, PT, MA and AC contributed to the acquisition, analysis or interpretation of data for the work. EC, CS, PT and MA drafted the manuscript. GB and AC critically revised the manuscript. All the authors gave final approval and agree to be accountable for all aspects of work ensuring integrity and accuracy.
Declaration of conflicting interests
The author(s) declared no potential conflicts of interest with respect to the research, authorship, and/or publication of this article.
Funding
The author(s) received no financial support for the research, authorship, and/or publication of this article.

Comments