


Abstract
Circulating cardiac troponin levels increase following prolonged intense physical exercise. The aim of this study was to identify participants with highly elevated cardiac troponins after prolonged, high intensity exercise, and to evaluate these for subclinical coronary artery disease.
Ninety-seven recreational cyclists without known cardiovascular disease or diabetes, participating in a 91 km mountain bike race were included, 74 (76%) were males, age: 43 ± 10 years, race duration: 4.2 (3.6–4.7) h. Blood samples, rest electrocardiogram and physical examination were obtained 24 h prior to, and at 0, 3 and 24 h following the race. Median cardiac troponin I level at baseline: 3.4 (2.1–4.9) ng/l (upper limit of normal: 30.0 ng/l). There was a highly significant (p < 0.0001) increase in circulating cardiac troponin I in all participants: immediately following the race; 50.5 (28.5–71.9) ng/l, peaking at 3 h 69.3 (42.3–97.7) ng/l and declining at 24 h: 14.2 (8.5–27.9) ng/l. No cyclist had symptoms or rest electrocardiogram changes compatible with coronary artery disease during or following the race. Coronary artery disease was detected by coronary angiography in the three cyclists with the three of the four highest cardiac troponin values (>370 ng/l) at 3 and 24 h following the race. Computed tomographic coronary angiography was performed in an additional 10 riders with the subsequently highest cardiac troponin I values, without identifying underlying coronary artery disease.
This study suggests that there is a pathologic cardiac troponin I response following exercise in individuals with subclinical coronary artery disease. This response may be associated with an excessive cardiac troponin I increase at 3 and 24 h following prolonged high-intensity exercise.
Introduction
Cardiac troponins (cTns) are circulating markers of myocardial damage that are used for the diagnosis of myocardial infarction.1,2 It was therefore considered a disturbing finding when a moderate increase in cTn levels was demonstrated following physical exercise in healthy, highly trained individuals.3 No links between this moderate activity related cTn increase and myocardial damage have been found.4,5 Therefore, at present, the exercise-induced cTn release in healthy individuals is considered a physiological response.
There is considerable uncertainty regarding both the mechanisms causing cTn release and the clinical importance of cTn increase following physical activity.6 Current understanding of activity related cTn increase, is based upon data derived from studies of half and full-marathon,7–11 ultra-marathon,12,13 triathlon13 and ultra-endurance cycling14 competitions. Most studies were small and included only highly trained individuals who were mostly men, assessed by cTn only once immediately following exercise, and none of these studies included coronary angiography.
Myocardial ischaemia accounts for most of the sports-related sudden cardiac deaths in adults.15,16 The proposed algorithm for management of patients with suspected acute coronary syndrome following prolonged exercise only recommends measuring cTn in the presence of symptoms (chest pain, palpitations, unusual/inappropriate dyspnoea or syncope), a positive medical history, physical examination or 12-lead electrocardiogram (ECG).5 This approach will render persons with silent coronary artery disease (CAD) undetected, increasing the risk of exercise induced ischaemia and sudden cardiac death.16 A recent study by Braber et al.17 used computed tomographic (CT) coronary angiography to screen 318 asymptomatic athletes >45 years of age for occult CAD. In this study 19% of the participants had CAD despite otherwise normal rest and exercise ECGs. This finding emphasises the need for additional screening tools for recreational athletes.
It is thought that the physiological cTn response to physical activity is due to a leakage of cTn from cytosol, while the cTn increase following myocardial ischaemia and infarction is due to loss of cellular integrity.6 Consequently, it is reasonable to postulate that the cTn response following extensive physical exercise is characterised by an excessive and prolonged increase in cTn level in the presence of ischaemia and/or necrosis. We hypothesise that there may be a cTn cut-off value following strenuous exercise that may represent CAD in otherwise asymptomatic individuals.
Methods
The present study is a prospective observational biomarker study that assessed cardiac troponin I levels in apparently healthy recreational cyclists of both genders, mostly middle aged, with a large range of different physical fitness levels, participating in a 91-km mountain bike race (North Sea Race: ‘Nordsjørittet’, in 2013). Cyclists with highly elevated cTn levels were evaluated by CT coronary angiography and by conventional coronary angiography whenever appropriate (see below for further description of selection criteria for CT coronary angiography). The North Sea Race is an annual mountain bike race with approximately 12,500 participants in south western part of Norway, attracting participants with a large range of fitness levels, with a mean age of 42 (range: 17–74) years, 23% of participants being women.
Study population
Study participants were recruited via the Internet using an electronic form distributed through the official web site of the North Sea Race (www.nordsjorittet.no). All participants in the ‘North Sea Race’ 2013 were invited to participate in the study if they did not use cardiovascular (CV) treatment and were without any known CAD. The internet based invitation to participate in the study closed after 169 cyclists had signed up to participate in the study. A total of 111 cyclists signed the informed consent and 97 cyclists completed the first assessment 24 h prior to the race. These 97 cyclists were included in the study. The study was approved by the regional ethics committee (2013/550/REK vest). All study participants provided written informed consent prior to enrolment into the study.
Data sampling

Blood samples
Venous blood samples were acquired from an antecubital vein. Serum was extracted using 5 ml and centrifuged within 60 min at 2000 G for 10 min and stored at + 4℃ for the analysis of creatinine, B-type natriuretic peptide (BNP), high-sensitive C-reactive protein (hs-CRP), creatine kinase (CK), CK-myocardial band (CK-MB). The analysis of all samples, including BNP, was completed within 24 h of sampling. For haematology and HbA1c, 3 ml K2 ethylenediaminetetraacetic acid (EDTA) tubes were used. The tubes were stored at room temperature until analysis. Tubes without any additives were placed in room temperature and centrifuged after coagulation at 2000 G for 10 min. Following centrifugation all blood samples were stored at + 4℃ and transported to the Department of biochemistry at Stavanger University Hospital for analysis within 24 h. The troponins were analysed using a commercially available high-sensitive cTnI STAT assay from Abbott Diagnostics, analysed on an Architect i2000SR (Abbott Diagnostics, Illinois, USA) (immunochemistry) with a lower limit of detection of 1.6 ng/l. The other biomarkers were analysed using Architect c16000TM (Abbot Diagnostics, Illinois, USA) (clinical chemistry), XE-5000 (Sysmex, Kobe, Japan) (haematology), Variant Turbo II (BioRad Laboratories, California, US) (HbA1c).
Decision limits for coronary angiography and calculation of a pathological cardiac troponin I (cTnI) threshold
The present study has used two cTnI cut-offs: the first (500 ng/l) refers to the predetermined cut-off that was used to initiate the CT coronary angiographies. The second cut-off refers to the lower cTnI detection level for CAD. The latter cut-off value was calculated from cTnI values in the study participants that were assessed by coronary angiography.
The first cut-off value (500 ng/l) was based upon prior experience with the use of cTnI in professional cyclists. All of these cyclists had normal cardiac function and normal coronary arteries, but some had increased cTnI values. The highest recorded cTnI value in these cyclists was 415 ng/l, and the 10 highest recorded values were (mean ± standard deviation (SD)): 269 ± 88 ng/l. Considering the extremely high work-load of these cyclists, we assumed that the cTnI levels were close to the upper boundaries of a physiological cTnI response. However, we could not be certain that the blood-samplings were at the peak of cTnI following exercise. We therefore chose to increase the predetermined cut-off to 500 ng/l to accommodate a more optimal sampling time-point in the study setting.
The cTnI cut-off value for CAD was defined as the 95% lower confidence interval limit for cTnI in subjects with CAD. The value was calculated by bootstrapping of cTnI values in all participants assessed by coronary angiography.
Statistics
In accordance with a previous study in marathon runners,10 the present study sought to include 100 subjects. Mean and SD were used to report continuous variables with a fairly symmetric distribution. Shapiro-Wilk test was used to test for normality. The median and the interquartile range (IQR) representing the 25–75 percentile were used to report skewed data. Number and percentage were used for count data. For non-parametric correlations, we used Spearman's correlation coefficient. Wilcoxon test was used when comparing two related samples, and the Mann–Whitney U test for the between-group comparisons. A two-tailed p value of less than 0.05 was considered significant. For all statistical analyses, the statistical packages SPSS and R were used.19
Results
Baseline characteristics
Study participants were 42.8 ± 9.6 years of age, 74 (76%), were males, 43 (44%) participants reported that they had never smoked (Table 1). Study participants completed the race in 4.2 h (3.6–4.7) (median (25–75 percentile)) with a mean heart rate of 158 bpm (148.5–168), which was 86% (82–88) of estimated max heart rate. There was a large range in competitive experience prior to the race: 10 participants had no competitive experience, whereas 13 participants had participated in more than 30 competitions during the past five years. There was a large variation in physical training during the past six months prior to the race: 14 study participants reported ≤ 3 h/week, whereas 14 cyclists exercised > 10 h/week.
Baseline characteristics and competition performance of cyclists participating in the study (n = 97). Mean ± standard deviation (SD) for continuous variables; median (25–75 percentile) if markedly skewed distribution.
| Gender (male, %) | 74 (76.3) |
|---|---|
| Age (years) | 42.8 ± 9.6 |
| Height (cm) | 178 ± 8.0 |
| Weight (kg) | 81.6 (75.8–91.4) |
| Blood pressure (mm Hg) | |
| Systolic | 138 (129–152) |
| Diastolic | 77 (71–85) |
| Resting heart rate (bpm) | 63.0 (56–70) |
| Cardiovascular risk factors (n, %) | |
| Family history of CV disease (n, %) | 25 (26) |
| Hypertension (n, %) | 3 (3) |
| Hypercholesterolaemia (n, %) | 3 (3) |
| DM (n, %) | 1 (1) |
| Smoker (n, %) | |
| Never | 49 (51) |
| Stopped | 39 (40) |
| Current | 4 (4) |
| Baseline blood tests | |
| HbA1c (%) | 5.2 ± 0.27 |
| Total cholesterol (mmol/l) | 4.9 (4.4–5.4) |
| HDL (mmol/l) | 1.3 (1.1–1.6) |
| LDL (mmol/l) | 3.2 ± 0.84 |
| eGFR (ml/min) | 94 ± 13.9 |
| ECG: left ventricular hypertrophy (n, %) | 29 (30) |
| Training history | |
| No. of training years | 5.0 (3–13.5) |
| No. of endurance competitions past 5 years | 7 (1–16) |
| Hours of training per week past 6 months | 6.5 (3.5–9) |
| North Sea Race 2013: | |
| Finishing time (h) | 4.2 (3.6–4.7) |
| Max heart rate (bpm) | 178 (173.5–187) |
| Max heart rate of expected max heart rate (%) | 97 (95–100) |
| Mean heart rate (bpm) | 158 (148.5–168) |
| Mean heart rate of expected max (%) | 86 (82–88) |
CV: Cardiovascular; DM: diabetes mellitus; HbA1c: Glycerated hemoglobin; ECG: electrocardiogram; eGFR: estimated glomerular filtration rate; HDL: high density lipoprotein; LDL: low density lipoprotein;
Results blood samples
The results of the blood samples are displayed in Figure 1. All six biomarkers demonstrated highly significant (p < 0.0001) increase following the race. Prior to the race cTnI (median and 25–75 percentiles): 3.4 (2.1–4.9) ng/l (upper limit of normal: 30.0 ng/l). Following the race, there was a marked increase in cTnI in all study participants that competed in the race. Immediately following the race, cTnI was 50.5 (28.5–71.9) ng/l, increasing to 69.3 (42.3–97.7) ng/l at 3 h and declining to 14.2 (8.5–27.9) ng/l at 24 h. There was a highly significant increase in cTnI from baseline at all time points (p < 0.0001). Immediately following the race, 68 participants (70%) had cTnI above the upper limit of normal (cTnI values > 30.0 ng/l). At 3 h 80 study participants (82%), and at 24 h 20 study participants (21%) had cTnI above upper limit of normal. In contrast to cTnI, the highest values for BNP and CRP were at 24 h following the race.
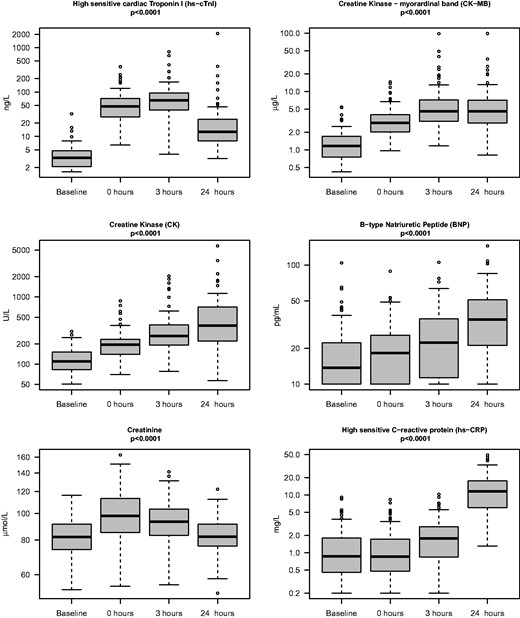
The profiles of six selected biomarkers in 97 participants before and 0, 3 and 24 h after the 91 km mountain bike competition ‘The North Sea Race’. Boxes denote medians, 25th and 50th percentiles and ranges, as well as outliners. There was a highly significant (p < 0.0001) increase in all biomarkers following the race.
Patients with CAD
None of the cyclists participating in the study had symptoms of CAD during or after the race. There were no specific ECG changes suggestive of acute ischaemia. A large increase in cTnI was noted in one study participant 24 h following completion of the race (cTnI = 2081 ng/l). Coronary angiography of this patient demonstrated a chronic occlusion of the right coronary artery, and a significant stenosis of the left anterior descending (LAD) artery (Figure 2). CT coronary angiography/conventional coronary angiography were performed in a total of 13 cyclists with the highest maximum cTnI values (Figure 3). CT coronary angiography in these participants demonstrated significant CAD in two more cyclists, confirmed by conventional coronary angiography. The three cyclists with CAD had three of the four highest max cTnI values (Table 2, Figure 3). They also had the three highest mean cTnI values (mean of all four time-points) among all participants in the study. None of the highest cTnI values were found immediately following completion of the race (Table 2). In two of the cyclists with coronary artery stenosis, the highest cTnI value was reached 24 h following the competition. The third cyclist with plaque rupture achieved maximum cTnI at 3 h following the race. No CAD was found in the 10 study participants that were assessed by CT coronary angiography with max cTnI < 370 ng/l. To establish a reference interval for detection of CAD, the maximal value of cTnI at 3 h and 24 h was used. The values were log transformed and fitted well with a normal distribution. A lower limit for the cTnI value indicative of CAD was calculated (201 ng/l (95% CI 156–272). Since the lowest cTnI in the cohort assessed by CT coronary angiography was 146 ng/l, no further CT coronary angiographies were performed in participants with cTnI values < 146 ng/l.
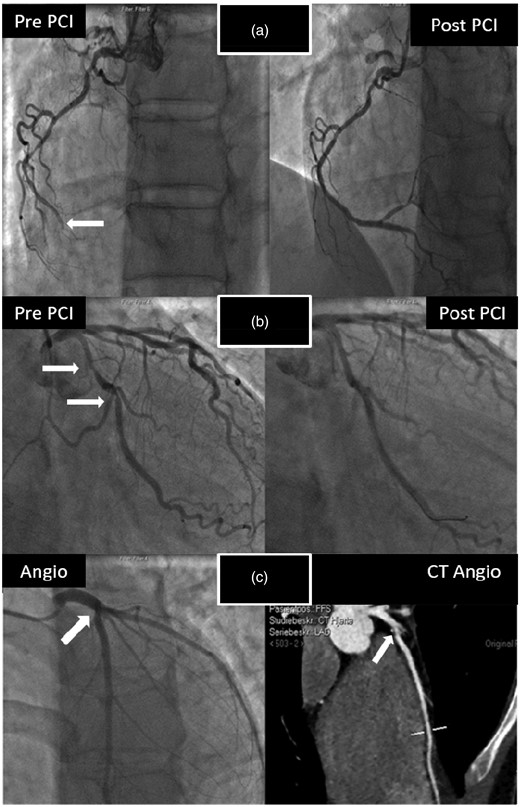
Coronary angiograms and computed tomographic (CT) coronary angiography in the three presumably healthy male cyclists with coronary artery disease (CAD) participating in a 91 km mountain bike race (‘Nordsjørittet’) 2013. All three were experienced competitive leisure-sports athletes that had participated in ≥ 5 endurance competitions during the past five years. None of them had symptoms of CAD during or after the race and there were no changes in the rest electrocardiograms (ECGs) suggestive of ischaemia at any time-point. The first cyclist had the largest increase in cardiac troponin I (cTnI) of all participants in the study; with a substantial increase in cTnI at 3 h with a continued increase at 24 h. Coronary angiography demonstrated a significant left anterior descending (LAD) artery stenosis and an occluded right coronary artery (white arrow) that was revascularised by percutaneous coronary intervention (PCI) (Figure 2(a)). The second cyclist's highest cTnI value 24 h following the race. Coronary angiography demonstrated stenosis of the proximal portion of the circumflex artery (white arrows, Figure 2(b)). The third cyclist was a 22-year-old male with highest cTnI value recorded 3 h following the race. CT coronary angiography detected a ruptured and calcified plaque in the proximal portion of the LAD (white arrow), later confirmed by coronary angiography (Figure 2(c)).
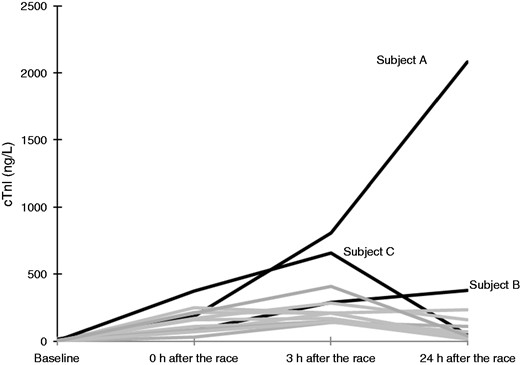
A total of 13 subjects were assessed by computed tomographic (CT) coronary angiography or conventional angiography. They had the highest cardiac troponin I (cTnI) values after the race. This figure portrays the cTnI profiles of these individuals. Subject A, B and C refers to the same subjects as those in Table 2.
Baseline characteristics and competitive performance in recreational cyclists participating in the 91 km long ‘North Sea Race’ in 2013 (n = 97).
| cTnI < 140 (ng/l) | cTnI > 140 (ng/l) | Subject A | Subject B | Subject C | |
|---|---|---|---|---|---|
| Total (n) | 84 | 10 | 1 | 1 | 1 |
| CT/coronary angiography (n) | 0 | 10 | 1 | 1 | 1 |
| Sex (M/F) | 64/20 | 7/3 | 1/0 | 1/0 | 1/0 |
| Age (years) | 44 ± 9.0 | 35 ± 6.2 | 57 | 64 | 22 |
| Race time (h) | 4.1 (3.7–4.8) | 3.7 (3.2–4.6) | 4.12 | 4.17 | 4.22 |
| Max heart rate (bpm) | 180 (174–188) | 181 (175–189) | 162 | 161 | 184 |
| Max heart rate (%) | 97 (95–100) | 95 (90–97) | 94 | 94 | 92 |
| Mean heart rate (bpm) | 156 (148–167) | 163 (148–171) | 151 | 155 | 166 |
| Mean heart rate (%) | 85 (82–88) | 87 (78–88) | 87 | 87 | 83 |
| TnI baseline (ng/l) | 3.4 (2.5–4.8) | 2.1 (1.8–3.3) | 13.2 | 5.8 | 3.7 |
| cTnI 0 h (ng/l) | 47 (27.6–68.3) | 137 (73.7–200.2) | 186 | 80 | 372 |
| cTnI 3 h (ng/l) | 61 (40.0–81.0) | 160 (146.7–266.7) | 808 | 290 | 660 |
| cTnI 24 h (ng/l) | 12 (7.9–22.2) | 34 (28.3–102.3) | 2081 | 380 | 47 |
| Average cTnI (ng/l) | 32 ± 14.7 | 102 ± 40.9 | 772 | 189 | 271 |
Study subjects are divided into participants with low cTnI (<140 ng/l) that were not assessed by computed tomographic (CT) coronary angiography (n = 84), subjects with high troponin I (cTnI) (>140 ng/l) that had normal coronary arteries after assessment by CT, and the three subjects that had coronary artery disease (CAD) as discovered by high cTnI and CT coronary angiography. Continuous variables are expressed as mean ± standard deviation (SD), median (25–75 percentile) if skewed distributions.
Discussion
The present study adds to earlier publications and extends previous work beyond the purely athletic populations that have typically been studied. Our findings support the presence of a pathological exercise induced cTnI response in recreational athletes with silent CAD. This cTnI response may both be characterised by an excessive cTnI increase and a pathological cTnI pattern.
Physiological cTn response following exercise
There is a moderate cTn increase both during and following physical exercise that likely represents a physiological phenomenon. Some early echocardiographic studies suggested a relationship between cTn levels and cardiac dysfunction following exercise.13,20,21 However, subsequent cardiac magnetic resonance (CMR) studies have not found any evidence of cardiac damage or fibrosis.20,22
The activity related cTn response is moderate and characterised by a biphasic pattern with an initial rapid increase and decrease in cTn during activity, and a secondary cTn increase following exercise.23 In cytosol cTn exists in an unbound form at a total of 6–8% of cardiac troponin T (cTnT) and 3.5% of cTnI.24 The physiological cTn increase may in part be due to a release of cytosolic cTn without cellular damage. However, the precise mechanisms causing the activity related cTn release are still unclear. Several mechanisms have been hypothesised: Stretch-related mechanisms mediated by integrins of viable cardiomyocytes may lead to increased permeability,6 reactive oxygen species causing lipid peroxidation may cause membrane disruption,4 and degradation products may cause ‘bleb’ formation.2
The difference in cTn response following myocardial infarction and exercise
Following myocardial infarction the dominant release of cTn is due to cardiomyocyte necrosis.6 We have previously demonstrated that both maximum cTnT levels and the duration of cTnT release following revascularised myocardial infarction (MI) are strongly related to the size and severity of myocardial damage assessed by cardiac MRI.24 There are two major differences in cTn response following physical exercise and myocardial infarction: Firstly, the increase in cTn due to MI is much larger than the modest increase in cTn following physical exercise: the maximum cTnI may exceed 100 000 ng/l following MI26 whereas exercise induced cTnI did not exceed 370 ng/l in subjects with normal coronary arteries in our study. Secondly, the maximum cTn following physical exercise is reached between 2–5 h,23,27 whereas the maximum cTn following myocardial infarction is reached between 11–12 h.26 As a result, it may be hypothesised that blood sampling for the detection of subclinical CAD should be performed late rather than early following physical exercise.
The cTn response in relation to intensity and duration of exercise
A recent study by Benda et al. found no difference in post exercise cTn levels between patients with stable CAD disease and healthy controls that walked between 30 and 40 km per day for three consecutive days.28 Heart rate is a major determinant of ischemia, the increase in heart rate occurs primarily at the expense of diastolic blood flow.29 In the study by Benda et al. a matched coronary perfusion and a low heart rate during exercise most likely did not induce substantial ischemia. In a study by Lee et al., a short period of transient myocardial ischemia did not result in a clinically relevant acute release of cTn into blood.30 In contrast, in our study, all three cyclists with excessive cTnI release had high heart rates during the competition and exercise duration of > 4 h (Table 2). Taken together, these findings underscore that a perfusion mismatch must be of sufficient severity and duration if a pathologic cTn response is to be anticipated. Therefore, when considering the cTnI response following exercise, it is necessary to include measures of both duration and intensity of cardiac workload.
Clinical implications of highly elevated cTnI values following exercise
The present study has several important clinical implications. Firstly, there was no difference in cTnI levels acquired immediately following exercise between participants with CAD and without CAD. This finding suggests that obtaining a cTnI sample shortly following exercise could result in false negative results. The current study suggests that there may be a cTnI threshold level indicating increased risk of CAD in individuals with cTnI values exceeding this level. There are large temporal changes in cTnI levels following exercise. It is therefore expected that a cTnI threshold level will depend upon when the sample is acquired following exercise. This needs to be assessed in future studies. The three cyclists with CAD were asymptomatic. This finding underscores that significant ischemia may be present in asymptomatic recreational athletes. Finally, we would emphasise that if cTn based detection limits for CAD can be verified in future prospective trials, it may suggest a potential role for cTn in the detection of subclinical CAD in athletes participating in endurance sports.
Limitations
The study only applied coronary angiography to assess athletes with the highest cTnI levels. We therefore cannot be certain about the prevalence of asymptomatic CAD in participants with lower cTnI. Future research in this field should include a control group consisting of participants with normal cTn profiles. Also, only three persons with CAD were identified. This number is too small to establish the cTnI detection level that might be used to identify patients with CAD. The potential detection limits for CAD remain to be established in larger prospective studies.
Conclusions
This study suggests that there is a pathologic cTnI response following exercise in persons with subclinical CAD. This response may be associated with an excessive cTnI increase at 3 and 24 h following prolonged high intensity exercise. These findings may suggest a potential role for cTnI in the detection of silent CAD among persons participating in high-intensity endurance sport.
Author contribution
SØ, TM and ØS contributed to the conception or design of the work. ØS, ØK, TM, SØ, TA, RB, MB, OJG, BA and JS contributed to the acquisition, analysis, or interpretation of data for the work. ØS, ØK and SØ drafted the manuscript. KD critically revised the manuscript. All gave final approval and agree to be accountable for all aspects of work ensuring integrity and accuracy.
Declaration of conflicting interests
The author(s) declared the following potential conflicts of interest with respect to the research, authorship, and/or publication of this article: Øyvind Skadberg has received lecture fees from Abbott Diagnostics. Rolf Bergseth is a medical advisor of the North Sea Race. Tor Melberg, Øyunn Kleiven, Magnus Bergseth, Jone Selvåg, Bjørn Auestad, Ole J Greve, Kenneth Dickstein, Torbjørn Aarsland and Stein Ørn have no conflicts of interest to declare.
Funding
The author(s) disclosed receipt of the following financial support for the research, authorship, and/or publication of this article: The project has been funded by a non-restricted grant from the North Sea Race Organisation (‘Nordsjørittet’), the Laerdal foundation, Stavanger, Norway and from Abbott Diagnostics (Abbott Diagnostics, Illinois, USA).

Comments