


Abstract
In patients with heart failure, inflammation has been associated with worse functional capacity, but it is uncertain whether it could affect their response to exercise training. We evaluated whether inflammatory biomarkers are related to differential effect of exercise on the peak oxygen uptake (V˙O2) among patients with heart failure.
Open, parallel group, randomized controlled trial.
Patients with heart failure and ejection fraction ≤0.4 were randomized into exercise training or control for 12 weeks. Patients were classified according to: 1) inflammatory biomarkers blood levels, defined as ‘low’ if both interleukin-6 and tumor necrosis factor-alpha blood levels were below median, and ‘high’ otherwise; and 2) galectin-3 blood levels, which also reflect pro-fibrotic processes.
Forty-four participants (50 ± 7 years old, 55% men, 25% ischemic) were allocated to exercise training (n = 28) or control (n = 16). Exercise significantly improved peak V˙O2 among participants with ‘low’ inflammatory biomarkers (3.5 ± 0.9 vs. −0.7 ± 1.1 ml/kg per min, p = 0.006), as compared with control, but not among those with ‘high’ inflammatory biomarkers (0.4 ± 0.6 vs. −0.2 ± 0.7 ml/kg per min, p = 0.54, p for interaction = 0.009). Similarly, exercise improved peak V˙O2 among participants with below median (2.4 ± 0.8 vs. −0.3 ± 0.9 ml/kg per min, p = 0.032), but not among those with above median galectin-3 blood levels (0.3 ± 0.7 vs. −0.7 ± 1.0 ml/kg per min, p = 0.41, p for interaction = 0.053).
In patients with heart failure, levels of biomarkers that reflect pro-inflammatory and pro-fibrotic processes were associated with differential effect of exercise on functional capacity. Further studies should evaluate whether exercise training can improve clinical outcomes in patients with heart failure and low levels of these biomarkers.
Introduction
Heart failure is a multi-systemic disease that affects the cardiovascular, renal, neurohormonal, musculoskeletal and immune system.1 Activation of inflammatory mediators can play a role in the pathophysiology of heart failure, because patients with heart failure display elevated blood levels of inflammatory biomarkers, such as tumor necrosis factor alpha (TNF-alpha) and interleukin-6 (IL-6).2–5 It has been postulated that inflammation contributes to the progression and worsening of heart failure, as high levels of these biomarkers have been associated with poor prognosis among patients with heart failure.2,3,6–11
Patients with heart failure display low functional capacity, as a result of abnormalities in cardiac output, systemic vascular resistance and peripheral oxygen extraction during effort.12 Furthermore, circulating levels of inflammatory biomarkers appear to be inversely associated with functional capacity, suggesting that inflammation can play a role in the pathogenesis of exercise intolerance.10 Functional capacity can improve with exercise training, which can revert many of these abnormalities, although the response to exercise varies across individuals with heart failure.13–16 Previous studies have suggested that exercise has anti-inflammatory effects in patients with heart failure, reducing the circulating levels of proinflammatory cytokines, such as TNF-alpha and IL-6.17–20 However, it is still uncertain whether there is a linkage pathway between the pro-inflammatory state and low functional capacity observed in patients with heart failure. Previous studies did not evaluate whether inflammation can affect the effect of exercise on functional capacity.
Therefore, we evaluated whether blood levels of the inflammatory cytokines IL-6, TNF-alpha and galectin-3, which also reflects pro-fibrotic processes, modify the effect of exercise training on peak oxygen uptake (V˙O2) among patients with heart failure.
Methods
Study design
This is a single-center multi-arm parallel and controlled clinical trial comparing the effects of 12 weeks of aerobic exercise on functional capacity in patients with heart failure (www.clinicaltrials.gov, number NCT02448147). The study complied with the Declaration of Helsinki and the Research Ethics Board of the institution approved the study (Heart Institute – University of Sao Paulo School of Medicine). All participants provided written informed consent.
The investigators (MMF, GVG) allocated patients to aerobic interval training, moderated continuous training or control with a 1:1:1 randomization using a drawing of lots. They were submitted to cardiopulmonary exercise testing (CPET) before and after the exercise program, which lasted 12 weeks. Serum levels of the inflammatory biomarkers IL-6, TNF-alpha and galectin-3 were obtained at baseline and after the exercise program. All patients were instructed to keep taking their medications throughout the study period.
Population
We assessed the eligibility of non-consecutive patients attending a heart failure section of a tertiary hospital from May 2011 to April 2013. The inclusion criteria at screening were age between 30 and 60 years, at least one previous hospitalization for decompensated heart failure, left ventricle ejection fraction ≤40% determined by echocardiogram in the previous 12 months, being under optimized clinical treatment and stable during the previous six weeks and able to perform exercise training three times a week. Patients with asthma or chronic obstructive pulmonary disease using inhaled corticosteroids, functional class IV (New York Heart Association (NYHA)), complex ventricular arrhythmia, chronic renal insufficiency (serum creatinine above 2.5 mg/dl), intermittent claudication, morbid obesity, cirrhosis, alcoholism, using illicit drugs, performing regular physical activity were not eligible. We also excluded participants with a peak respiratory exchange ratio lower than 1.00 at the CPET at the beginning of study.
Cardiopulmonary exercise testing
After inclusion, participants underwent a maximum CPET in a programmable cycloergometer (Union, Brazil) using ramp protocol. The workload increment was individualized at a rate of 5, 10 or 15 W/min. Patients were instructed to maintain a pedaling frequency of between 60 and 70 per minute and were stimulated to exercise until exhaustion. Nevertheless, the exercise testing would be terminated in the case of a drop in systolic blood pressure more than 10 mmHg from baseline, moderate to severe angina, symptoms (ataxia, dizziness or near-syncope) or signs of poor perfusion (cyanosis or pallor), sustained ventricular tachycardia, frequent episodes of multifocal premature ventricular contractions (PVCs) or triplets of PVCs, ST or QRS changes suggestive of ischemia according to guidelines for exercise testing from the American College of Cardiology and American Heart Association.21 The test was performed in a controlled-temperature room (21–23℃) with continuous monitoring of 12-lead electrocardiogram (CardioSoft 6.5; GE Medical Systems IT, Milwaukee, WI, USA) as previously described.22 After intervention, the CPET was repeated between 24 and 72 h after the last training session at the same period of the day, using the same ramp protocol as the baseline. All participants were instructed to take all medications on the test day.
Ventilation (V˙E), V˙O2 and carbon dioxide output (V˙CO2) were obtained breath-by-breath with a metabolic cart (Vmax Encore29; SensorMedics Corp., Yorba Linda, CA, USA). Variables were analyzed with 30 s average sample and the highest V˙O2 at the end of exercise was considered as peak V˙O2.
The anaerobic threshold (AT) and the respiratory compensatory point (RCP) were determined as described elsewhere.23 The V˙E–V˙CO2 slope was calculated by automatic linear regression fitting the relationship between V˙E and V˙CO2 with the breath-by-breath values obtained throughout the whole exercise. A blinded investigator, who was unaware of to which group the patient was allocated, performed all CPET measures.
Exercise training
The exercise program consisted of three supervised sessions a week, during 12 weeks. Each exercise session was performed in a cycloergometer during 30 min, added to 5-min warming and cool-down respectively. Those who missed five consecutive sessions or did not attend at least 70% of the total (26 sessions) were excluded from analysis.
Exercise intensity was determined according to the heart rate (HR) in AT and RCP points.24 The aerobic interval training comprised alternated intensity, with 1 min at the RCP HR and 2 min at AT HR. The target HR for the moderate continuous training was calculated as target HR = [RCP HR + 2 × (AT HR)]/3, resulting in equivalent average workload at the end of the 30 min. Participants were instructed to exercise themselves at target HR ± 4 beats/min during the stimulus phase. The sessions were monitored with HR monitors (Beat, Polar Eletro, Kempele Inc., Finland) and were supervised by an instructor who also checked for adequacy of the exercise, within the pre-specified HR. The perceived effort was also monitored and kept between 11 and 14 in the Borg scale, particularly for patients who were not in sinus rhythm (e.g. atrial fibrillation or pacemaker).25 The exercise was interrupted in the case of clinically relevant symptoms such as chest pain, dizziness, syncope or patient requesting.
Biomarkers
Blood samples were obtained by venipuncture after 20 min of rest and 8 h fasting. They were collected before the exercise program and between 18 and 72 h after the last session. Immediately after collection, the blood samples were submitted to 2000 g0 centrifugation at 4℃ during 10 min and the serum was stored at −70℃ until analysis.
IL-6, TNF-alpha and galectin-3 were measured through Milliplex® MAP (multi-analyte panels) kits using Luminex™ xMAP (Multiple Analyte Profiling) technology (EMD Millipore Corporation, Germany). The procedures were performed according to the fabricant instructions by an external laboratory, blinded for the allocation group. Specific kits for each analysis were used, with intra-assay coefficient of variation (CV) = 1%, and inter-assay CV = 10% for IL-6; intra-assay CV = 3%, inter-assay CV = 19% for TNF-α; intra-assay CV = 5%, and inter-assay CV = 13% for galectin-3.
Statistical analysis
Analyses were conducted using Stata v.13.1 (Stata Corp., College Station, TX, USA). We used the Shapiro–Wilk test to examine the Gaussian distribution of the data. Continuous variables are presented as mean (standard deviation) or median (25th, 75th percentiles) as appropriate. To detect a 2.0 ml/kg per min increase in peak V˙O2, with a two-sided 5% significance level and 80% power, the sample size was 12 patients in each group. For the purpose of this analysis, patients allocated to aerobic interval and moderate continuous were evaluated together as one exercise group in order to have enough data to test for effect modification in this study. A sensitivity analysis with participants grouped as originally allocated is presented as Supplementary Material online. Baseline characteristics were compared between the exercise and control group, using t-test, Wilcoxon rank-sum or exact Fisher test, as suitable. Then, we performed a univariate linear regression analysis to test the associations between clinical characteristics and the inflammatory biomarkers. Further, we performed a multivariate linear regression analysis to test independently the association of inflammatory biomarkers with CPET parameters, adjusting for significant baseline clinical characteristics in the univariate linear regression (except functional class). Subsequently, we tested whether the effect of exercise on peak V˙O2 differed according to baseline levels of inflammatory biomarkers. We classified the participants according to levels of inflammatory biomarkers: ‘low’ if both IL-6 and TNF-alpha levels were below median, and ‘high’ if the level of one of them was above median. We assessed the differential effect of exercise on peak V˙O2 change via a group (low/high inflammation)–group (exercise/control) interaction term. Because galectin-3 also reflects pro-fibrotic processes, we performed a separate analysis classifying the participants according to its levels: above or below median. For the interaction term, p-values less than 0.10 were considered significant. For all other analysis, significance level was set as p < 0.05.
Results
Subject characteristics
Figure 1 shows the flow diagram of patients in the study. From 602 patients accessed, 56 were randomized in the three groups. Among them, 12 participants did not conclude the protocol. Nine participants withdrew consent for reasons unrelated to their clinical status. Two in the exercise group had an episode of acute heart failure and discontinued intervention. We lost contact with one patient in the control group before undergoing the final evaluation. Hence, 44 participants completed the protocol: 28 in the exercise group and 16 in the control group. These participants did not report any clinically relevant cardiovascular symptoms during the study.
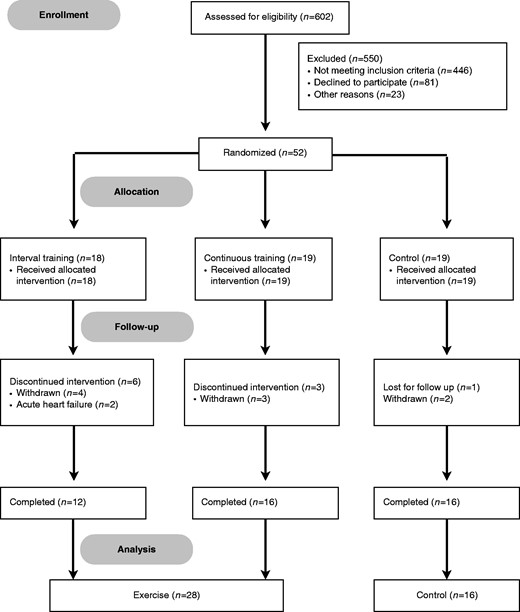
Flow diagram of patients in the study.
At baseline, clinical, laboratorial and exercise characteristics of the participants were similar between exercise and control groups (Table 1). All patients were under guideline-directed medical therapy, including angiotensin-converting enzyme inhibitors or angiotensin receptor blocker and beta-blockers, at maximum tolerated doses.
Baseline characteristics according to allocated group.
| Exercise | Control | ||
|---|---|---|---|
| Parameters | n = 28 | n = 16 | p value |
| Age, years | 51 (7) | 48 (7) | 0.14 |
| Male sex, n (%) | 14 (50) | 10 (62) | 0.53 |
| White race, n (%) | 19 (68) | 13 (81) | 0.34 |
| BMI, kg/m2 | 29 (4) | 28 (4) | 0.34 |
| Hypertension, n (%) | 15 (54) | 7 (44) | 0.76 |
| Diabetes mellitus, n (%) | 6 (21) | 3 (19) | 0.99 |
| LV ejection fraction, % | 29.6 (6.1) | 29.3 (6.6) | 0.9 |
| Ischemic etiology, n (%) | 8 (29) | 3 (19) | 0.72 |
| Functional class, NYHA | 0.58 | ||
| I | 5 (18) | 3 (19) | |
| II | 13 (46) | 5 (31) | |
| III | 10 (36) | 8 (50) | |
| Systolic BP, mmHg | 109 (19) | 102 (11) | 0.21 |
| Diastolic BP, mmHg | 61 (15) | 58 (9) | 0.47 |
| Carvedilol daily dose, mga | 50 (50, 75) | 50 (50, 100) | 0.93 |
| Cardiopulmonary exercise testing | |||
| Exercise time, min | 10 (2) | 10 (2) | 0.96 |
| Rest HR, beats/min | 71 (13) | 76 (9) | 0.17 |
| Peak HR, beats/min | 118 (24) | 113 (18) | 0.53 |
| Peak RER | 1.13 (0.10) | 1.13 (0.09) | 0.91 |
| Peak V˙O2, ml/kg per min | 15.1 (4.5) | 14.8 (4.0) | 0.84 |
| Peak workload, W | 70 (31) | 63 (27) | 0.46 |
| V˙E–V˙CO2 slope | 35 (7) | 36 (8) | 0.53 |
| Serum biomarkers | |||
| IL-6, pg/ml | 1.9 (0.9, 3.8) | 1.0 (0.5, 4.1) | 0.56 |
| TNF-alpha, pg/ml | 5.4 (4.2, 6.5) | 5.2 (3.4, 7.6) | 0.68 |
| Galectin-3, ng/ml | 6.2 (2.0) | 6.4 (2.2) | 0.86 |
Continuous data are presented as mean (SD) or median (25th percentile, 75th percentile). Discrete data are presented as number (%).
All patients but one were taking carvedilol.
BMI: body mass index; LV: left ventricle; NYHA: New York Heart Association classification; BP: blood pressure; HR: heart rate; RER: respiratory exchange ratio; V˙O2: oxygen uptake; V˙E–V˙CO2 slope: relationship between ventilation and carbon dioxide output; IL-6: interleukin 6; TNF-alpha: tumor necrosis factor alpha
Inflammatory biomarkers and functional capacity
Among baseline clinical characteristics, age was directly associated with serum levels of IL-6. Although with borderline significance, functional class (NYHA) was also associated with serum levels of IL-6 and TNF-alpha, where patients with worse functional class displayed higher levels of these inflammatory biomarkers (Table 2). After adjusting for age, serum levels of IL-6, TNF-alpha and galectin-3 appear to be inversely associated with peak V˙O2, although not statistically significant (Figure 2(a) to (c)). Moreover, higher levels of these biomarkers were associated with higher V˙E–V˙CO2 slope, but only the association between TNF-alpha blood levels and V˙E–V˙CO2 slope was statistically significant after adjusting for age (p for trend = 0.022, Figure 2(d) to (f)).
Relationship of clinical characteristics with inflammatory biomarkers.
| Interleukin-6 | TNF-alpha | Galectin-3 | ||||
|---|---|---|---|---|---|---|
| Parameters | β (SE) | p | β (SE) | p | β (SE) | p |
| Age, years | 0.06 (0.03) | 0.026 | 0.05 (0.05) | 0.28 | −0.04 (0.04) | 0.36 |
| Male sex | 0.56 (0.41) | 0.18 | 1.22 (0.67) | 0.076 | −0.51 (0.62) | 0.42 |
| BMI, kg/m2 | 0.06 (0.05) | 0.19 | 0.02 (0.08) | 0.77 | −0.03 (0.07) | 0.76 |
| Hypertension | 0.54 (0.41) | 0.20 | −0.74 (0.69) | 0.29 | 0.18 (0.62) | 0.77 |
| Diabetes mellitus | 0.32 (0.51) | 0.54 | 0.78 (0.85) | 0.37 | −0.56 (0.77) | 0.47 |
| Ischemic etiology | 0.65 (0.47) | 0.18 | 0.60 (0.80) | 0.46 | −0.29 (0.72) | 0.69 |
| Functional class, NYHA | 0.54 (0.27) | 0.052 | 0.93 (0.45) | 0.047 | 0.45 (0.42) | 0.29 |
| Systolic BP, mmHg | 0.01 (0.01) | 0.55 | −0.03 (0.02) | 0.21 | −0.01 (0.02) | 0.74 |
| Diastolic BP, mmHg | 0.02 (0.02) | 0.30 | −0.03 (0.03) | 0.23 | −0.01 (0.02) | 0.55 |
| LV ejection fraction, % | −0.03 (0.03) | 0.38 | −0.04 (0.06) | 0.45 | −0.01 (0.05) | 0.89 |
Data are β coefficients and standard errors (SE), which represent the change in each inflammatory biomarker for one-unit increase in the predictor. Interleukin-6 level values were log transformed.
TNF-alpha: tumor necrosis factor alpha; BMI: body mass index; NYHA: New York Heart Association classification; BP: blood pressure; LV: left ventricle
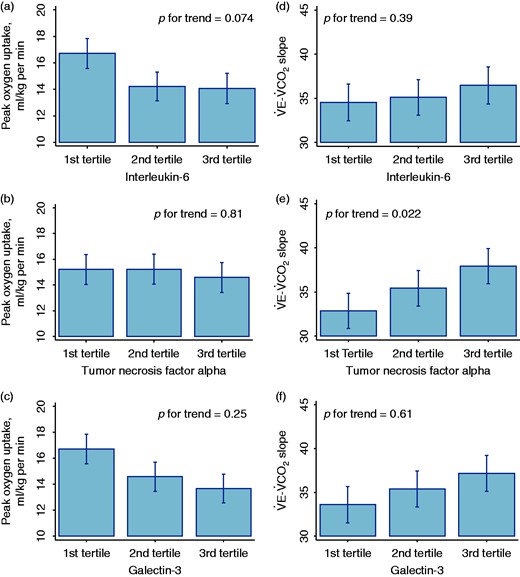
Association of blood levels of interleukin-6 ((a) and (d)), tumor necrosis factor alpha ((b) and (e)) and galectin-3 ((c) and (f)) with peak oxygen uptake and V˙E–V˙CO2 slope respectively.
Inflammatory biomarkers and effect of exercise
Changes in inflammatory biomarkers after 12-week exercise did not differ from changes in 12 weeks in the control group (Table 3). Among participants with low levels of inflammatory biomarkers at baseline, as defined by below median IL-6 and TNF-alpha serum levels, exercise significantly improved peak V˙O2 (3.5 (0.9) vs. −0.7 (1.1) ml/kg per min, p = 0.006), as compared with controls (Figure 3). Nevertheless, among those with either IL-6 or TNF-alpha serum levels above median, 12-week changes in peak V˙O2 were similar between exercise and control (0.4 (0.6) vs. −0.2 (0.7) ml/kg per min, p = 0.54], with significant exercise-inflammatory biomarkers interaction (p for interaction = 0.009, Figure 3). These differences remained significant after adding baseline V˙E–V˙CO2 slope and peak V˙O2 to the model (p for interaction = 0.035), suggesting that they were independent of baseline functional parameters. Also, such differential effect appears to be more pronounced with interval exercise, but the number of participants with low inflammation performing moderate continuous exercise was too small to allow inferences on the modality of exercise (Supplementary Material Figure 1 online). Baseline characteristics were similar between ‘low’ and ‘high’ levels of inflammatory biomarkers groups (Supplementary Table 1), albeit the low inflammation group was more likely to be women.
Change in serum biomarkers from baseline to 12-week follow-up.
| Exercise n = 28 | Control n = 16 | p value | |
|---|---|---|---|
| Change in IL-6, pg/ml | −0.1 (−0.6, 0.6) | 0.3 (−0.1, 0.9) | 0.18 |
| Change in TNF-alpha, pg/ml | 0.0 (−0.6, 0.5) | 0.2 (−0.3, 0.5) | 0.50 |
| Change in galectin-3, pg/ml | −0.5 (2.0) | −0.8 (2.1) | 0.69 |
| Exercise n = 28 | Control n = 16 | p value | |
|---|---|---|---|
| Change in IL-6, pg/ml | −0.1 (−0.6, 0.6) | 0.3 (−0.1, 0.9) | 0.18 |
| Change in TNF-alpha, pg/ml | 0.0 (−0.6, 0.5) | 0.2 (−0.3, 0.5) | 0.50 |
| Change in galectin-3, pg/ml | −0.5 (2.0) | −0.8 (2.1) | 0.69 |
Data are presented as mean (SD) or median (25th percentile, 75th percentile).
IL-6: interleukin-6; TNF-alpha: tumor necrosis factor alpha

Effect of exercise on peak oxygen uptake in patients with heart failure according to inflammatory biomarkers blood levels. Low inflammation – blood levels of both interleukin-6 and tumor necrosis factor alpha are below median; high inflammation – blood levels of either interleukin-6 or tumor necrosis factor alpha are above median.
*p = 0.006
V˙O2: oxygen uptake
We observed similar results when we classified the participants according to galectin-3 serum levels: among participants with below median levels, exercise significantly improved peak V˙O2 (2.4 (0.8) vs. −0.3 (0.9) ml/kg per min, p = 0.032), compared with control, but not among those with above median levels (0.3 (0.7) vs. −0.7 (1.0) ml/kg per min, p = 0.41, p for interaction = 0.053, Figure 4). These results were consistent when we divided the participants according to the mode of exercise (Supplementary Figure 2). All baseline clinical characteristics were similar across galectin-3 blood levels (Supplementary Table 2).
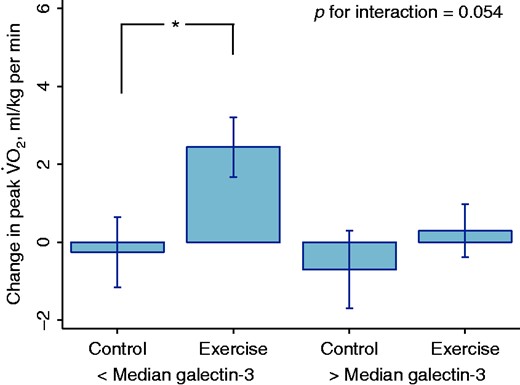
Effect of exercise on peak oxygen uptake in patients with heart failure according to galectin-3 blood levels.
*p = 0.032
V˙O2: oxygen uptake
Discussion
The main finding of our study is that 12-week aerobic exercise has differential effect on functional capacity according to blood levels of biomarkers reflecting pro-inflammatory and pro-fibrotic processes. Low levels of these biomarkers appear to identify patients with heart failure that will mostly benefit from an exercise program, as they will experience better peak V˙O2 improvement. These findings suggest that inflammation can partially explain the heterogeneous response to exercise and be implicated in the functional impairment of patients with heart failure. More importantly, they imply that these biomarkers can help to improve the management of these patients, through tailoring effective interventions based on their predicted response to exercise.
Previous studies have shown that the improvement in functional capacity with exercise differs according to disease and subject-related characteristics.26–28 In the HF-ACTION study, patients with heart failure were classified through cluster analysis in four different phenotypes that differed from each other regarding their overall prognosis and the effect of exercise on cardiovascular mortality and heart failure hospitalization.27 The patients in the phenotype that displayed the largest peak V˙O2 improvement with three-month exercise were the youngest, mainly had heart failure from non-ischemic causes and apparently less advanced heart failure, as reflected by low V˙E–V˙CO2 slope in the CPET and low blood levels of galectin-3, in concordance with our findings. Another sub-analysis from the HF-ACTION study showed an association of elevated or worsening high-sensitivity C-reactive protein and N-terminal pro-B-type natriuretic peptide blood levels with lower peak V˙O2 over time.28 We clarify for the first time that the response to exercise is associated with blood levels of other biomarkers associated with pro-inflammatory processes, IL-6 and TNF-alpha.
Exercise has beneficial effects that can mediate the improvement in functional capacity, such as endothelial function and regeneration,29 but its effect on inflammation in patients with heart failure is still not well understood. In healthy individuals, it appears to exist an ‘acute phase response’ to exercise, where inflammatory biomarkers, particularly IL-6, increase in the blood soon after strenuous exercise and diminish after a few days.30,31 Regardless of its acute effects, some studies have suggested that ‘chronic’ exercise has anti-inflammatory effects because it reduces blood levels and muscular expression of IL-6, TNF-alpha and other pro-inflammatory cytokines.17,18 Noteworthy, most participants in these studies were not taking beta-blockers.17,18 On the other hand, exercise did not significantly change the blood levels of these inflammatory biomarkers in our study, in which all patients were under optimized clinical treatment according to current guidelines.32 Such divergent results may be related to different populations and treatment for heart failure. Indeed, an analysis of the HF-ACTION study failed to demonstrate a significant reduction of the blood levels of high-sensitivity C-reactive protein after three months of exercise.33
Our study showed a blunted improvement in peak V˙O2 with exercise among patients with high levels of inflammatory biomarkers, which suggests that inflammation contributes to their functional impairment. Nevertheless, therapy with anti-inflammatory drugs does not appear to improve the functional capacity of patients with heart failure.34 In a recent randomized clinical trial, colchicine reduced the blood levels of inflammatory biomarkers but failed to improve functional class and exercise tolerance, as reflected by treadmill stress testing time, compared with placebo.35 Our study gives another perspective on the association between inflammation and functional capacity, in which inflammation can affect the effect of exercise on functional capacity. Further studies should investigate whether therapy with anti-inflammatory drugs added to exercise training can have greater impact on the functional capacity of patients with heart failure.
Different conceivable reasons can help explain our findings. First, inflammation can merely be an epiphenomenon, not implicated in the functional impairment of patients with heart failure. Elevated circulating levels of biomarkers of inflammation are associated with poor prognosis and indicate more severe disease.3,6 Patients with more severe heart failure display increased sympathetic activity, which has been implicated in the origin of inflammation.36,37 Increased sympathetic activity leads to peripheral vasoconstriction and could counteract the exercise-induced endothelium-dependent changes in peripheral blood flow, inhibiting the improvement in peak V˙O2. Alternatively, inflammation may directly inhibit the beneficial effects of exercise. For instance, IL-6 can affect the oxygen uptake by exercising muscles. Acting through signaling transduction by a transmembrane receptor unit glycoprotein 130, IL-6 can cause endothelial dysfunction, reduced mitochondrial activity and skeletal muscle apoptosis.36 Such effects would limit the improvement in peak V˙O2 with exercise.
Our study has some limitations that deserve attention. This was a randomized trial performed in one center, and applies only to clinically stable patients under guideline-directed medical therapy for heart failure who can complete a 12-week exercise program, with at least 70% compliance. Also, we used above median levels of either IL-6 or TNF-alpha to classify the participants as having a high level of inflammation. Although we recognize that this may be a sensitive definition, there is no gold standard to classify the level of inflammation in patients with heart failure, and these biomarkers may reflect a variety of biological phenomena. Besides, this is a post-hoc analysis and the randomization was not stratified by inflammatory status, which limits our findings for causal inference of exercise on functional capacity within each inflammatory group. Finally, we grouped two different modalities of exercise, aerobic interval and moderate continuous training, in order to have enough observations to test the differential effect of exercise according to baseline levels of biomarkers. To address this limitation, we performed a sensitivity analysis with these two exercise groups, and the results consistently suggested a differential effect of exercise according to baseline levels of biomarkers (Supplementary Figures 1 and 2).
In conclusion, high blood levels of biomarkers that reflect pro-inflammatory and pro-fibrotic processes were associated with less improvement on functional capacity with exercise. Because functional capacity is a strong prognostic factor, these results are particularly relevant after studies have shown limited impact of exercise on functional capacity and mortality in the context of modern therapy for heart failure.14 Further studies should evaluate whether tailored therapy with exercise in particular subgroups, or combined with drugs that modulate inflammation, can reduce clinical events and improve survival in patients with heart failure.
Author contribution
MMF, GVG, EAB and FB contributed to the conception and design of the work. GVG, VOCR, MLA, REC and LGBC contributed to the acquisition and interpretation of the data for the work. MMF contributed to formal statistical analysis. MMF and GVG drafted the manuscript. VOCR, MLA, REC, LGBC, EAB and FB critically revised the manuscript. All gave final approval and agree to be accountable for all aspects of work ensuring integrity and accuracy.
Acknowledgment
Trial registration: www.clinicaltrials.gov #NCT02448147.
Declaration of conflicting interests
The author(s) declared no potential conflicts of interest with respect to the research, authorship, and/or publication of this article.
Funding
The author(s) disclosed receipt of the following financial support for the research, authorship, and/or publication of this article: This work was supported by the Fundação de Amparo à Pesquisa do Estado de São Paulo (FAPESP), São Paulo, Brazil (grants #2011/00640-4, 2010/08990-1). MMF received grants from Conselho Nacional de Desenvolvimento Científico e Tecnológico – Brazil (CNPq) (# 141272/2012-0) and GVG received grants from CNPq (301957/2014-2). Neither of these funding sources had any involvement in the conduction of this research or preparation of this article.

Comments