


Abstract
Type D personality refers to a combination of simultaneously high levels of negative affectivity and social inhibition. The present study aimed to examine whether type D personality was independently associated with recurrent myocardial infarction or all-cause mortality in post-acute myocardial infarction patients, using any of the previously proposed methods for measuring type D personality.
This was a prospective cohort study.
Utilising data from the Västmanland Myocardial Infarction Study, 946 post-acute myocardial infarction patients having data on the DS14 instrument used to measure type D personality were followed-up for recurrent myocardial infarction and all-cause mortality until 9 December 2015. Data were analysed using Cox regression, adjusted for established risk factors.
In total, 133 (14.1%) patients suffered from type D personality. During a mean follow-up time for recurrent myocardial infarction of 5.7 (3.2) years, 166 (17.5%) patients were affected by recurrent myocardial infarction, of which 26 (15.7%) had type D personality, while during a mean follow-up time for all-cause mortality of 6.3 (2.9) years, 321 (33.9%) patients died, of which 42 (13.1%) had type D personality. After adjusting for established risk factors, type D personality was not significantly associated with recurrent myocardial infarction or all-cause mortality using any of the previously proposed methods for measuring type D personality. A weak association was found between the social inhibition part of type D personality and a decreased risk of all-cause mortality, but this association was not significant after taking missing data into account in a multiple imputation analysis.
No support was found for type D personality being independently associated with recurrent myocardial infarction or all-cause mortality in post-acute myocardial infarction patients, using any of the previously proposed methods for measuring type D personality.
Introduction
Cardiovascular diseases (CVDs) are the primary cause of death worldwide.1 Several clinical, biological, and psychosocial characteristics have been presented as risk factors for coronary heart disease (CHD) and all-cause mortality (ACM), independent of a wide range of potential confounders.2
Type D personality (TDP: D stands for ‘distressed') has been identified as a risk factor for negative health outcomes in CHD patients, including impaired health status, emotional distress, higher macrophage superoxide anion production, and cardiovascular morbidity and mortality.3,4 TDP refers to simultaneously high levels of negative affectivity (NA), the tendency to experience negative emotions, and social inhibition (SI), the tendency to inhibit self-expression in social interactions.3 Suggestions have been made for routine screening of TDP for identifying patients at risk of CHD.5 Associations between TDP and mortality have been presented for several cardiovascular patient groups,6–10 but other studies have shown no effect of TDP.10–12 Moreover, there is ambiguity regarding the appropriate method to measure TDP, using dichotomised NA ≥ 10 and SI ≥ 10,3 NA and SI as indices,13–15 the interaction term NA × SI,14 or their z-scores zNA × zSI.14,16 Table 1 gives an overview of previous research.
Studies assessing the prognostic value of the type D personality regarding cardiac events and mortality.
| Study | Methods | Type D assessment | Prevalence of type D personality | Effect size (CI) | |||
|---|---|---|---|---|---|---|---|
| Design (SD) | Sample n, mean age (SD) (% male) | Measure | Settings | Outcomes | |||
| Denollet et al., 19966 | Prospective 6–10-year study | 303 CAD patients, 55.4 (7.9) (88%) | DS14 dic | Rehabilitation programme | ACM | 28% | OR 4.1 (1.9–8.8) |
| Denollet et al., 200017 | Prospective 5-year study | 319 CAD patients, 56.7 (92%) | DS16 dic | Rehabilitation programme | Cardiac events | 31% | OR 4.7 (2.2–7.8) |
| Pedersen et al., 200418 | Prospective 9-months study | 875 PCI patients, 62.2 (10.9) (72%) | DS14 dic | 6 Months after PCI | Cardiac events | 29% | OR 5.38 (2.06–13.66) |
| Denollet et al., 200619 | Prospective 5-year study | 337 CHD patients, 57.0 (88%) | DS16 | Rehabilitation programme | Cardiac events | OR 4.84 (1.42–16.52) | |
| Denollet et al., 200620 | Prospective 9- months study | 875 CHD patients, 62.2 (75%) | DS14 dic | Rehabilitation programme | MACE | HR 1.92 (1.22–3.01) | |
| Denollet et al., 200821 | Prospective 5-year study | 337 CHD patients, 57.0 (88%) | DS16 | Rehabilitation programme | MACE | 29% | OR 2.44 (1.25–4.76) |
| Denollet et al., 20078 | Prospective 5.4-years | 51 Heart transplant patients, 54.1 (9.7) (75%) | DS14 dic | Before transplantation | ACM | 29% | OR 6.75 (1.47–30.97) |
| Aquarius et al., 200922 | Prospective 4-year study | 184 Patients with peripheral arterial disease, 64.8 (9.8) (63.6%) | DS14 dic | Before diagnosis | ACM | 35% | OR 3.5 (1.11–11.1) |
| Martens et al., 201023 | Prospective 1.8 (0.8) years | 473 MI patients, 59 (12) (78%) | DS14 dic | Hospitalisation for MI | Cardiac events | 20% | OR 2.23 (1.14–4.35) |
| Schiffer et al., 201024 | Prospective 30.7 (11.1) months | 232 CHF patients, 65.5 (9.9) (75%) | DS14 dic | Consecutive CHF outpatients | Cardiac mortality | 20.7% | OR 1.40 (0.93–4.29) |
| Pelle et al., 201010 | Prospective 37.6 (15.6) months | 641 CHF patients, 66.6 (10) (74%) | DS14 dic | 2 Weeks after outpatient visit | ACM | 20% | OR 1.16 (0.72–1.87) |
| Volz et al., 201112 | Prospective 2.8 (1.1) years | 111 CHF rehab patients, 57 (14) (88%) | DS14 dic | During rehabilitation programme | ACM | 30% | OR 1.40 (0.38–5.14) |
| Grande et al., 201125 | Prospective 71.5 (3.6) months | 977 CAD patients, 63.3 (10.7) (77.5%) | NA, SI, NA × SI | Different settings | ACM | 25% | HR NA × SI 0.99 (0.61–1.59), NA 1.01 (0.97–1.05), SI 1.03 (0.97–1.10) |
| Coyne et al., 201114 | Prospective 18 months | 706 CHF patients, 70.7 (11.5) (61.8%) | DS14 dic, zNA, zSI, zNA × zSI | During hospitalisation | ACM | 13.5% | HR 0.89 (0.58–1.37), zNA 0.87 (0.72–1.05), zSI 0.97 (0.83–1.02) zNA × zSI 0.9 (0.79–1.04) |
| Denollet et al., 20139 | Prospective 5-year study | 541 Patients with CAD, 58.7 (10.5) (87%) | DS14 dic, zNA, zSI, zNA × zSI | Outpatient rehabilitation programme | MACE | OR 1.74 (1.11–2.73) zNA 0.99 (0.78–1.26), zSI 1.16 (0.92–1.47), zNA × zSI 1.36 (1.11–1.67) | |
| Damen et al., 201326 | Prospective 7-year (1.6) follow-up | Consecutive PCI patients, 62.0 (11.1) (72%) | DS14 dic | 6 Months post-PCI | ACM | 29.2% | HR 1.19 (0.76–1.85) |
| Denollet et al., 201327 | Prospective 3.2 years | 455 Patients with ICD, 59.1 (8.9) | DS14 dic | Prior to implantation | ACM | 23% | HR 0 1.91 (1.09–3.34) |
| Meyer et al., 201428 | Prospective 5-year follow-up | 465 Consecutive patients with CAD, 62.0 (11.1) (72%) | NA, SI and NA × SI | Before undergoing stent implantation | MACE | 31% | HR NA 1.02 (0.91–1.13), SI 0.86 (0.75–1.00), NA × SI 1.00 (0.99–1.01) |
| Dulfer et al., 201529 | Prospective 10-years follow-up | 1190 Consecutive patients who underwent PCI, 62 (73%) | DS14 dic, zNA × zSI | 6 Months post-PCI | ACM | 25% | HR 1.58 (1.22–2.03), zNA × zSI 1.24 (0.94–1.63) |
| Condén et al., 2016 (present study) | Prospective 6.2 years (2.9) follow-up | 946 Consecutive patients with acute MI, 70 (11.7) | DS14 dic, zNA, zSI, zNA × zSI | During hospitalisation | Recurrent MI and ACM | 14% | RMI: HR: 1.16 (0.76–1.77), zNA 1.03 (0.88–1.21), zSI 1.06 (0.90–1.24), zNA × zSI 1.03 (0.90–1.18) ACM: HR: 0.94 (0.68–1.31), zNA 1.03 (0.92–1.15), zSI 1.14 (1.02–1.27), zNA × zSI 1.00 (0.90–1.11) |
ACM: all-cause mortality; CAD: coronary artery disease; CHF: chronic heart failure; CI: confidence interval; dic: dichotomous; HR: hazard ratio; ICD: implantable cardioverter defibrillator; MACE: major adverse cardiac event; MI: myocardial infarction; NA: negative affectivity; OR: odds ratio; PCI: percutaneous coronary intervention; QoL: quality of life; RMI: recurrent MI; SI: social inhibition.
Aim
The aim of this study was to examine whether TDP is independently associated with recurrent myocardial infarction (RMI) or ACM in post-acute myocardial infarction (MI) patients, using any of the previously proposed methods for measuring TDP.
Methods
The present study used data from the Västmanland Myocardial Infarction Study (VaMIS; ClinicalTrials.gov: NCT-01452178). The Uppsala Regional Ethical Review Board approved the study (DNR: 2005:169).
Patients and procedures
The VaMIS study included patients aged ≥18 years old with acute myocardial infarction (AMI) admitted to the Central Hospital, Västerås, Sweden, from November 2005–May 2011. AMI was diagnosed using ECG and biomarker criteria from the European Society of Cardiology: a rise in serum concentration of troponin-I to ≥0.4 µg/l and a subsequent fall, in combination with: (a) ischaemic symptoms; (b) development of Q waves on the ECG; (c) ECG changes indicative of ischaemia (ST segment elevation or depression); or (d) coronary artery intervention.30 Exclusion criteria included: not residing in the hospital’s catchment area, previous enrolment in VaMIS, inability to provide informed consent, language difficulties, and other severe disease, e.g. advanced cancer or cardiogenic shock. The intention was to include 1000 patients. In the end, 1008 patients were included, with 946 (93.8%) fulfilling the criteria for the present study of having no missing data on the DS14 instrument used to measure TDP (Figure 1).
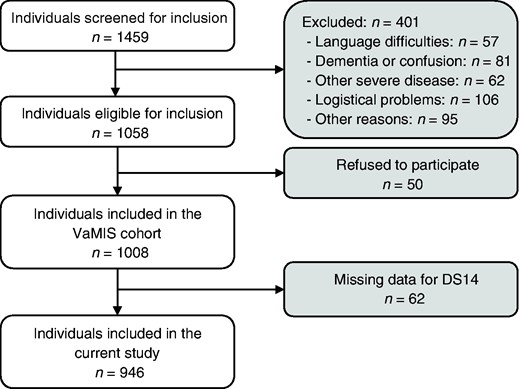
Flowchart of study population. VaMIS: Västmanland Myocardial Infarction Study.
After giving written informed consent, the participants answered questions regarding the DS14 instrument and sociodemographic, lifestyle, and clinical risk factors. Clinical and anthropometric variables were measured and blood samples were collected by venepuncture in the morning four days after entering the hospital, if possible in a fasting state.
Primary outcome
The primary outcome was the occurrence of RMI or ACM, respectively, during follow-up until 9 December 2015, extracted from the Swedish national heart disease register (SWEDEHEART), and the Swedish population register, respectively. Time-to-event was calculated as the time from date of inclusion in the study until date of occurrence of the event of interest (either RMI or death) or censoring (date of emigration from Sweden or 9 December 2015).
Risk factors
TDP
TDP, the risk factor of main interest, was assessed using the DS14 instrument. It consists of two seven-item subscales, NA and SI, with responses given on a five-point Likert scale ranging from zero (‘false’) to four (‘true’), resulting in a total score of 0–28 for each subscale. TDP is defined as simultaneously scoring NA ≥ 10 and SI ≥ 10. It has, however, been suggested that TDP should instead be measured using NA and SI as indices,13–15 their interaction term (NA × SI),14 or their normalised z-scores zNA and zSI,14,16 all of which will be evaluated in the present study. A Swedish version of the DS14 instrument was used that has been validated in a Swedish cardiac patient sample,31 giving internal consistencies of α = 0.80 and α = 0.78 for the NA and SI items, respectively.
Secondary risk factors
Besides TDP, the present study included risk factors sex, age, smoking, diabetes, hypertension treatment, systolic blood pressure (SBP), total cholesterol, and high-density lipoprotein (HDL). Additionally, the sociodemographic variables of immigrant (yes/no), living alone (yes/no), and highest education level (elementary school or no formal education/secondary school/college or university) were included as risk factors, together with physical activity during leisure time (low/mild/moderate or strenuous) and body mass index (BMI). Finally, the clinical variables prior MI (yes/no), percutaneous coronary intervention (PCI) during index hospitalisation (yes/no), heart rate (bpm), creatinine (µmol/l), C-reactive protein (CRP) (mg/l), N-terminal pro b-type natriuretic peptide (NT-proBNP) (ng/l), and use of β-blockers (yes/no) or diuretics (yes/no) at discharge, were included.
Statistical analyses
Descriptive statistics are presented as frequencies and percentages, n (%), for categorical data, while means and standard deviations (SDs) are used for ordinal and continuous data. Differences between two groups are analysed using Pearson’s χ2-test for categorical data and the Mann-Whitney test for ordinal and continuous data.
Cox regression was used to examine the association between risk factors and outcomes. The DS14 instrument was included in the regression models in various forms: (a) as a single variable obtained by dichotomising the DS14 instrument, i.e. NA ≥ 10 and SI ≥ 10 (yes/no), NA ≥ 10 (yes/no), or SI ≥ 10 (yes/no), the index variables NA (score 0–28), SI (score 0–28), zNA, or zSI, or the index interactions NA × SI or zNA × zSI; (b) as multiple variables including both subscales NA and SI in dichotomised or index form, with or without interaction. The regression analyses were performed in four steps: In the first three steps, complete cases analyses were used for constructing basic models, estimated separately for the various forms of DS14 as well as the secondary risk factors; reduced models, where the DS14 were adjusted for the secondary risk factors with p-values<0.20 in the basic models; and full models, where the DS14 were adjusted for all secondary risk factors. In the final step, a fully conditional specification imputation method was used to construct a multiple imputation data set, for which a full model was applied. The fully conditional specification used 10 imputations, with zNA × zSI, and all secondary risk factors included in the imputation model. The regression analyses are reported as hazard ratios (HRs) with 95% confidence intervals (CIs), with pooled estimates used for the multiple imputation data set. Statistical analyses were performed in IBM SPSS Statistics 23/24, with two-sided p-values<0.05 considered statistically significant.
Results
Descriptive data are given in Table 2, while Tables 3 and 4 give results for the basic and multiple regression models, respectively. Most of the 946 included patients were men (n = 632; 66.8%). The mean (SD) age was 70.4 (11.7; range 38.3–97.1) years, with 133 (14.1%) having TDP (NA ≥ 10 and SI ≥ 10. Compared to those excluded, the included patients were less often undergoing hypertension treatment, had a higher education level, were more physical active during leisure time, and had less often suffered from a prior MI (data not shown).
Descriptive data for the study population.
| Type of variable | Variable | Value | Valid, n (%) |
|---|---|---|---|
| Outcome | Recurrent MI, n (%) | 166 (17.5) | 946 (100.0) |
| All-cause mortality, n (%) | 321 (33.9) | 946 (100.0) | |
| DS-14 | NA (score 0–28), mean (SD) | 6.6 (5.5) | 946 (100.0) |
| SI (score 0–28), mean (SD) | 7.9 (5.8) | 946 (100.0) | |
| Type D personality (NA ≥ 10 and SI ≥ 10), n (%) | 133 (14.1) | 946 (100.0) | |
| CVD risk factors | Male sex, n (%) | 632 (66.8) | 946 (100.0) |
| Age (years), mean (SD) | 70.4 (11.9) | 946 (100.0) | |
| Smoker, n (%) | 184 (19.5) | 945 (99.9) | |
| Diabetes, n (%) | 170 (18.0) | 946 (100.0) | |
| Hypertension treatment, n (%) | 471 (49.8) | 946 (100.0) | |
| SBP (mm Hg), mean (SD) | 126.6 (20.9) | 930 (98.3) | |
| Total cholesterol (mg/dl), mean (SD)a | 188.7 (50.5) | 845 (89.3) | |
| HDL cholesterol (mg/dl), mean (SD)a | 43.4 (14.2) | 845 (89.3) | |
| Sociodemographic factors | Immigrant, n (%) | 175 (18.5) | 946 (100.0) |
| Living alone, n (%) | 325 (34.4) | 946 (100.0) | |
| Highest education level, n (%) | 941 (99.5) | ||
| Elementary school or no formal education | 479 (50.9) | ||
| Secondary school | 314 (33.4) | ||
| College or university | 148 (15.7) | ||
| Lifestyle factors | Physical activity during leisure time, n (%) | 930 (98.3) | |
| Low | 399 (42.9) | ||
| Mild | 291 (31.3) | ||
| Moderate or strenuous | 240 (25.8) | ||
| Body mass index (kg/m2), mean (SD) | 27.0 (4.8) | 937 (99.0) | |
| Clinical factors | Prior MI, n (%) | 222 (23.5) | 946 (100.0) |
| PCI during index hospitalisation, n (%) | 476 (50.3) | 946 (100.0) | |
| Heart rate (bpm), mean (SD) | 68.1 (11.9) | 904 (95.6) | |
| Creatinine (µmol/l), mean (SD) | 96.5 (55.6) | 942 (99.6) | |
| CRP (mg/l), mean (SD) | 17.4 (38.4) | 910 (96.2) | |
| NT-proBNP (ng/l), mean (SD) | 4.5 (8.5) | 942 (99.6) | |
| β-blockers, n (%) | 860 (93.0) | 925 (97.8) | |
| Diuretics, n (%) | 205 (22.1) | 926 (97.9) |
CRP: C-reactive protein; CVD: cardiovascular disease; HDL: high density lipoprotein; MI: myocardial infarction; NA: negative affectivity; NT-proBNP: N-terminal pro b-type natriuretic peptide; PCI: percutaneous coronary intervention; SBP: systolic blood pressure; SD: standard deviation; SI: social inhibition.
Converted from mmol/l using the conversion factor 38.6598.
Basic Cox regression models for the outcomes recurrent myocardial infarction (MI) and all-cause mortality, respectively. Significant results are given in bold.
| Recurrent MI | All-cause mortality | ||
|---|---|---|---|
| Type of variable | Variable | HR (95% CI) | HR (95% CI) |
| DS-14 as single variables | Type D personality (NA ≥ 10 and SI ≥ 10)a | 1.16 (0.76–1.77) | 0.94 (0.68–1.31) |
| NA ≥ 10 | 1.24 (0.89–1.72)b | 0.98 (0.76–1.26) | |
| SI ≥ 10 | 1.11 (0.80–1.52) | 1.12 (0.89–1.41) | |
| NA (score 0–28) | 1.01 (0.97–1.04) | 1.00 (0.98–1.03) | |
| SI (score 0–28) | 1.01 (0.98–1.04) | 1.02 (1.00–1.05)b | |
| NA × SI | 1.00 (0.99–1.01) | 1.00 (0.99–1.01)b | |
| zNA | 1.03 (0.88–1.21) | 1.03 (0.92–1.15) | |
| zSI | 1.06 (0.90–1.24) | 1.14 (1.02–1.27)b | |
| zNA × zSI | 1.03 (0.90–1.18) | 1.00 (0.90–1.11) | |
| DS-14 as multiple variables | Dichotomised | ||
| NA ≥ 10 | 1.23 (0.88–1.71) | 0.96 (0.74–1.23) | |
| SI ≥ 10 | 1.07 (0.77–1.47) | 1.13 (0.89–1.42) | |
| Dichotomised + interaction | |||
| NA ≥ 10 | 1.32 (0.85–2.04) | 1.08 (0.77–1.50) | |
| SI ≥ 10 | 1.13 (0.76–1.69) | 1.22 (0.93–1.61)b | |
| (NA ≥ 10) × (SI ≥ 10)a | 0.85 (0.43–1.65) | 0.76 (0.46–1.26) | |
| Index | |||
| NA (score 0–28) | 1.00 (0.97–1.04) | 1.00 (0.97–1.02) | |
| SI (score 0–28) | 1.01 (0.98–1.04) | 1.02 (1.00–1.05)b | |
| Index + interaction | |||
| NA (score 0–28) | 1.00 (0.95–1.05) | 1.00 (0.96–1.05) | |
| SI (score 0–28) | 1.01 (0.96–1.06) | 1.03 (0.99–1.07)b | |
| NA × SI | 1.00 (0.99–1.01) | 1.00 (0.99–1.01) | |
| Normalised index | |||
| zNA | 1.02 (0.86–1.20) | 0.98 (0.87–1.10) | |
| zSI | 1.05 (0.89–1.24) | 1.15 (1.02–1.29)b | |
| Normalised index + interaction | |||
| zNA | 1.01 (0.85–1.20) | 0.98 (0.87–1.11) | |
| zSI | 1.05 (0.88–1.25) | 1.15 (1.02–1.30)b | |
| zNA × zSI | 1.01 (0.88–1.17) | 0.98 (0.88–1.09) | |
| CVD risk factors | Male sex | 0.90 (0.65–1.25) | 0.68 (0.54–0.86)b |
| Age (years) | 1.03 (1.01–1.05)b | 1.10 (1.09–1.12)b | |
| Smoker | 0.73 (0.48–1.10)b | 0.44 (0.30–0.63)b | |
| Diabetes | 2.62 (1.88–3.65)b | 1.98 (1.54–2.54)b | |
| Hypertension treatment | 1.64 (1.20–2.24)b | 1.45 (1.16–1.81)b | |
| SBP (mm Hg) | 1.01 (1.00–1.02)b | 1.00 (0.99–1.01) | |
| Total cholesterol (mg/dl)c | 0.99 (0.98–1.00)b | 0.99 (0.98–1.00)b | |
| HDL cholesterol (mg/dl)c | 0.99 (0.98–1.01) | 1.00 (0.99–1.02) | |
| Sociodemographic factors | Immigrant | 0.92 (0.61–1.37) | 0.87 (0.65–1.17) |
| Living alone | 1.28 (0.93–1.76)b | 2.34 (1.87–2.92)b | |
| Highest education level | |||
| Elementary school or no formal education | 1.19 (0.76–1.86) | 2.03 (1.41–2.93)b | |
| Secondary school | 0.97 (0.60–1.57) | 1.16 (0.77–1.73) | |
| College or university | Ref. | Ref. | |
| Lifestyle factors | Physical activity during leisure time | ||
| Low | 2.07 (1.37–3.13)b | 4.88 (3.39–7.02)b | |
| Mild | 1.30 (0.83–2.05) | 2.07 (1.38–3.11)b | |
| Moderate or strenuous | Ref. | Ref. | |
| Body mass index (kg/m2) | 1.00 (0.96–1.03) | 0.93 (0.90–0.96)b | |
| Clinical factors | Prior MI | 3.32 (2.43–4.52)b | 2.41 (1.91–3.03)b |
| PCI during index hospitalisation | 0.78 (0.57–1.06)b | 0.41 (0.32–0.52)b | |
| Heart rate (bpm) | 1.02 (1.00–1.04)b | 1.03 (1.01–1.04)b | |
| Creatinine (µmol/l) | 1.00 (1.00–1.01)b | 1.00 (1.00–1.01)b | |
| CRP (mg/l) | 1.00 (0.99–1.01) | 1.01 (1.00–1.01)b | |
| NT–proBNP (µg/l) | 1.02 (1.01–1.04)b | 1.04 (1.03–1.05)b | |
| β-blockers | 1.11 (0.59–2.04) | 1.19 (0.74–1.90) | |
| Diuretics | 2.30 (1.65–3.21)b | 4.30 (3.43–5.40)b |
CI: confidence interval; CRP: C-reactive protein; CVD: cardiovascular disease; HDL: high density lipoprotein; HR: hazard ratio; NA: negative affectivity; NT-proBNP: N-terminal pro b-type natriuretic peptide; PCI: percutaneous coronary intervention; SBP: systolic blood pressure; SI: social inhibition.
NA ≥ 10 and SI ≥ 10 is equivalent to (NA ≥ 10) × (SI ≥ 10).
p-Value < 0.20.
Converted from mmol/l using the conversion factor 38.6598.
Multiple Cox regression models for outcomes recurrent myocardial infarction (MI) and all-cause mortality, using complete cases and multiple imputed data analyses. Significant results are given in bold.
| Complete cases analysis | Multiple imputed data analysis | ||||||
|---|---|---|---|---|---|---|---|
| Reduced modela | Reduced modelb | Full modelc,d | Full modelc,d | Full modelc,e | Full modelc,e | ||
| Recurrent MI | All-cause mortality | Recurrent MI | All-cause mortality | Recurrent MI | All-cause mortality | ||
| HR (95% CI) | HR (95% CI) | HR (95% CI) | HR (95% CI) | HR (95% CI) | HR (95% CI) | ||
| DS-14 as single variables | Type D personality (NA ≥ 10 and SI ≥ 10)f | 1.17 (0.74–1.85) | 1.02 (0.69–1.49) | 1.27 (0.79–2.03) | 0.99 (0.67–1.46) | 1.07 (0.69–1.65) | 0.97 (0.69–1.37) |
| NA ≥ 10 | 1.31 (0.91–1.89) | 1.18 (0.88–1.59) | 1.41 (0.97–2.04) | 1.15 (0.85–1.56) | 1.20 (0.86–1.69) | 1.12 (0.86–1.44) | |
| SI ≥ 10 | 1.12 (0.79–1.59) | 0.82 (0.62–1.09) | 1.08 (0.74–1.57) | 0.81 (0.61–1.07) | 1.01 (0.72–1.41) | 0.86 (0.67–1.10) | |
| NA (score 0–28) | 1.00 (0.97–1.04) | 1.01 (0.98–1.04) | 1.01 (0.97–1.04) | 1.01 (0.98–1.04) | 1.00 (0.97–1.03) | 1.01 (0.98–1.04) | |
| SI (score 0–28) | 1.01 (0.97–1.04) | 0.99 (0.96–1.01) | 1.01 (0.97–1.04) | 0.98 (0.95–1.01) | 1.00 (0.97–1.03) | 0.99 (0.97–1.02) | |
| NA × SI | 1.00 (0.99–1.01) | 1.00 (0.99–1.01) | 1.00 (0.99–1.01) | 1.00 (0.99–1.01) | 1.00 (0.99–1.01) | 1.00 (0.99–1.01) | |
| zNA | 1.01 (0.85–1.20) | 1.07 (0.94–1.23) | 1.03 (0.86–1.23) | 1.06 (0.92–1.22) | 0.99 (0.84–1.16) | 1.05 (0.93–1.19) | |
| zSI | 1.04 (0.87–1.23) | 0.92 (0.80–1.05) | 1.04 (0.86–1.25) | 0.90 (0.78–1.03) | 0.99 (0.84–1.17) | 0.96 (0.86–1.08) | |
| zNA × zSI | 1.02 (0.88–1.18) | 1.01 (0.91–1.12) | 1.04 (0.90–1.21) | 1.00 (0.90–1.12) | 1.01 (0.88–1.16) | 0.98 (0.89–1.08) | |
| DS-14 as multiple variables | Dichotomised | ||||||
| NA ≥ 10 | 1.29 (0.89–1.87) | 1.24 (0.92–1.68) | 1.40 (0.96–2.05) | 1.22 (0.90–1.66) | 1.21 (0.86–1.71) | 1.15 (0.88–1.48) | |
| SI ≥ 10 | 1.07 (0.75–1.53) | 0.79 (0.60–1.05) | 1.01 (0.69–1.49) | 0.78 (0.58–1.04) | 0.97 (0.69–1.37) | 0.84 (0.66–1.08) | |
| Dichotomised + interaction | |||||||
| NA ≥ 10 | 1.46 (0.89–2.37) | 1.26 (0.84–1.89) | 1.48 (0.90–2.45) | 1.23 (0.81–1.85) | 1.31 (0.83–2.04) | 1.18 (0.84–1.66) | |
| SI ≥ 10 | 1.18 (0.75–1.83) | 0.80 (0.57–1.11) | 1.06 (0.66–1.70) | 0.78 (0.55–1.09) | 1.04 (0.68–1.57) | 0.86 (0.64–1.15) | |
| (NA ≥ 10) × (SI ≥ 10)f | 0.77 (0.37–1.59) | 0.98 (0.54–1.77) | 0.88 (0.41–1.87) | 0.99 (0.53–1.82) | 0.84 (0.42–1.66) | 0.93 (0.55–1.57) | |
| Index | |||||||
| NA (score 0–28) | 1.00 (0.96–1.04) | 1.02 (0.99–1.06) | 1.00 (0.96–1.04) | 1.02 (0.99–1.05) | 1.00 (0.96–1.03) | 1.01 (0.99–1.04) | |
| SI (score 0–28) | 1.01 (0.97–1.04) | 0.98 (0.95–1.01) | 1.01 (0.97–1.04) | 0.97 (0.95–0.99) | 1.00 (0.96–1.03) | 0.99 (0.96–1.02) | |
| Index + interaction | |||||||
| NA (score 0–28) | 1.00 (0.94–1.06) | 1.02 (0.97–1.07) | 0.99 (0.93–1.06) | 1.02 (0.97–1.07) | 0.99 (0.94–1.05) | 1.02 (0.98–1.07) | |
| SI (score 0–28) | 1.00 (0.95–1.06) | 0.98 (0.93–1.02) | 1.00 (0.94–1.05) | 0.97 (0.93–1.02) | 1.00 (0.95–1.05) | 1.00 (0.96–1.03) | |
| NA × SI | 1.00 (0.99–1.01) | 1.00 (0.99–1.01) | 1.00 (0.99–1.01) | 1.00 (0.99–1.01) | 1.00 (0.99–1.01) | 1.00 (0.99–1.01) | |
| Normalised index | |||||||
| zNA | 1.00 (0.83–1.20) | 1.14 (0.98–1.32) | 1.02 (0.84–1.24) | 1.13 (0.97–1.31) | 0.99 (0.83–1.18) | 1.08 (0.94–1.23) | |
| zSI | 1.04 (0.86–1.25) | 0.87 (0.75–1.01) | 1.03 (0.84–1.26) | 0.86 (0.74–1.00) | 0.99 (0.83–1.18) | 0.94 (0.83–1.06) | |
| Normalised index + interaction | |||||||
| zNA | 0.99 (0.82–1.20) | 1.14 (0.97–1.33) | 1.01 (0.83–1.23) | 1.13 (0.96–1.32) | 0.99 (0.83–1.18) | 1.08 (0.95–1.24) | |
| zSI | 1.03 (0.85–1.25) | 0.87 (0.75–1.01) | 1.02 (0.83–1.25) | 0.86 (0.74–1.00) | 0.99 (0.83–1.18) | 0.95 (0.83–1.08) | |
| zNA × zSI | 1.01 (0.87–1.18) | 1.01 (0.90–1.13) | 1.04 (0.88–1.22) | 1.01 (0.89–1.13) | 1.01 (0.88–1.17) | 0.97 (0.87–1.08) | |
BMI: body mass index; CI: confidence interval; CRP: C-reactive protein; HDL: high density lipoprotein; HR: hazard ratio; NA: negative affectivity; NT-proBNP: N-terminal pro b-type natriuretic peptide; PCI: percutaneous coronary intervention; Ref: reference; SBP: systolic blood pressure; SI: social inhibition.
Adjusted for age, smoker, diabetes, hypertension treatment, SBP, total cholesterol, living alone, physical activity during leisure time, prior MI, PCI during index hospitalisation, heart rate, creatinine, NT-proBNP, and diuretics. Results based on 759 (80.2%) individuals with 139 (18.3%) events.
Adjusted for sex, age, smoker, diabetes, hypertension treatment, total cholesterol, living alone, highest education level, physical activity during leisure time, BMI, prior MI, PCI during index hospitalisation, heart rate, creatinine, CRP, NT-proBNP, and diuretics. Results based on 727 (76.8%) individuals with 250 events (34.4%).
Adjusted for sex, age, smoker, diabetes, hypertension treatment, SBP, total cholesterol, HDL cholesterol, immigrant, living alone, highest education level, physical activity during leisure time, BMI, prior MI, PCI during index hospitalisation, heart rate, creatinine, CRP, NT-proBNP, β-blockers, and diuretics.
Results based on 722 (76.3%) individuals with complete cases for all included variables, with 132 (18.3%) events for recurrent MI and 246 (34.1%) events for all-cause mortality.
Results based on all 946 individuals, with 166 (17.5%) events for recurrent MI and 321 (33.9%) events for all-cause mortality, using pooled estimates from 10 imputations.
NA ≥ 10 and SI ≥ 10 is equivalent to (NA ≥ 10) × (SI ≥ 10).
RMI
During a mean (SD) follow-up time of 5.7 (3.2) years (5364 person-years), 166 (17.5%) patients suffered RMI, with 26 (15.7%) having TDP (NA ≥ 10 and SI ≥ 10). No DS14 variable was significantly associated with RMI. However, in the basic model (Table 3), age, diabetes, hypertension treatment, SBP, total cholesterol, physical activity during leisure time, prior MI, heart rate, creatinine, NT-proBNP, and diuretics were all significantly associated with risk of RMI.
ACM
During a mean (SD) follow-up time of 6.3 (2.9) years (5933 person-years), 321 deaths (33.9%) occurred, with 42 (13.1%) of the deceased having TDP (NA ≥ 10 and SI ≥ 10). In the basic regression model (Table 3), only SI and zSI were significantly associated with ACM, with HRs (95% CI) of 1.02 (1.00–1.05) and 1.14 (1.02–1.27), respectively, implying 2% and 14% higher risks of early death for each increase in index score in the case of including these as single variables. Adjusting for NA and zNA, respectively, resulted in HRs (95% CI) of 1.02 (1.00–1.05) and 1.15 (1.02–1.29) for SI and zSI, implying 2% and 15% higher risks of early death for each increase in index score, although in these cases neither NA nor zNA were significantly associated with ACM. Likewise, zSI was still significantly associated with ACM after adjusting for zNA and zNA × zSI, HR (95% CI) 1.15 (1.02–1.30), but since zNA × zSI was far from statistically significant, it was not included in the model. All secondary risk factors except SBP, HDL cholesterol, immigrant, and β-blockers were significantly associated with risk of early death.
In the multiple regression models (Table 4), no DS14 variable was significantly associated with ACM when included as single variables, but both SI and zSI were significantly associated with ACM in the full model, after adjusting for NA and zNA, respectively. Notably, with HRs (95% CI) of 0.97 (0.95–0.99) and 0.86 (0.74–1.00), respectively, each increase in index score for SI and zSI implied 3% and 14% lower risks of early death. Again, neither NA nor zNA had any significant association with ACM in these cases, and zSI was still significantly associated with ACM after adjusting for zNA and zNA × zSI, HR (95% CI) 0.86 (0.74–1.00), with zNA × zSI not being statistically significant. However, when using the reduced or multiple imputed full models, no DS14 variable was significantly associated with ACM when including DS14 as multiple variables (Table 4).
Discussion
The present study found no support for TDP being independently associated with RMI or ACM in post-acute MI patients, using any of the previously proposed methods for measuring TDP. A association was found between the SI part of TDP and a decreased risk of ACM when adjusting for all risk factors, but this association was not significant in a multiple imputation analysis.
Whereas some studies have suggested an association between TDP and major adverse cardiac events, the findings are inconsistent,6,9,10,14,32 giving ambiguous evidence regarding whether TDP is related to RMI or mortality in CHD patients. Consequently, it was important to assess whether TDP could be useful after adjusting for established risk factors.
The results of the present study is consistent with previous studies finding no evidence for TDP implying an increased risk of RMI/adverse cardiac events or early death.23,25 According to recent findings, TDP is associated with an increased risk of cardiac events, but not with non-cardiac death, nor with events in patients aged ≥70 years.33 Although several researchers have investigated the clinical importance of TDP, the arbitrary cut-off values have been criticised.14 Thus, for example, Dulfer et al.29 found that zNA × zSI was not associated with 10-year ACM in PCI patients, whereas dichotomous TDP (NA ≥ 10 and SI ≥ 10) was.
Previous studies finding an association between TDP and mortality were often based on small samples with few events.6,8,17,34 The present study was based on 166 RMI and 321 ACM events, suggesting that the null findings of this study were probably plausible.
It is possible that the effects of TDP, due to specific aetiological mechanisms on the cardiovascular system, are more related to cardiac mortality than ACM. However, considering that the population in the present study suffered from CHD, and the strong association observed between the cardiovascular risk factors and ACM, if this effect existed, it should have had an impact on ACM in the present study. However, despite the findings in the present study, patients with clinically significant symptoms of distress following MI should be referred to psychological counselling or psychologically focused interventions.35
Strengths and limitations
Strengths of the present study included the relatively large population used, the long-term follow-up, and the incorporation of all previously proposed methods for measuring TDP. Another limitation was the relatively high level of troponin I ≥ 0.4 µg/l used as a diagnostic marker. Some of the patients had suffered from a prior MI at inclusion, and an association between TDP and first ever incident AMI may thus not be ruled out. Moreover, ACM may not be comparable with cardiac mortality. Studies have shown associations between TDP and cardiac mortality, but not between TDP and ACM. A final limitation was the high mean age (>70 years) in the present study, since the importance of TDP may be more pronounced in younger patients.
Conclusions
No support was found for TDP being independently associated with RMI or ACM in post-acute MI patients, using any of the previously proposed methods for measuring TDP.
Author contribution
JL designed the VaMIs study, EC and AR were involved in the design of the study, the analysis and interpretation of the data, and drafting the manuscript. PW was involved in the analysis. JL, LE and CÅ made substantial contributions to the design and revised the manuscript critically. All authors gave their approval to publish the manuscript.
Acknowledgements
The authors thank Marja-Leena Ojutkangas, Annika Kärnsund and Mattias Rehn for data collection and management.
Declaration of conflicting interests
The author(s) declared no potential conflicts of interest with respect to the research, authorship, and/or publication of this article.
Funding
The author(s) disclosed receipt of the following financial support for the research, authorship, and/or publication of this article: The study was supported by grants from SparbanksstiftelsenNya, the Swedish Council for Working Life and Social Research, and the Västmanland County Council. Funding was not associated with any conditions regarding the design, execution, or interpretation of the study, nor regarding the decision to publish the manuscript.

Comments