


Abstract
Patients with high-grade (≥70%) carotid artery stenosis (CAS) rank in the highest risk category for future cardiovascular (CV) events, but the quality of cardiovascular risk management in this patient group is unknown.
Cross-sectional retrospective study.
Data were collected for all patients diagnosed with high-grade CAS in Östergötland county, Sweden between 1 January 2009 and 31 July 2012 regarding the quality of cardiovascular risk management, co-morbidity and outcomes during the 2-year follow-up period after a diagnosis of CAS with a carotid ultrasound scan. Patients were included regardless of whether they underwent carotid endarterectomy (CEA).
A total of 393 patients with CAS were included in the study; 133 (33.8%) underwent CEA and 260 (66.2%) were assigned to a conservative management (CM) group. In both groups of patients the prescription of platelet inhibitors, statins and antihypertensive drugs increased significantly (p < 0.001) after diagnosis. However treatment targets were not met in the majority of patients and the low-density lipoprotein level was on target in only 13.5% of patients. During follow-up, low-density lipoprotein levels were not measured in 19.8% of patients who underwent CEA and 44.2% of patients in the CM group (p < 0.001); HbA1c was not measured in 24.4% of patients with diabetes in the CEA group and in 18.8% of patients in the CM group (p = 0.560). There was no documentation of counselling on diet, exercise, smoking cessation or adherence to medication. The combined clinical event rate (all-cause mortality, cardiovascular mortality and non-fatal cardiovascular events) was high in both groups (CEA 36.8% and CM 36.9%; p = 1.00) with no difference in the occurrence of ipsilateral ischaemic stroke.
The clinical event rate was high in patients with high-grade CAS and the management of cardiovascular risk was deficient in all aspects.
Introduction
According to current European guidelines on cardiovascular disease (CVD) prevention, patients with high-grade (≥70%) carotid artery stenosis (CAS) rank in the very high risk category for future cardiovascular (CV) events.1 Prevention in patients with high-grade CAS is focused on a single outcome – the reduction of (recurrent) ischaemic stroke – with an emphasis on carotid endarterectomy (CEA) surgery or stenting, treatment with antiplatelet drugs, lipid management and the treatment of hypertension.2 However, within the current guidelines, the concept is well established that cardiovascular risk management (CVRM) in very high risk patients should take a multi-facetted approach and combine the pharmacological management of risk factors with lifestyle modification.1,3 The quality of CVRM in patients with high-grade CAS is unknown and there is no information regarding their total burden of CVD. We aimed to assess the quality of CVRM in patients with high-grade CAS under routine clinical care against the background of total CV risk and clinically manifest CVD at baseline, together with clinical events during a 2-year follow-up period. We studied all patients with high-grade CAS because all are in need of CVRM regardless of whether or not they undergo CEA.
Methods
The study was performed at the University Hospital of Linköping in Östergötland county, Sweden, which has a population of 445,029 people. Since 2009 this county has seen the universal implementation of a single type of electronic patient record (Cambio Cosmic, Cambio Healthcare Systems, Linköping, Sweden). Thus all medical information on every patient is available at every point of care throughout the county. This includes all consultations and admissions to hospital throughout the healthcare system, all diagnostic procedures, all therapeutic interventions and every drug that has been prescribed during the patient’s medical history. Taking advantage of this comprehensive medical documentation, we performed an observational, retrospective study of all patients diagnosed with high-grade CAS between 1 January 2009 and 31 July 2012. The study was approved by Linköping’s Institutional Review Board (record number 2013/463-31).
Patients
All patients with high-grade CAS were considered for inclusion in the study regardless of whether they had undergone CEA. The decision to perform CEA was taken by the vascular surgeon and was based on the severity of the CAS and the overall clinical condition of the patient. Patients were excluded if they had non-atherosclerotic carotid artery disease and/or were not available for follow-up because they resided outside Östergötland.
All duplex ultrasound investigations performed between 1 January 2009 and 31 July 2012 were screened for patients with high-grade CAS. The severity of stenosis was assessed by measuring the peak systolic velocity (PSV) according to criteria established in the European Carotid Surgery Trial.4 Using these criteria, a PSV ≥2.4 m/s measured at an insonation angle ≤60° corresponds to ≥70% stenosis and a PSV of 0.0 m/s indicates occlusion. The follow-up time was 2 years for all patients starting on the day that high-grade CAS was diagnosed.
Study aims and measurements
The primary aim of the study was to assess the number of patients who fulfilled the treatment goals for secondary prevention at baseline, i.e. before the diagnosis of high-grade CAS and during the first year after this diagnosis. The quality of CVRM was assessed in terms of prescribed medication, blood pressure, lipid and HbA1c levels, as well as documentation of counselling regarding smoking cessation, diet and exercise. Treatment goals were set according to the European guidelines published during the study period with blood pressure ≤140/90 mmHg, total cholesterol ≤5.0 mmol/L, low-density lipoprotein (LDL) cholesterol ≤1.8 mmol/L and HbA1c <53 mmol/mol in patients with diabetes.1
The secondary aim of the study was to place the quality of CVRM within the context of overall CV risk and clinically manifest CVD at baseline as well as clinical events during follow-up. To generate a CV risk profile, we assessed for family history, lipid values, smoking, the overconsumption of alcohol, overweight, hypertension, diabetes mellitus, atrial fibrillation and renal failure. A BMI ≥25 was considered to indicate overweight and alcohol overconsumption was defined as consumption >20 g/day ethanol for men and >10 g/day ethanol for women.1 Renal failure was defined5 as stage ≥4, i.e. a glomerular filtration rate <30 mL/min/1.73 m2. To assess the total CVD burden, we recorded clinically manifest ischaemic heart disease (IHD) and lower extremity peripheral artery disease (PAD) at baseline. For 2 years after the diagnosis of high-grade CAS, we recorded all-cause mortality, CV mortality and all non-fatal CV events.
Clinical characteristics, including contraindications to CEA, laboratory values, events and prescribed drugs were recorded for each patient on dedicated case record forms. Definitions and classification of clinical events were established prior to the study (Supplementary Table 1, available online). Treatment targets for CVD prevention were assessed ≤1 year before and ≤1 year after the diagnosis of high-grade CAS.
Statistical analysis
A database was created using SPSS Statistics 22 (International Business Machines Corporation, New York, NY, USA). Continuous variables were summarized as mean ± standard deviation (SD) for values with a normal distribution and as median or interquartile range (IQR) if the values were not normally distributed.
Differences between patients with and without CEA were tested with χ2 (categorical variables), an unpaired t test (continuous normally distributed variables) or the Mann–Whitney U test (continuous skewed variables). A paired sample t test was used to compare laboratory values and blood pressure levels before and after diagnosis of CAS.
All variables in the database (Supplementary Table 2, available online) representing co-morbidities and risk factors were tested for correlation (Spearman bivariate correlation) with the combined endpoint of CV death and non-fatal CV events. A Cox proportional hazards analysis was then performed with 95% confidence intervals (CIs) for all variables with a significant correlation, and for age and sex. Age and sex were treated as categorical variables (age >75 years or ≤75 years). If a patient had multiple events, the first was used in the analysis. Patients who died from non-CV causes as the first event were excluded from the analysis to avoid competing endpoints.
Results
Baseline characteristics
Between 1 January 2009 and 31 July 2012, 7172 duplex ultrasound investigations were performed. These yielded 410 patients with high-grade CAS; 10 patients were excluded because of non-atherosclerotic carotid artery disease and seven patients resided outside Östergötland. Thus 393 patients were included in the study.
Table 1 summarizes the baseline characteristics and shows an elderly population in which the majority of patients were men. For men, the mean ± SD age was 73.7 ± 9.1 years and for women it was 74.0 ± 9.7 years (p < 0.01). In the majority of patients, an ultrasound scan was performed because of a cerebrovascular ischaemic event (CVI), although a minority was referred for an ultrasound scan because of a carotid bruit. Overall, the incidence of concomitant IHD was high, with a significantly higher rate of IHD in those patients assigned to conservative management (CM). Regarding CEA, surgery was performed at a median of 4 (IQR 11) days after the ultrasound scan. The contraindications for CEA surgery in the CM group are summarized in Supplementary Figure 1 (available online). The most prevalent conditions were near-occlusion or occlusion of the artery (33.2%) and asymptomatic stenosis (50.0%).
Baseline characteristics.
| Patient characteristic | CEA group (n = 133) | CM group (n = 260) | p |
|---|---|---|---|
| Sex | |||
| Male | 87 (65.4) | 169 (65.0) | 1.000 |
| Age (years) | 72.0 ± 9.5 | 74.7 ± 9.1 | <0.01 |
| Location of plaque | |||
| Right | 58 (43.6) | 124 (47.7) | 0.640 |
| Left | 53 (39.8) | 108 (41.5) | 0.835 |
| Bilateral | 22 (16.5) | 28 (10.8) | 0.156 |
| Symptomatic stenosis | 114 (85.7) | 73 (28.1) | <0.001 |
| Severity of stenosis | |||
| 70–89% stenosis | 124 (80.0) | 140 (48.6) | <0.001 |
| 90–99% stenosis | 18 (11.6) | 27 (9.3) | 0.410 |
| Occlusion | 12 (7.7) | 117 (40.6) | <0.001 |
| Data not available | 1 (0.7) | 4 (1.5) | 0.515 |
| CT scan of the brain | |||
| At time of diagnosis | 114 (85.7) | 214 (82.3) | 0.797 |
| With signs of chronic ischaemia | 30 (26.3) | 69 (32.2) | 0.411 |
| With signs of previous silent infarction | 35 (30.7) | 67 (31.3) | 1.000 |
| Reason for carotid ultrasound | |||
| CVI | 92 (69.2) | 156 (60.0) | 0.400 |
| Suspicion of CVI | 16 (12.0) | 24 (9.2) | 0.435 |
| Non-specific/non-focal neurological symptoms | 6 (4.5) | 21 (8.1) | 0.215 |
| Carotid bruit | 5 (3.8) | 17 (6.5) | 0.282 |
| Other reason | 14 (10.5) | 42 (16.2) | 0.187 |
| Co-morbidities | |||
| Previous CVI | 121 (91.0) | 209 (80.4) | 0.428 |
| Ischaemic heart disease | 41 (30.8) | 135 (51.9) | <0.05 |
| Peripheral vascular disease | 20 (15.0) | 52 (20.0) | 0.314 |
| Diabetes mellitus | 41 (30.8) | 85 (32.7) | 0.787 |
| Renal failure | 5 (3.8) | 19 (7.3) | 0.189 |
| Atrial fibrillation | 23 (17.3) | 63 (24.2) | 0.203 |
CEA: carotid endarterectomy; CM: conservative management; CT: computed tomography; CVI: cerebrovascular ischaemic event.
Data are presented as n (%) or mean ± SD values. Baseline characteristics of the patients at time of diagnosis of high-grade carotid stenosis divided in two groups: those who underwent carotid endarterectomy versus those who received conservative management. Data for CT scans with chronic ischaemia and previous silent infarction are expressed as percentage of all patients who underwent a CT scan at the time of diagnosis, not as a percentage of the population as a whole.
Quality of cardiovascular risk management
The risk factors at the time of CAS diagnosis and the extent to which the relevant data for risk assessment and treatment planning were not obtained are shown in Supplementary Table 3 (available online). There was no documentation of smoking habits for 12.7% of patients. The presence or absence of alcohol overconsumption was not recorded for 55.7% of patients, the presence or absence of a BMI ≥25 was not documented for 36.4% of patients and information on family history was absent.
Table 2 summarizes the changes in prescriptions of drugs, lipid levels, blood pressure and HbA1c levels before and after the diagnosis of high-grade CAS as well as the number of patients in whom lipids, blood pressure and HbA1c were not measured either before diagnosis, after diagnosis, or both. There were modest, but significant reductions in cholesterol, blood pressure and HbA1c levels after diagnosis of CAS. However, there was a substantial number of patients in whom these risk factors were not measured, both before and after diagnosis.
Lipid levels, blood pressure, glycaemic control and medication before and after diagnosis of high-grade carotid artery stenosis.
| Drugs and measurements | No. (%) patients not measured | ||||||
|---|---|---|---|---|---|---|---|
| Before | After | No. (%) patients B–A | p | Before | After | p | |
| Mean ± SD cholesterol (mmol/L) | |||||||
| TC | 5.07 ± 1.38 | 4.35 ± 1.03 | 157 (39.9) | <0.001 | 104 (26.5) | 187 (47.6) | <0.001 |
| HDL | 1.25 ± 0.35 | 1.25 ± 0.35 | 130 (33.1) | 0.935 | 136 (34.6) | 211 (53.7) | <0.001 |
| LDL | 3.07 ± 1.19 | 2.27 ± 0.85 | 122 (31.0) | <0.001 | 136 (34.6) | 218 (55.5) | <0.001 |
| Mean ± SD blood pressure (mm Hg) | |||||||
| Systolic | 148 ± 20.4 | 140 ± 18.1 | 308 (78.4) | <0.001 | 66 (16.8) | 22 (5.6) | <0.001 |
| Diastolic | 77 ± 9.73 | 75 ± 8.9 | 306 (77.9) | <0.001 | 67 (17.0) | 23 (5.9) | <0.001 |
| Median ± IQR glycaemic control (mmol/mol) | |||||||
| HbA1c | 54.0 ± 17.0 | 52.0 ± 15.0 | 87 (69.0) | <0.001 | 29 (23.2) | 26 (20.8) | <0.001 |
| No. (%) prescriptions | |||||||
| Any platelet inhibitor | 229 (58.3) | 329 (83.7) | n.a. | <0.001 | |||
| Any anticoagulant drug | 43 (10.9) | 67 (17.0) | n.a. | <0.001 | |||
| Any antihypertensive drug | 294 (74.8) | 342 (87.0) | n.a. | <0.001 | |||
| Any lipid-lowering drug | 219 (55.7) | 337 (85.8) | n.a. | <0.001 | |||
B–A: number of patients who had at least one measurement before and after diagnosis; TC: total cholesterol; HDL: high-density lipoprotein; LDL: low-density lipoprotein; IQR: interquartile range; n.a.: not applicable.
Risk factor levels and prescriptions in those with at least one measurement ≤1 year before the diagnosis of high-grade carotid artery stenosis and one measurement ≤1 year after diagnosis. Also shown is the number of patients in whom these measurements were not performed during these time frames. HbA1c-levels were measured only for patients with diabetes mellitus. A diagnosis of diabetes was present in 126 (32.1%) patients. Before–after measurements were not applicable to prescriptions because of the nominal nature of these data; patients either had a prescription or not.
Comparison of the CEA and CM groups showed that during the first year of follow-up LDL was not measured in 19.8% of CEA and 44.2% of CM patients (p < 0.001); HbA1c was not measured in 24.4% of patients with diabetes in the CEA group versus 18.8% in the CM group (p = 0.560). The CM group had significantly lower blood pressure (systolic pressure CM 139 ± 19 mmHg vs. CEA 144 ± 15 mmHg, p < 0.05 and diastolic pressure CM 74 ± 9 mmHg vs. CEA 77 ± 9 mmHg, p < 0.05). There was no significant difference between the groups regarding lipid levels and HbA1c values after diagnosis. In both groups the prescription of platelet inhibitors, anticoagulants, antihypertensives and lipid-lowering drugs increased significantly after diagnosis. There was no documentation of adherence to medication or lifestyle counselling.
Figure 1 summarizes the extent to which lipid and blood pressure treatment targets were met as well as the change in the prescription of lipid-lowering, antiplatelet and anticoagulant drugs. Patients for whom lipid or blood pressure values were not measured were classed as ‘not reaching target’. Despite a significant increase in prescriptions for statins, there was only a non-significant 2.8% increase in patients in whom the LDL level was on target after the diagnosis of CAS (from 10.7 to 13.5%).
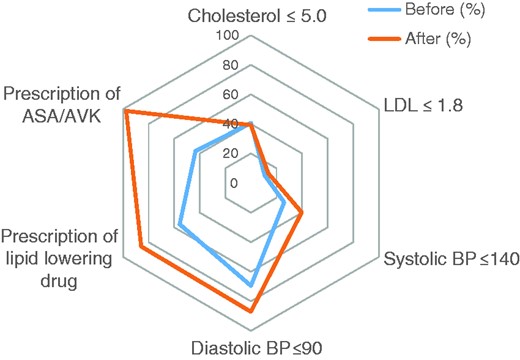
Prescription of drugs and treatment targets before and after diagnosis of high-grade carotid artery stenosis. Percentages of patients who reached target goals ≤1 year before and ≥1 year after diagnosis of high-grade carotid artery stenosis. Patients without registered values were considered as not having met treatment targets. Pre/post differences were significant for prescription of ASA/AVK (p < 0.001) and lipid-lowering drugs (p < 0.001), systolic blood pressure on target (p < 0.005) and diastolic blood pressure on target (p < 0.05), but not for the number of patients on target for LDL (p = 0.286) and cholesterol (p = 0.775).
ASA: acetyl salicylic acid; AVK: anti-vitamin K drug; LDL: low-density lipoprotein; BP: blood pressure.
Mortality and non-fatal cardiovascular events during follow-up
All-cause and CV mortality as well as non-fatal CV events are summarized in Figure 2. The overall event rate within 2 years was high in both groups (CEA 36.8% vs. CM 36.9%; p = 1.00).
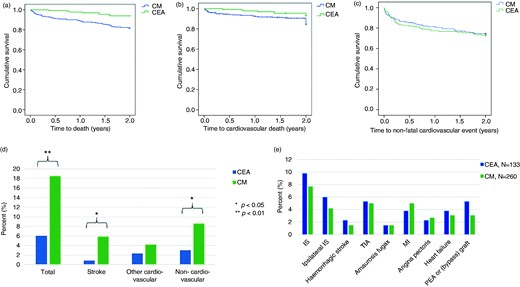
Clinical outcomes in patients with high-grade carotid artery stenosis. (a–c) Kaplan–Meier function of event-free survival and (d, e) distribution of events between those who underwent carotid endarterectomy and those who were managed conservatively. (b, c) Patients with non-cardiovascular events were censored to avoid competing risks, showing data for the remaining 376 patients. (a) Survival free from all-cause death. (b) Survival free from cardiovascular death. (c) Survival free from non-fatal cardiovascular events. (d) Distribution of all-cause mortality, mortality from stroke, cardiovascular mortality not due to stroke and non-cardiovascular mortality. (e) Non-fatal cardiovascular events, 2-year follow-up (p > 0.05 for all comparisons)
CEA: carotid endarterectomy; CM: conservative management; IS: ischaemic stroke; TIA: transient ischemic attack; MI: myocardial infarction; PEA: peripheral endarterectomy.
All-cause mortality, mortality from stroke and non-CV mortality were significantly higher in the CM group, but there was no difference in CV mortality not due to stroke (Figure 2a–d). Cancer and infections were the major non-cardiovascular causes of death (Supplementary Table 4, available online). There was no difference between the groups regarding non-fatal CV events, including recurrent ipsilateral stroke (Figure 2e).
Of those patients who experienced any CV event, the majority (68.3%) had one event, 23.4% had two events, 4.8% had three events and 3.4% had four events. In the CEA group, eight patients (6% of CEA group) had a complication directly related to CEA, most often infection in the operation wound or neurological damage; these patients were not included in the outcome analysis.
The results of the Cox regression analysis are shown in Table 3. In the multivariate analysis, a symptomatic CAS and the presence of heart failure significantly increased the risk for the combined endpoint of CV death and non-fatal CV events.
Univariate and multivariate Cox regression analysis for the combined endpoint of cardiovascular death and non-fatal cardiovascular events.
| Variable | Univariate analysis relative risk (95% CI) | p | Multivariate analysis relative risk (95% CI) | p |
|---|---|---|---|---|
| Age >75 years | 1.129 (0.795–1.604) | 0.498 | 1.023 (0.704–1.488) | 0.905 |
| Male sex | 0.76 (0.678–1.407) | 0.898 | 0.931 (0.643–1.350) | 0.707 |
| Carotid endarterectomy | 1.127 (0.784–1.621) | 0.519 | 0.945 (0.606–1.473) | 0.803 |
| Diabetes mellitus | 1.1416 (0.986–2.034) | 0.060 | 1.163 (0.798–1.696) | 0.433 |
| Ischemic heart disease | 1.743 (1.225–2.480) | <0.01 | 1.434 (0.940–2.189) | 0.094 |
| Peripheral vascular disease | 1.602 (1.072–2.395) | <0.05 | 1.484 (0.967–2.277) | 0.071 |
| Kidney failure | 1.729 (0.931–3.211) | 0.083 | 0.825 (0.419–1.626) | 0.579 |
| Heart failure | 2.596 (1.749–3.854) | <0.001 | 1.806 (1.052–3.100) | <0.05 |
| Atrial fibrillation | 1.999 (1.375–2.904) | <0.001 | 1.371 (0.873–2.153) | 0.171 |
| Symptomatic stenosis | 1.574 (1.105–2.240) | <0.05 | 1.868 (1.213–2.876) | <0.01 |
CI: Confidence interval.
All variables in our database were analysed for correlation with outcome. The patients who died from non-cardiovascular causes were excluded from the regression analysis to avoid competing endpoints. This Cox regression analysis included all variables with a significant p value, and age and sex, which were treated as categorical parameters (age >75 or ≤75 years).
Discussion
To the best of our knowledge, this is the first analysis of the quality of CVRM in patients with high-grade CAS. Despite the extremely high CVD burden and the high clinical event rate during follow-up, every aspect of CVRM was deficient. Furthermore, the discrepancy between prescriptions of statins and the absence of significant improvements in target cholesterol levels suggests issues with dosing/titration of medication and/or problems with patient adherence to pharmacotherapy.
The current data fit a pattern of suboptimal CVRM in patients with non-coronary CVD. For cerebral ischaemia and PAD, CVRM is suboptimal across countries and regions6–9 and it is implemented less frequently than for coronary artery disease.10,11 There is no previous study of CVRM in CAS, but in view of the systematic under-treatment of patients with other forms of non-coronary CVD, it is likely that our findings are not unique.
The published literature on secondary prevention in CAS places a strong emphasis on elaborating the indications for CEA and its efficacy in preventing stroke.2 Recommendations emphasize the need for ‘optimal medical therapy’ as an adjunct to any carotid revascularization, which should include antiplatelet treatment, statins and lifestyle modifications.2 However, in the current study, ‘optimal medical therapy’ was not realized. Moreover, it is not known to what extent CVRM in patients with high-grade CAS can reduce CV events in other vascular beds.
Regarding the prevention of stroke, statins have shown efficacy in patients with CAS. The SPARCL trial showed a 33% reduction in stroke risk for those with CAS and no heterogeneity in treatment effect between those with and without CAS.12 However, we show that, in routine care, lipid treatment targets are met in only a minority of patients. This finding is also true for other high-risk patients. A previous report on patients with a PROCAM score >20%, CVD or diabetes showed that only 37% met lipid targets.13
The impact of lifestyle adaptations in patients with CAS is unknown. However, the published literature on PAD and cerebral ischaemia may apply to some extent to CAS. Smoking cessation has been shown to increase survival two-fold in patients with PAD.14 However, the effect may be heterogeneous by vascular bed and therefore difficult to extrapolate to CAS.14 For alcohol, there is a J-shaped association between intake and CVD risk including ischaemic stroke. Moderate intake (1 drink/day for women, 2 drinks/day for men) is protective, but heavier use increases risk.1,2 Thus heavy drinking should be discouraged in patients with CAS and light to moderate drinking may be reasonable. A Mediterranean diet is associated with reduced CV and all-cause mortality.1 Regarding the secondary prevention of stroke, however, there is no data on the effectiveness of specific diets.2 Thus the extent to which a Mediterranean diet offers protection in CAS, especially regarding stroke, remains to be established. Regular physical activity reduces CV mortality and may reduce stroke risk.1,2 Therefore disability from stroke should not deter patients with CAS from establishing a suitable exercise regimen.
The best manner in which to optimize CVRM for patients with high-grade CAS is not known. However, structured CVRM programmes such as those offered to patients after myocardial infarction have been shown to be particularly important and cost-effective.1 The sustained contact offered in these programmes is effective in facilitating the optimization of drug doses and in promoting adherence to drug regimens.1 This may be especially beneficial for the patients documented here because of the discrepancy between statin prescriptions and the attainment of cholesterol targets.
The current study showed no difference in the recurrence of ipsilateral CVI between the CEA and CM groups. However, the groups may not have been comparable regarding stroke risk. In the CM group, 72% of patients had an asymptomatic CAS, which is associated with a lower stroke risk than symptomatic stenosis.15 On the other hand, patients in the CM group had significantly more IHD, which increases stroke risk three-fold.16 CEA has a role in secondary prevention after a CVI, but without effective CVRM the beneficial effect is likely to be only be partially realized.
We acknowledge the limitations of the current study. The retrospective nature of the analysis constrained the assessment of a number of variables. Family history and adherence to medication were not recorded, we found gaps in the documentation of risk factors related to lifestyle and there was no record showing that lifestyle changes had been implemented. This does not necessarily mean that lifestyle and adherence were not addressed, but data on these parameters might have been collected more successfully in a prospective study. The medical record was complete on all other aspects of care. We argue, therefore, that the current data represent a clinically relevant assessment of the quality of CVRM in patients with high-grade CAS.
Conclusion
Cardiovascular risk management in patients with high-grade CAS is deficient in all aspects. This is illustrated by a wide gap in the prescription of preventive medication and the attainment of treatment targets. Improved CVRM in this group is mandated by the extremely high CVD risk, as reflected both by the high CVD burden at baseline and a high incidence of clinical manifestations of polyvascular disease at baseline and during follow-up. In view of the deficient CVRM in this group, the clinical benefits of CEA might improve once it is accompanied by optimal CVRM.
Declaration of conflicting interests
The author(s) declared no potential conflicts of interest with respect to the research, authorship, and/or publication of this article.
Funding
The author(s) disclosed receipt of the following financial support for the research, authorship, and/or publication of this article. This work was supported by Linköping University Hospital (grant number LIO-417951).

Comments