


Abstract
Exaggerated dispersion of repolarization is likely to play a role in both the initiation and the maintenance of malignant ventricular arrhythmias. It was proposed that the inter-lead QT interval differences within a 12-lead ECG termed ‘QT dispersion’ might reflect regional differences in myocardial refractoriness, and that this might predict cardiac dysrhythmias.
The study aimed to perform a meta-analysis of the relevant available publications.
A MEDLINE search from 1990 to 2012 at PubMed (NLM) was performed. An all-fields search for index terms ‘QT dispersion’ and ‘anxiety’ was done. Case-control studies and surveys were included in the analysis provided they encompassed physically healthy subjects who had been evaluated for anxiety disorders with validated inventories. Outcome measures were either crude or heart rate-corrected QT dispersions.
Five studies were included in the analysis, which encompassed 580 patients with calculated mean age of 36.8 years (standard error = 5.5). The values of crude and heart rate-corrected QT dispersions across the studies were statistically significantly higher in the patients with anxiety disorders. Crude values of QT dispersion were available in 164 patients with anxiety and in 273 controls. Summarized standardized difference in the means (random effect model) was equal to 1.472 (95% confidence interval: 1.034–1.911). Heart rate-corrected QT dispersion values were available in 193 patients with anxiety and in 282 controls, and the summarized standardized difference in the means was equal to 3.299 (95% confidence interval: 1.215–5.384).
High anxiety is associated with increased QT dispersion, which may predispose to cardiac arrhythmias.
Introduction
Exaggerated dispersion of repolarization is likely to play a role in both the initiation and the maintenance of malignant ventricular arrhythmias by generating a substrate for functional re-entry.1–3 It was proposed that the inter-lead QT interval differences within a 12-lead ECG might reflect regional differences in myocardial refractoriness, and that this might predict cardiac dysrhythmias. This range of the QT durations was termed ‘QT dispersion’.4 It was proposed that the different ECG leads magnify the ECG signal of different myocardial regions and that, consequently, QT dispersion (QTd) is an almost direct measure of the heterogeneity of myocardial repolarization.5 Animal6,7 and human8,9 studies supported this hypothesis.5
QTd is simply defined as the difference between the longest (QTmax) and the shortest (QTmin) QT intervals within a 12-lead ECG. Since the QT interval on its own may vary according to the heart rate, it may be corrected using Bazett's formula (QT/ ) to give rise to QTc intervals, and the difference between QTcmax and QTcmin is the QTc dispersion (heart rate-corrected QTd).
The average normal value of QTd in normal subjects was ≤40 ms in 13 studies and ≥40 ms in eight studies.10 It is suggested that QTd in normal subjects should be ≤50 ms.11
Abnormal repolarization featuring as increased QTd is known to contribute to the fatal mechanisms associated with numerous cardiovascular pathologies.12–15
Much less is known about possible disturbances of repolarization in patients with psychopathological conditions. Psychological factors, such as stress, exhaustion and negative emotions, can affect the electrical stability of the heart and trigger arrhythmias.16,17 Of particular interest is the potential pro-arrhythmic effect of anxiety disorders. Anxiety may be defined as a diffuse state characterized by an unpleasant affective experience marked by a significant degree of apprehensiveness about the potential occurrence of future adverse or harmful events.18–20 There is evidence for dysregulation of serotonin, dopamine and hypothalamic–pituitary–adrenal axis systems,21 as well as differences in startle and autonomic reactivity22 in the central nervous system of patients with anxiety disorders. Spectral analysis of heart rate variability has confirmed increased indexes of sympathetic modulation, reduced indexes of parasympathetic modulation, or both in subjects with anxiety-spectrum disorders.23–28 Patients with generalized anxiety disorders have increased levels of plasma norepinephrine and its metabolites.29,30 In all anxiety states the symptoms of palpitations, chest pain and shortness of breath reveal the involvement of the autonomic nervous system.31 It is speculated that decreased parasympathetic innervation exposes the heart to unopposed stimulation by sympathetic nerves and may be one link between psychopathology and heart disease.32–35 Sympathetic hyperactivity, specifically an imbalance between left and right stellate ganglion activity, promotes a prolonged and increased dispersion of repolarization, thereby lowering the ventricular fibrillation threshold.36 It is not therefore surprising that anxiety and the reduced positive affect are associated with increased risk of death from coronary artery disease.34,37,38 These arguments lead to the assumption that the anxiety disorders may be associated with specific features of QT interval, specifically increased QTd on the surface ECG.
To address the issue, this study aimed to perform a meta-analysis of the available relevant publications. The primary aim of the meta-analysis was to study whether the physically healthy subjects characterized by high anxiety have increased QTd as compared with the low-anxiety counterparts.
Material and methods
Search strategy for identification of studies
A MEDLINE search from 1990 to 2012 at PubMed (NLM) was performed. An all-fields search for the index term ‘QT dispersion’ was done. EndNote X3 software was used as a search tool. The abstracts of the retrieved publications were further scrutinized for their relevance to the anxiety disorders, and the candidate papers were read in full. Case-control studies, as well as the surveys that included comparisons between the low and high anxiety groups, were included in the analysis, provided they encompassed physically healthy persons. The studies were excluded if the patients had a history or demonstrable evidence of cardiovascular, respiratory, renal, liver or gastrointestinal diseases, were receiving specific medications, or had electrolyte disturbances. As part of the studies’ protocols, the patients should have been evaluated for anxiety disorders with certain validated inventories. Types of ‘outcome measures’ were either crude or heart rate-corrected QTd.
Methods of the review
Data extraction
Decisions on which studies to include and which variables to use when more options were available for the same outcome were based on the methods sections of the studies only. Details of the methods used for evaluation of the signs of anxiety, number of patients who entered the studies, their age and gender, the respective numbers with high and with low anxiety levels, and crude and rate-corrected QTd values were extracted.
Statistics
The effect size was calculated as the Cohen’s d standardized mean differences with 95% confidence intervals (CIs).39 Since heterogeneity of the studies was expected because of various designs, settings and patients covered by the studies, and approaches to the identification of the signs of anxiety, a random effects model was used, as suggested. Two subgroups of outcome measures (either crude or rate-corrected QTd) were defined, and the analysis in the two subgroups was performed.40 Comprehensive meta-analysis (CMA) software version 2.0 was used for computations.41
Results
Description of studies
A MEDLINE search listed 1878 studies published from 1990 to 2012 that matched the search term ‘QT dispersion’. Of these, six studies met the inclusion criteria, that is, compared QTd values in physically healthy subjects with either high or low levels of anxiety. Five studies were published in English and one study in Korean with abstract and tables in English. One study42 was excluded from the analysis to avoid redundancy and publication bias, because a more recent paper from the same research group and covering a larger number of patients was available, and it was this latter publication that was included in the analysis.43 Table 1 is a summary of the papers that were included in the meta-analysis.43–47
Studies included in the meta-analysis
| Source | Patient characteristics | Psychometric tests used |
|---|---|---|
| Piccirillo et al.43 | Apparently healthy adult patients (N = 143: 72 men, 71 women) recruited from people presenting spontaneously to outpatient clinic for preventative reasons; 52 patients aged 77 ± 2 years, 91 patients aged 41 ± 2 years. | The Cornell Anxiety self-rated subscale |
| Nahshoni et al.44 | Physically healthy and non-depressed outpatients with long-term social phobia (N = 16; age 37.9 ± 9.6 years) and 15 physically and mentally healthy age- and gender-matched controls. | The Liebowitz Social Anxiety Scale (LSAS) |
| Uyarel et al.45 | Physically and mentally healthy male volunteers (N = 726; age 21.23 ± 1.25 years). Of these, 83 patients (age 21.18 ± 0.95 years) had a high level of situation anxiety, 193 patients (age 21.09 ± 1.45 years) had low anxiety level. | The Spielberger State-Trait Anxiety Inventory (STAI) |
| Kwon et al.46 | Physically healthy social phobia outpatients (N = 25: 16 men, nine women; average age 35.5 ± 12.9) and age and sex matched control group of mentally and physically healthy volunteers (N = 25: 16 men, 9 women; average age 34.83 ± 12.7). | Mini International Neuropsychiatric Interview (MINI) |
| Atmaca et al.47 | Subjects diagnosed with panic disorder (N = 40: 24 female and 16 male; age 31.17 ± 6.79 years). The control group consisted of 40 healthy individuals (25 female and 15 male; 29.97 ± 4.89 years) matched by sex, age and smoking status. All subjects were normal on physical examination, 12-lead ECG and routine blood tests. The inclusion criteria included not using either vasoactive or psychotropic agents (e.g. antipsychotics, anxiolytics) for at least two weeks. | The Hamilton Depression Rating Scale (HDRS) and the Panic Agoraphobia Scale (PAS) |
Overall, the analysis encompassed 580 patients with diagnosed high and low anxiety levels with calculated mean age of 36.8 years (standard error of 5.5 years). Table 2 summarizes raw data on QTd values extracted from the studies. In all the studies, the values of QTds (either crude or heart rate-corrected) were statistically significantly higher in the patients from anxiety groups.
Raw findings from the studies included in the meta-analysis
| Study name | Subgroup within study | Anxiety mean (ms) | Anxiety standard deviation (ms) | Anxiety sample size | Control mean (ms) | Control standard deviation (ms) | Control sample size | p-value |
|---|---|---|---|---|---|---|---|---|
| Piccirillo et al.43 | QTd rate corrected | 55.0 | 3.0 | 69 | 35.0 | 0.1 | 49 | <0.001 |
| Nahshoni et al.44 | QTd | 70.0 | 21.0 | 16 | 43.0 | 10.0 | 15 | <0.001 |
| Nahshoni et al.44 | QTd rate corrected | 75.0 | 23.0 | 16 | 46.0 | 10.0 | 15 | <0.001 |
| Uyarel et al.45 | QTd | 50.6 | 10.04 | 83 | 33.05 | 9.03 | 193 | <0.001 |
| Uyarel et al.45 | QTd rate corrected | 54.12 | 10.69 | 83 | 34.7 | 9.5 | 193 | <0.001 |
| Kwon et al.46 | QTd | 52.6 | 27.63 | 25 | 27.53 | 14.29 | 25 | <0.001 |
| Kwon et al.46 | QTd rate corrected | 55.79 | 27.98 | 25 | 29.1 | 14.24 | 25 | <0.001 |
| Atmaca et al.47 | QTd | 62.15 | 28.13 | 40 | 36.53 | 13.69 | 40 | <0.001 |
QTd: QT dispersion.
Crude QTd values were available in 164 patients characterized as having a high anxiety level and in 273 controls, and a summary of the meta-analysis of the crude QTd estimates is provided in Figure 1. In all the studies included in the analysis, the values of QTd were statistically significantly higher in the patients characterized as having high anxiety. Aggregated standardized difference in the means was equal to 1.472 (95% CI: 1.034–1.911; SE = 0.224, p < 0.001).
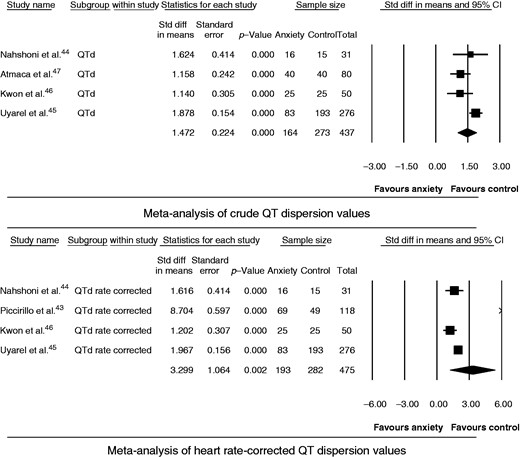
Meta-analysis of QT dispersion (QTd) values.
CI: confidence interval; Std diff: standardized difference.
Rate-corrected QTd values were available in 193 patients with a high anxiety level and in 282 controls (Figure 1). Aggregated standardized difference in the means was equal to 3.299 (95% CI: 1.215–5.384; SE = 1.064, p = 0.002).
Discussion
The study aimed to conduct a meta-analysis of the available publications on possible association between anxiety and QTd in physically healthy subjects. The principal findings were that, across the retrieved relevant publications, the patients characterized as high anxiety had increased QTd. In all these studies, the values of crude and rate-corrected QTds in the high-anxiety groups exceeded 50 ms, which is known as the upper normal limit.11 The estimated values of the aggregate standardized effect sizes (standardized differences between two means) for the crude and rate-corrected QTds may be characterized as large (as has been determined, the large effect sizes correspond to Cohen’s d values ≥0.848). The point-estimate of the aggregate standardized effect size for the rate-corrected QTd was higher than for the crude one. However, the values of the 95% CIs around the point estimates of these two characteristics were largely overlapping, therefore, both characteristics would seem to be informative. This is in accord with the opinion of some authors who have expressed their scepticism about the need to correct QT for the heart rate.49,50
The effect of anxiety on cardiac functions in healthy persons has been discussed over the past two decades.34,51 However, only in limited investigations of anxiety disorders have cardiac functions been investigated. Meanwhile, it is well-established that excessive anxiety itself affects cardiac autonomic balance in physically healthy subjects and increases the risk of coronary heart disease.44 A striking example of this comes from a prospective study with a large sample in which the risk of sudden cardiac death in men was significantly associated with anxiety.52 The use of QTd in psychiatry was first reported in the context of electroconvulsive therapy, in order to depict patient vulnerability to arrhythmic events immediately after treatment.53 It has been found that physically healthy subjects with major depression have significantly higher values of QTd than normal controls.54 These results support the hypothesis of reduced vagal modulation in major depression as a cause of sudden death in affected patients. Autonomic modulation in hypertensive subjects with anxiety was assessed, and both QTd and the indexes of heart-rate variability which point to a cardiac autonomic imbalance were found to be higher in the subjects with higher anxiety scores and correlated significantly with severity of anxiety.55 Studies revealed that elevated anxiety in physically healthy subjects was associated with a cardiac autonomic imbalance and increased risk of coronary heart disease.51,56 The authors also found that increased QTd was positively correlated with increased sympathetic and/or decreased vagal modulations.57 It has been shown that QTd is a significant predictor of cardiovascular mortality.58 Parasympathetic hypoactivity and sympathetic hyperactivity have also been detected in studies of depression and panic disorder,59 and decreased parasympathetic activity has been shown in studies of anorexia nervosa.60 Depression and negative emotions, such as worry, anger, hostility and sadness, are strongly associated with the neurohormonal imbalance related to the pathogenesis of the cardiac arrhythmias, and these conditions are considered both primary and secondary risk factors.16 Stress itself can cause changes such as increased cardiac sympathetic activity and decreased parasympathetic activity, making the myocardium prone to arrhythmias, and may be responsible for some of the autonomic changes seen in these patients,61 including paediatric groups.62 An elevated variability of the QT interval and elevated norepinephrine spill-over were found in patients with panic disorder and depression.63 These findings are corroborated by the results of this present meta-analysis.
Several limitations of the study should be acknowledged. First, the association between the QTd and the true dispersion of repolarization has been disputed. However, despite the difficulties with the concept and despite the fact that a clear publication bias exists towards positive findings, the large number of studies showing some meaningful results with QTd measurements cannot be dismissed lightly.64 Another limitation comes from the fact that measurement of the QT interval and its dispersion is not standardized. The studies are affected by fundamental limitations of the use of QTd measurements. The accuracy of the QT interval and dispersion measurements have been limited by difficulties with reliable identification of T-wave offset.7
This study has its strengths. As any meta-analysis, it was based on systematic reviews of the literature, allowing the conclusive synthesis of accumulating scientific evidence. Combining data from the independent studies enabled the analysis to encompass 580 subjects, which improved statistical precision. Validity was ensured by the high methodological quality of the included studies and strict eligibility criteria.
Conclusion
With all limitations in mind and with understanding that further studies in the field are desirable, the findings from this meta-analysis are indicative that high anxiety is associated with increased QTd, which may predispose to cardiac arrhythmias.
Funding
This research received no specific grant from any funding agency in the public, commercial, or not-for-profit sectors.
Conflict of interest
None declared.

Comments