


Abstract
No data are available on the comparison between an absolute 10-year risk of fatal cardiovascular disease (CVD) and coronary heart disease (CHD) morbidity using the risk assessments of the Systematic Coronary Risk Evaluation (SCORE) project.
Data from the prospective Reykjavik Study of 15 782 patients were used to estimate the 10-year risk of fatal CVD and CHD morbidity in Iceland.
Survival to fatal CVD event was defined as in the SCORE project. Survival to CHD morbidity was defined as having a myocardial infarction, coronary artery bypass graft, or angioplasty. The statistical methodology of SCORE was used.
Relative risk in Iceland was comparable with SCORE results but baseline risk was similar to the low-risk version of SCORE, which contradicted previous suggestions for the countries of northern Europe. Correlation between absolute risk of CHD morbidity and risk for fatal CVD was high (r = 0.96), resulting in similar ranking of individuals by risk and discriminatory capacity. This is the first published comparison between total fatal CVD risk and CHD morbidity in a population-based cohort using the current risk assessment guidelines of the European Societies on Coronary Prevention. Conclusions Risk for fatal CVD in Iceland has the same characteristics as those in a European nation with results varying in accordance with the SCORE project. The risk estimate to be used, CHD morbidity or fatal CVD, is a choice of clinical preference. The data, however, suggest that 5% high-risk threshold of fatal CVD corresponds to a 12% CH D-morbidity risk, which is a significant change from the conventional reference value of 20%. Eur J Cardiovasc Prev Rehabil 14: 761-768 © 2007 The European Society of Cardiology
Introduction
The Systematic Coronary Risk Evaluation (SCORE) project is based on datasets from 12 European cohort studies, which include more than 200 000 men and women followed up for over 10 years [1]. It was initiated to develop a European risk-scoring system that would assess the total burden of risk, as this is now a generally preferred approach to cardiovascular disease (CVD) prevention rather, than an emphasis on single risk factors. [1]. The SCORE charts and modeling approach are likely to set a standard for risk estimation in Europe. Convincing evidence has emerged from many studies that the Framingham risk score might overestimate absolute risk in populations in Europe that have lower coronary heart disease (CHD) rates [2–4]. The regional variations of CVD within Europe are well recognized [5, 6], and hence different countries have been encouraged to develop their own versions of the SCORE charts [7].
The SCORE project [1] and the European guidelines on CVD prevention in clinical practice, which are both based on the SCORE charts [8], diverge from other risk models in that they assess the total CVD risk rather than the CHD risk. In addition, they also use cardiovascular death rather than CHD event as an endpoint. The use of different risk scores has been the cause of some concern regarding the comparability of the results [9].
Data from Iceland were not used in the formulation of the risk charts for fatal CVD in the SCORE project. Comprehensive mortality and risk factor data are available in Iceland. These data allow an evaluation of how well the SCORE risk assessment applies to this particular European population, thus providing an external validation. By using the same methodology as in SCORE, we can then evaluate how well the SCORE risk functions apply to Iceland. Furthermore, extensive morbidity data are available in Iceland [nonfatal myocardial infarction (MI), coronary artery bypass graft (CABG), and percutaneous coronary intervention (PCI)], which allow for risk assessments based on CVD mortality and CHD morbidity, and which are not available in other population-based studies published to date. The aim of this study, therefore, is to use population-based Icelandic data on CVD risk factors, CHD, and fatal CVD events to estimate the risk functions for fatal CVD and for CHD events.
Two components are present in these risk models: baseline population risk and the relative risk associated with the levels of systolic blood pressure (SBP), total cholesterol and smoking status of individuals. Parameters describing baseline risk can be varied to describe regional variations in risk also, but it is assumed that one set of relative risk parameters applies to all of Europe.
First, we give the estimated functions for a 10-year risk of fatal CVD in Iceland and compare them with the results from the SCORE project. Second, we show how mortality risk and morbidity risk in Iceland are associated, and the implication of such an association for the choice of an endpoint for CVD or CHD risk assessment.
Patients and methods
For this investigation, we used data from the Reykjavik Study [10, 11], which was a large-scale epidemiological study of cardiovascular and other chronic diseases that had been conducted in Iceland in stages between 1967 and 1991. All the inhabitants of the greater Reykjavik area born between 1907 and 1935 were invited to participate. More than 19 000 people participated, a participation rate of 71%. The data have been used before for the prediction of mortality from CHD for Icelanders compared with other populations [12].
For the risk estimation, we excluded participants with the following characteristics: a coronary event before their first introduction to the study, total cholesterol less than 3 mmol/l or greater than 10 mmol/l, a SBP of over 200 mmHg, and age of 65 years or more at the study entry. The study group then consisted of 7555 men and 8277 women; complete data on blood pressure, total cholesterol, and smoking habits were available for all of them. Mean age at entry was 51 years (range 36-64 years).
Definition of end-points
Statistics relating to the cause of death, given by an ICD code, were obtained from Statistics Iceland [13]. Two different endpoints for fatal events were defined: fatal CHD and noncoronary atherosclerotic CVD (non-CHD CVD) codes, as used in SCORE. An endpoint for fatal or nonfatal onset of CHD was obtained from hospital records (which were systematically reviewed according to the monitoring of trends and determinants in cardiovascular disease (MONICA) protocol [10, 11]), based on the incidence of MI (fatal and nonfatal), CABG, and angioplasty (PCI). A participant was defined as having had a CHD event if MI, CABG, or PCI had occurred. The end of follow-up period was 1 January 2002. Otherwise follow-up was until death for estimating fatal CVD risk and until incidence of heart disease or death when estimating CHD risk. The quality of the registration of fatal and nonfatal CHD in Iceland according to MONICA methods has been described [14]. All death certificates in Iceland are adjudicated by Statistics Iceland (The Statistical Bureau).
Statistical methods
Survival was estimated using the Weibull model. This model uses the same parameters, risk factors, and age as the time variables (taking left truncation into account), as SCORE does. This approach is called the entry-age-adjusted age-scale model and is the most appropriate one for these kinds of data, assuming proportional hazards [15–17]. The Weibull model can be parameterized as a proportional hazards model and consists of two components: baseline or underlying survival probabilities (S 0), and a function describing the effects of the risk factors on the baseline risk. Separate baseline risk functions were estimated for men and women. The risk factors were the patient-specific levels of total cholesterol (chol), SBP, and smoking. The effects of these risk factors are computed from a linear combination with β-coefficients. In the Weibull model, S 0 can be computed at each age by using the following formula:
given estimates of α and p. Here exp() is the exponential function. As in SCORE, we let
be the total effect of the risk factors given the estimates of βchol, βSBP, βsmoker. Then the survival probability for each patient can be computed by
To derive the 10-year risk from this quantity, see the SCORE paper [1].
It has been clarified that the estimate of baseline risk was similar among the Weibull model, the Cox proportional hazards model and the Kaplan-Meier method. The β-coefficient estimates were almost identical when derived from the Weibull and the Cox models. The proportional hazards assumption about the risk factors was cross-checked using graphical methods based on the Schoenfeld residuals from the Cox model. Overall fit was examined and deemed satisfactory using Cox-Snell residuals [18].
Our comparisons between the fatal risk scores in Iceland and those of SCORE follow from the comparisons of the estimated β-coefficients and the S 0 functions, defined by the α and p parameters estimated from Icelandic data. It is one of the assumptions in SCORE that the β-coefficients can be shared, but that the underlying survival probabilities, S 0, vary by region. One parameter set (βchol, βSBP, βsmoker, α, p) is given for each endpoint.
For a further comparison, a calibrated version of the SCORE chart for Iceland was created using the following method [19]: (a) baseline survival of the study cohort by sex was estimated without any covariates; (b) the baseline risk was calibrated by the means of the risk factors in sex-specific cohorts; (c) the SCORE hazard ratios were used to estimate individual risk from the risk factors.
The comparison between fatal CVD risk and CHD morbidity risk was carried out with regression and correlation of the individual risk estimates. Receiver operating characteristic (ROC) analysis was used to quantify the capacity of the risk scores to discriminate between participants with and without risk of future event.
STATA version 9.1 was used to analyze the data.
Results
First we estimated the risk functions for fatal CVD and compared the Icelandic version of the risk score to the SCORE version. This was performed by comparing relative risk, baseline risk, the 10-year absolute risk, and diagnostic capacity. A comparison with a calibrated SCORE chart was also made.
Then we compared the Icelandic fatal CVD risk with the Icelandic CHD morbidity risk using rank correlation and regression of the two scores on the log scale.
Baseline measures and number of fatal events
Table 1 shows the levels of risk factors and death rates in the cohort. In total, 1549 fatal CHD events and 687 fatal non-CHD CVD events took place during the total follow-up time.
Comparison of risk-factor effects on fatal events
We represent the β-coefficients as hazard ratios [exp(β)] in Table 2. For both fatal CHD and non-CHD CVD, the Icelandic coefficients are consistent with the SCORE coefficients. For CHD the hazard ratios were: 2.11 vs. 2.03, 1.34 vs. 1.27, and 1.23 vs. 1.20 and for non-CHD CVD, 1.90 vs. 1.88, 0.96 vs. 1.02, and 1.20 vs. 1.24 for smoking, cholesterol, and blood pressure, respectively.
Comparison of baseline risk between Iceland and systematic coronary risk evaluation for fatal events
The parameters for the baseline risk curves for Iceland and high and low-risk nations, as defined by SCORE, are shown in Table 3. They were used to draw baseline survival curves from the parametric Weibull model. The comparisons between national estimates of baseline risk (S 0) are best described graphically by plotting the 10-year risk against age. In Figs 1 and 2 we show the comparison of the 10-year baseline risk of fatal CVD between SCORE and Iceland. The baseline risk for men is closer to the low-risk SCORE function than to the high-risk SCORE function, although it diverges towards higher risk SCORE function with higher age. The baseline risk for women is almost identical to the low-risk SCORE function. This can further be seen when examining the distribution of the risk scores in Table 4, which shows the median Icelandic risk score to be closer to the low risk SCORE than to the high risk SCORE. The Spearman's rank correlation between all the scores is greater than 0.99 for both men and women.
Cardiovascular disease risk chart for Iceland
Figure 3 shows the risk chart, in SCORE format, based on the findings from the survival analysis of the Icelandic Reykjavik Study data. The calibrated SCORE chart is almost identical (data not shown). For men and women, the greatest absolute difference in risk has a magnitude 3 percentage points and occurs in the top row of the chart for smokers, for whom risk is much higher than the attention threshold of 5%.
Risk factors and cardiovascular (CVD) and coronary heart disease (CHD) death rates in the Reykjavik Study cohort
| No. | Smoking (%) | Mean cholesterol (mmol/l) | Mean systolic blood pressure | 95th centile of follow-up (years) | Cumulative CVD death rate by the age of 65 yearsa (%) | Cumulative CHD death rate by the age of 65 yearsa (%) | CHD as % of all CVD by the age of 65 years (%) | |
|---|---|---|---|---|---|---|---|---|
| Men | 7555 | 57 | 6.4 | 140 | 33 | 6.41 | 5.63 | 88 |
| Women | 8227 | 41 | 6.5 | 136 | 32 | 1.66 | 1.20 | 72 |
Death rates are calculated as Kaplan-Meier estimates.
Hazard ratio estimates for fatal coronary heart disease (CHD) and fatal non-CHD cardiovascular disease (non-CHD CVD). Iceland and SCORE estimates
| Iceland hazard ratio estimate with 95% CI | SCORE hazard ratio | |||
|---|---|---|---|---|
| Risk factor | CHD | Non-CHD CVD | CHD | Non-CHD CVD |
| Smoker (current) | 2.11 (1.90-2.35) | 1.90 (1.63-2.22) | 2.03 | 1.88 |
| Cholesterol (mmol/l) | 1.34 (1.28-1.40) | 0.96 (0.89-1.03) | 1.27 | 1.02 |
| Systolic blood pressure (10 mmHg) | 1.23 (1.20-1.26) | 1.20 (1.15-1.24) | 1.20 | 1.24 |
CI, confidence interval; SCORE, Systematic Coronary Risk Evaluation.
Baseline risk parameters for fatal coronary heart disease (CHD) and fatal non-CHD cardiovascular (non-CHD CVD) event. Iceland and SCORE estimates
| Fatal CHD | Fatal non-CHD CVD | |||
|---|---|---|---|---|
| α | P | α | P | |
| SCORE low | ||||
| risk | ||||
| Men | −22.1 | 4.71 | −26.7 | 5.64 |
| Women | −29.8 | 6.36 | −31.0 | 6.62 |
| SCORE high | ||||
| risk | ||||
| Men | −21.0 | 4.62 | −25.7 | 5.47 |
| Women | −28.7 | 6.23 | −30.0 | 6.42 |
| Iceland | ||||
| Men | −23.2 | 5.04 | −36.7 | 8.17 |
| Women | −31.8 | 6.86 | −44.3 | 9.92 |
SCORE, Systematic Coronary Risk Evaluation.
Performance of the Icelandic chart and the systematic coronary risk evaluation charts for fatal events
In Table 5, we quantify and compare the capacity of the risk charts to predict events in the Icelandic cohort by means of the ROC analysis and by comparing the sensitivities and specificities at different risk thresholds. The diagnostic capacity of the charts is the same in terms of ROC areas. From the table it can be seen that the low-risk version of SCORE at 4% risk threshold can be applied to Iceland to achieve the same sensitivity and specificity as the Icelandic chart at the risk threshold of 5%. The calibrated SCORE chart has exactly the same diagnostic capacity as the entirely Icelandic version.
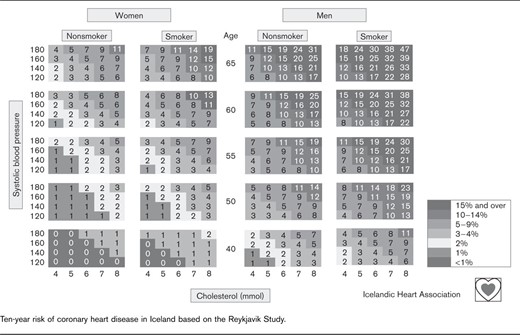
Ten-year risk of coronary heart disease in Iceland based on the Reykjavik Study.
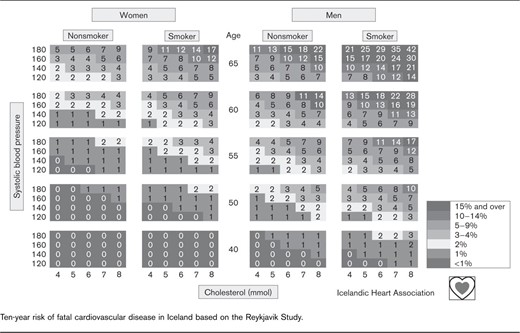
Ten-year risk of fatal cardiovascular disease in Iceland based on the Reykjavik Study.
Distribution of three 10-year fatal cardiovascular (CVD) risk estimates applied to the Icelandic Reykjavik Study cohort
| Risk score | Median | Lower quartile | Upper quartile | |
|---|---|---|---|---|
| Men | Iceland | 2.44 | 1.17 | 4.73 |
| SCORE low risk | 1.97 | 1.01 | 3.55 | |
| SCORE high risk | 3.93 | 2.07 | 6.97 | |
| Women | Iceland | 0.55 | 0.18 | 1.36 |
| SCORE low risk | 0.67 | 0.27 | 1.46 | |
| SCORE high risk | 1.14 | 0.47 | 2.46 | |
SCORE, Systematic Coronary Risk Evaluation.
Coronary heart disease morbidity risk chart for Iceland
In total 3309 CHD events were seen in the cohort before the age of 65 years at the cumulative rate of 18.4% for men and 3.7% for women. Coefficients from the Weibull survival model are shown in Table 6 and Table 7. Figure 4 shows the risk chart for CHD in Iceland based on the coefficients from Table 6 and 7 in the SCORE format. The median CHD risk score is 9.7 (quartiles: 5.28, 12.54) for men and 2.63 (quartiles: 0.96, 3.27) for women (data not shown).

Comparison of 10-year baseline risk of fatal cardiovascular disease in Iceland and SCORE for men. SCORE, Systematic Coronary Risk Evaluation.
Comparison of fatal cardiovascular disease risk and coronary heart disease morbidity risk
Table 8 shows the ROC analysis of the discriminating capacity of the CHD risk chart when applied to the CHD morbidity and fatal CVD endpoints in the Icelandic cohort. It seems that 10% is a reasonable risk threshold for CHD detection with a sensitivity of 56 and specificity of 81. The CHD risk chart can also be used to recognize fatal CVD with a similar level of performance as the CVD chart if the risk threshold is set at 12% with a sensitivity of 54 and a specificity of 86.
Receiver operating characteristic (ROC) analysis of the fatal cardiovascular (CVD) risk charts when applied to the Icelandic Reykjavik Study cohort with sensitivity and specificity at 4, 5, 7 and 10% risk threshold levels
| Risk chart | |||
|---|---|---|---|
| Iceland | SCORE low | SCORE high | |
| ROC area | 0.80 (0.78-0.82) | 0.80 (0.77-0.82) | 0.80 (0.78-0.82) |
| Sensitivity - specificity at 4% threshold | 64-81 | 54-86 | 79-67 |
| Sensitivity - specificity at 5% threshold | 54-86 | 43-91 | 72-75 |
| Sensitivity - specificity at 7% threshold | 40-93 | 25-96 | 56-85 |
| Sensitivity - specificity at 10% threshold | 23-97 | 12-99 | 38-93 |
Baseline risk parameters for coronary heart disease (CHD) event in Iceland
| α | P | |
|---|---|---|
| Men | −15.4 | 3.46 |
| Women | −22.1 | 4.80 |
| α | P | |
|---|---|---|
| Men | −15.4 | 3.46 |
| Women | −22.1 | 4.80 |
Baseline risk parameters for coronary heart disease (CHD) event in Iceland
| α | P | |
|---|---|---|
| Men | −15.4 | 3.46 |
| Women | −22.1 | 4.80 |
| α | P | |
|---|---|---|
| Men | −15.4 | 3.46 |
| Women | −22.1 | 4.80 |
Hazard ratio estimates for coronary heart disease (CHD) event in Iceland
| Risk factor | Hazard ratio | 95% CI |
|---|---|---|
| Smoker (current) | 1.72 | (1.60-1.84) |
| Cholesterol (mmol/l) | 1.32 | (1.28-1.36) |
| Systolic blood pressure (10 mmHg) | 1.12 | (1.10-1.14) |
| Risk factor | Hazard ratio | 95% CI |
|---|---|---|
| Smoker (current) | 1.72 | (1.60-1.84) |
| Cholesterol (mmol/l) | 1.32 | (1.28-1.36) |
| Systolic blood pressure (10 mmHg) | 1.12 | (1.10-1.14) |
CI, confidence interval.
To further evaluate the comparisons between the CHD and CVD charts, regression was applied to the individual CHD and fatal CVD risk scores. On the log-scale, we get the following relationship on the original scale
From this equation it can seen that 5% fatal CVD risk corresponds to 12% CHD risk. The relationship, however, is significantly different for men and women (P < 0.0001, regression test of sex interaction) because the baseline risk changes differently by endpoint for the sexes. The sex-specific relationship is
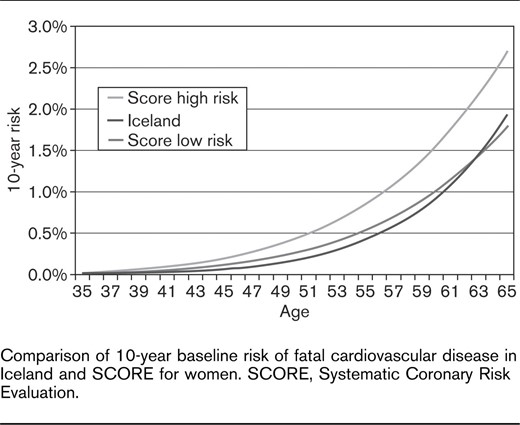
Comparison of 10-year baseline risk of fatal cardiovascular disease in Iceland and SCORE for women. SCORE, Systematic Coronary Risk Evaluation.
Receiver operating characteristic (ROC) analysis of the coronary heart disease (CHD) risk chart when applied to different endpoints: coronary heart disease (CHD) morbidity or fatal cardiovascular disease (CVD) of the Icelandic Reykjavik Study cohort with sensitivity and specificity at 8, 10, 15, and 20% risk threshold levels
| Endpoint | |||
|---|---|---|---|
| CHD morbidity | Fatal CVD | ||
| ROC area | 0.78 (0.77-0.80) | 0.80 (0.78-0.82) | |
| Sensitivity - specificity at 8% threshold | 69-73 | 74-72 | |
| Sensitivity - specificity at 10% threshold | 56-81 | 64-80 | |
| Sensitivity - specificity at 12% threshold | 44-87 | 54-86 | |
| Sensitivity - specificity at 20% threshold | 16-97 | 22-99 | |
For men, the equation suggests that a 5% fatal CVD risk corresponds to a 13% CHD risk, but for women, 5% fatal CVD risk corresponds to an 8% CHD risk. The Spearman's rank correlation between the CHD score and the fatal CVD score was 0.96 (0.97 for men and 0.98 for women).
Discussion
In this paper, we have estimated the relative and absolute 10-year risk of fatal CVD in Iceland and compared the risk functions with those of the SCORE project. An entirely local version was created in which both baseline and relative risks were estimated from Icelandic data. Another calibrated version was created in which the baseline risk was estimated from Icelandic data and then calibrated according to the prevalence of risk factors in the cohort. After this, the SCORE relative risk estimates were used to estimate individual risk. Owing to the similiarity in relative risk estimates (Table 2) from the Icelandic data and SCORE, the agreement between the two versions was almost perfect. In the rest of the discussion, we refer only to the local version.
The main findings are that the risk for fatal CVD in Iceland is in accordance with the SCORE project; the risk for younger men tallies with that in low-risk European nations and diverges towards that in high-risk nations with increasing age. On the other hand, the risk for women is identical to that for women in a low-risk nation.
Comparisons of relative risk estimates show a remarkable similarity between the estimates from Iceland and those from SCORE cohorts. The difference is of no practical importance, as can be seen from inspecting the results (Table 2). The correlation between the Reykjavik Risk Score and SCORE is almost perfect. From this comparison, it can be concluded that cardiovascular risk factors have similar or even identical effects on the pathogenesis of CVDs in Iceland as in other European countries.
The main purpose of the SCORE project was to provide a European scoring system that could be used to assess individual global coronary risk in a clinical setting. The cumulative CVD death rate by the age of 65 years in the 12 cohorts pooled in the SCORE project varied widely. For men it ranged from 2.81% in Spain to 12.80% in Finland and for women it ranged from 0.94 to 2.66% in the same countries [1]. Owing to this heterogeneity, it was emphasized that the risk assessment should be adapted to national conditions wherever possible. In this paper, we show how the SCORE system performs in a European population that was not included in the compilation of the SCORE database. The adaption of the SCORE system to Iceland works perfectly.
The cumulative CVD death rate before the age of 65 years for Icelandic men was 6.41%, which is intermediate for the European cohorts and almost identical to the death rate for men in Denmark. In contrast, the CVD death rate for Icelandic women was low or 1.66% before the age of 65 years (Table 1). CHD deaths as a percentage of all CVD deaths is highest in Iceland, when compared with the SCORE cohorts, at 88% for men and 72% for women. The quality of this registration has been described to be good for Iceland according to MONICA methods [14].
In Figs. 1 and 2, we show that the baseline risk in Iceland can be characterized with respect to the baseline risk in Europe. The resulting CVD risk chart for Iceland is shown in Fig. 3. It resembles the low-risk version of the SCORE chart, except the risk for Icelandic men is higher as they approach the age of 65 years. In Table 5, we further show the almost equal performance of the Icelandic chart and the low risk SCORE chart in terms of diagnostic capacity.
The recommended risk threshold for maximal attention and possible intervention is 5% according to the SCORE project. The Icelandic chart and the SCORE low-risk chart perform equally well, but the specificity of the SCORE high-risk version is too low when applied to the Icelandic cohort. This result is in line with results from Norway which suggest that the specificity of the high-risk chart is much too low [20]. In both cases, the low specificity is the result of applying the SCORE high-risk version to a low-risk population, thereby underscoring the importance of applying appropriate risk function to any given population.
The stated rationale for using total CVD risk rather than CHD risk (composite endpoints) in the SCORE project was the similarity of the etiology of MI, ischemic stroke, and peripheral vascular disease, and similarity of their responses to therapy such as statin treatment [8]. Total CVD risk will thus give a better estimate of the true consequences of each individual's risk factors and provide a better reflection of the health-service implications of cardiovascular risk factors. This approach will allow for the fact that noncoronary CVD is particularly important in some regions of Europe, which have low CHD rates. Using mortality data also opens up possibilities for countries with limited or incomplete morbidity data. The adoption of total cardiovascular risk and mortality endpoints, however, has raised some concern. It has been pointed out that owing to differences in risk-factor profiles for stroke and CHD, and especially between risk factors for ischemic and hemorrhagic strokes, lumping might lead to distortion [9]. Moreover, changes in case fatality with time [21, 22] are also bound to cause discrepancies between risk trends and mortality trends.
We have calculated a risk chart for CHD composite endpoints for Icelandic men and women, and have shown that there is a strong association between fatal CVD risk and the risk of suffering a CHD endpoint (MI, CABG, or PCI). The association, however, differs between men and women, reflecting a higher burden of fatal non-CHD CVD events in women, as is shown in Table 1. It is of interest that the CHD chart performs just as well as the CVD risk chart when detecting fatal CVD events, with an appropriate choice of high-risk threshold. Although the risk predictions based on mortality and morbidity data correlate so closely in Iceland it, still, does not follow that such a close correlation is a universal phenomenon. Differences in mortality statistics and variation in case fatality can cause differences in mortality between countries. Data from other populations need to be obtained before this can be answered, but to our knowledge this is the only population-based study to publish this information and make it available.
The data suggest that the 10-year risk threshold of 5% for fatal CVD corresponds to about 12% risk for CHD, which is significantly lower than the previously used threshold of 20% [23]. This results in greater sensitivity, and therefore better identification of people at high risk.
In conclusion, the data from Iceland show that CVD-risk factors have a similar effect on Icelanders as on other Europeans; that is, the relative-risk estimates from levels of cholesterol, SBP, and smoking status are exchangeable between Iceland and Europe. Baseline risk in Iceland is comparable to baseline risk in low-risk European countries. Thus, the low-risk version of the SCORE chart can be applied to risk evaluation in Iceland, and the Icelandic data externally validates the SCORE project risk functions. As the data are available, the Icelandic version should, however, be used for Iceland to give a better estimate of the absolute risk, especially for men. The risk estimate that is used is a choice of clinical preference between CHD composite endpoint risk and fatal CVD risk. The data, however, suggest that using 5% as a high-risk threshold of fatal CVD corresponds to 12% risk of CHD, which is a significant change from the conventional reference value of 20%.
Our results support the fundamental purpose of the SCORE project, which is to provide a basis for a regional risk-scoring system after adaptations based on local data [1, 24].
Acknowledgements
This work was supported by the Icelandic Heart Association.
Conflict of interest - none declared.
References
1
2
3
4
5
6
7
8
9
10
11
12
14
15
16
17
18
19
20
21
22
23
24

Comments