


Abstract
To evaluate whether the effect of inclisiran to lower LDL-C varied by background lipid-lowering therapy (LLT).
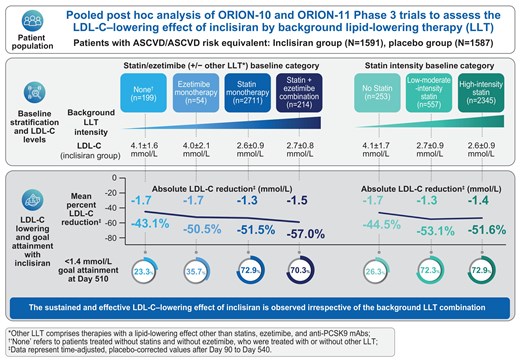
In ORION-10 and ORION-11 Phase 3 trials, patients (N = 3178) with atherosclerotic cardiovascular disease (ASCVD) or ASCVD risk equivalents were randomized 1:1 to receive inclisiran or placebo on Day 1, Day 90, and 6-monthly thereafter. In this pooled post hoc analysis, patients were stratified by baseline combination therapy [statin plus ezetimibe (n = 214; 6.7%)], monotherapy [statin (n = 2711; 85.3%) or ezetimibe (n = 54; 1.7%)], or neither LLT [none (n = 199; 6.3%)] into therapy groups with/without other LLT. Stratification by baseline statin intensity was also performed (N = 3155). Relative and absolute changes in LDL-C were assessed. Mean (±SD) baseline LDL-C was 2.7 mmol/L (±1.0), 2.6 mmol/L (±0.9), 3.7 mmol/L (±1.7), and 4.1 mmol/L (±1.5) among patients receiving combination, statin, ezetimibe, or neither LLT, respectively. In these categories, mean (95% confidence interval) time-adjusted, placebo-corrected percentage change in LDL-C after Day 90 to Day 540 with inclisiran were −57.0% (−63.8, −50.1), −51.5.% (−53.4, −49.7), −50.5.% (−59.6, −41.5), and −43.1% (−48.7, −37.6); corresponding absolute changes were −1.5 mmol/L (−1.7, −1.3), −1.3 mmol/L (−1.4, −1.3), −1.7 mmol/L (−2.0, −1.4), and −1.7 mmol/L (−1.9, −1.5).
Sustained and effective LDL-C lowering with inclisiran was observed irrespective of background LLT treatment. Inclisiran was overall well tolerated with all background LLT treatments, consistent with its established safety profile.
Lay Summary
Statins are commonly used to lower low-density lipoprotein cholesterol (LDL-C), known as ‘bad’ cholesterol, to help reduce the risk of heart attacks and strokes. However, statin therapy alone is often insufficient for patients to achieve their recommended LDL-C goal; in such cases, physicians will recommend combining statins with additional lipid-lowering therapies (LLTs). Inclisiran is a type of medicine called a small-interfering RNA (siRNA). Inclisiran effectively lowers LDL-C with or without statins. In this study, we looked at the effect of inclisiran on LDL-C in people taking different types of background LLT.
This study shows that inclisiran effectively lowers LDL-C in people taking statins, ezetimibe, statins plus ezetimibe, or in people taking no background LLT. With inclisiran, most of the people studied achieved their LDL-C goal
Inclisiran was generally safe and well-tolerated, and different types of background LLT did not impact inclisiran's safety profile. These findings may help guide clinicians in using inclisiran as part of a combination LLT strategy
Introduction
Statins are recommended as the first-line pharmacotherapy for lowering low-density lipoprotein cholesterol (LDL-C) and the treatment and prevention of atherosclerotic cardiovascular disease (ASCVD).1,2 However, increasingly lower LDL-C goals [currently <1.4 mmol/L [55 mg/dL] or <1.8 mmol/L [70 mg/dL]) recommended by various clinical guidelines are often not achievable with high-intensity statin treatment alone.1,2
Data from the DaVINCI study in Europe demonstrated that only 14%, 16%, and 22% of very-high risk patients receiving low-, moderate-, and high-intensity statin monotherapy, respectively, achieved the 2019 European Society of Cardiology/European Atherosclerosis Society (ESC/EAS) guideline LDL-C goals.3 Similarly, data from another European study, SANTORINI, revealed that only 20.9% of patients who were at high or very-high cardiovascular (CV) risk achieved their respective LDL-C goal with lipid-lowering therapy (LLT) monotherapy, the majority of whom were receiving statin monotherapy.4 At 1-year follow-up in SANTORINI, LDL-C goal attainment did increase to 30.9%, largely driven by LLT use among those not receiving LLT at baseline, but the majority of patients remained above goal.5 When LDL-C goals are not achieved with statins, combination treatment approaches with one or more LLTs (ezetimibe, bempedoic acid, proprotein convertase subtilisin/kexin type 9 [PCSK9]-targeted therapies) is now recommended by expert consensus recommendations and guidelines.6 Patients treated with combination therapy (statin plus other therapies) are more likely to achieve their LDL-C goal compared with patients treated with statin monotherapy.3,4
Variations in the magnitude of LDL-C lowering have been described for all LLT, which can be attributed to genetic, demographic, and phenotypic factors as well as adherence to the dosing regimen.7,8 Therefore, it is important to assess the impact of background LLT on patient responses to treatment, such that additive and perhaps synergistic effects of combination therapies that are safe and can result in consistent, long-term efficacy can be identified.9
Inclisiran is a siRNA targeting hepatic PCSK9 mRNA to lower plasma LDL-C levels. It is approved in over 100 countries and is administered twice-yearly (after the initial and 3-month doses) by a healthcare professional via subcutaneous injection. In the ORION-10 and ORION-11 Phase 3 placebo-controlled trials, inclisiran lowered LDL-C levels by ≥50% over 18 months, providing sustained and effective LDL-C lowering in combination with maximum-tolerated statins (or without statin use in the case of documented statin intolerance) and/or other LLTs.10 However, a detailed assessment of the impact of different background LLT on the efficacy of inclisiran has not been previously performed. The objective of this post hoc analysis of ORION-10 and ORION-11 was to determine the relative and absolute reductions in LDL-C and other atherogenic lipids in response to inclisiran treatment, as well as the safety and tolerability, among patients with ASCVD or ASCVD risk equivalents and elevated LDL-C stratified according to background LLT at baseline. The data from ORION-9, a study in heterozygous familial hypercholesterolaemia, were not included because of genetic and physiological differences compared with patients with more common forms of hyperlipidaemia.11
Methods
Study design
ORION-10 and ORION-11 were randomized, placebo-controlled, parallel group, Phase 3 trials that assessed the efficacy, safety, and tolerability of inclisiran over a period of 18 months in patients with high risk for CV disease.10 Trial protocols were approved by institutional review boards or independent ethics committees at each participating institution. Written informed consent was provided by all patients.
Eligible patients were those ≥18 years of age with ASCVD or ASCVD risk equivalent (defined as type 2 diabetes, familial hypercholesterolaemia, or a 10-year risk of a CV event of ≥20% as assessed by the Framingham Risk Score for CV disease or equivalent) and elevated LDL-C levels (≥1.8 mmol/L for ASCVD; ≥2.6 mmol/L for ASCVD risk equivalent) at screening, despite receiving statins at the maximum-tolerated dose (MTD) with or without additional LLT were included. The MTD was defined as the maximum dose of a statin that could be taken by the patient on a regular basis without unacceptable adverse events. As per the inclusion criteria for both ORION-10 and ORION-11 trials, patients not receiving statins could participate provided they had documented evidence of intolerance to at least two statins: one statin at the lowest available daily dose and another statin at any dose.10 Patients who were treated with anti-PCSK9 monoclonal antibodies (mAbs) within 90 days before screening were excluded.
Patients were randomized in a 1:1 ratio to receive either 284 mg inclisiran (300 mg inclisiran sodium) or matching placebo administered by subcutaneous injection on Day 1, Day 90, and 6-monthly thereafter over a period of 540 days. Patients also attended the clinic on Days 30, 150, 330, and 510 for follow-up and laboratory assessments, with an end-of-trial visit conducted on Day 540.
For this pooled post hoc analysis, patients were stratified according to their background LLT present at baseline. In the baseline statin/ezetimibe (with or without other LLT) category, patients were stratified into the following therapy groups: none [with or without other LLT (n = 199; 6.3%)], statin monotherapy [with or without other LLT (n = 2711; 85.3%)], ezetimibe monotherapy [with or without other LLT (n = 54; 1.7%)], and statin plus ezetimibe combination [with or without other LLT (n = 214; 6.7%)]. ‘None’ refers to patients who did not receive either statins or ezetimibe, who were treated with or without other LLT. Other LLT comprises therapies with a lipid-lowering effect other than statins, ezetimibe, and anti-PCSK9 mAbs, with details provided in Supplementary material online, Table S1. Within each baseline therapy group, efficacy and safety outcomes were compared between inclisiran and placebo arms. To determine any potential influence of other LLT, we also analyzed the baseline statin/ezetimibe LLT category without other LTT, including the same four therapy groups but restricted to patients who were not receiving ‘other LLT’ at baseline. Patients were also stratified by baseline statin intensity level according to the 2018 American Heart Association/American College of Cardiology guidelines2: high-intensity statin (n = 2345; 73.8%), low-to-moderate intensity statin (n = 557; 17.5%), and no statin (n = 253; 8.0%). Patients were also stratified into CV risk categories, very-high risk, high risk, and moderate risk as per the 2019 ESC/EAS guidelines.1 Various endpoint analyses were also performed in patients with ASCVD only.
Endpoints
The co-primary endpoints, as in the original publications, were the percentage change in LDL-C from baseline to Day 510 and the time-adjusted percentage change in LDL-C from baseline after Day 90 and up to Day 540. Key secondary endpoints included the absolute change in LDL-C from baseline to Day 510, the time-adjusted absolute change in LDL-C from baseline after Day 90 and up to Day 540, and the percentage change in PCSK9, and atherogenic lipids [total cholesterol, non-high-density lipoprotein cholesterol (non-HDL-C), and triglycerides] and lipoproteins [apolipoprotein B (apoB) and lipoprotein(a) (Lp(a))]. Other secondary endpoints included the proportion of patients attaining pre-specified LDL-C goals at Day 510 [<2.6 mmol/L (100 mg/dL), <1.8 mmol/L (70 mg/dL), <1.4 mmol/L (55 mg/dL), and <1.0 mmol/L (40 mg/dL)] and the proportion of patients achieving a ≥50% reduction in LDL-C levels from baseline at Day 510, as well as a combination of these two endpoints.
Safety analyses included the proportion of patients with treatment-emergent adverse events (TEAEs), treatment-emergent serious adverse events (TESAEs), TEAEs leading to study discontinuation, clinically relevant TEAEs at the injection site and clinically relevant laboratory assessments. Reported TEAEs were defined using the Medical Dictionary for Regulatory Activities version (v20.1) standardized terms by system organ classification. The incidence of new onset diabetes in patients with no diabetes at baseline was determined as previously described.12
Statistical methods
Baseline characteristics and efficacy analyses were performed in the intention-to-treat population containing all randomized patients. Safety was analyzed in the safety population containing all patients who received ≥1 dose of study drug. The treatment-by-background LLT category interaction effects for baseline characteristics and demographics were analyzed using analysis of covariance (ANCOVA) and logistic regression models with treatment, study, background LLT stratification, and treatment-by-background LLT category interaction as factors.
For the analysis of co-primary endpoints, missing data, which were generally infrequent, were imputed using multiple imputation methods. The percentage and absolute change in LDL-C from baseline to Day 510 were analyzed using ANCOVA including treatment, study, and baseline LDL-C value as a covariate in the model with a multiple imputation washout model for missing data. The time-adjusted percentage change in LDL-C from baseline after Day 90 and up to Day 540 was analyzed using a mixed-effects model for repeated measures (MMRM) including treatment, visit, treatment-by visit interaction, study, and baseline LDL-C value as covariates and a control-based pattern mixture model for missing data imputation. For each endpoint, treatment effects estimated from multiple imputed data were combined using Rubin's Method.
The time-adjusted absolute change in LDL-C from baseline after Day 90 and up to Day 540 and the percentage change in PCSK9, total cholesterol, non-HDL-C, apoB, and triglycerides from baseline to Day 510 were analyzed using a MMRM without imputation of missing data. The percentage change in Lp(a) from baseline to Day 540 was analyzed using a quantile regression model without imputation of missing data. The proportions of patients reaching LDL-C goals were summarized and reported as a percentage using a logistic regression model with treatment and study as covariates.
All models were applied separately within each background LLT category. Tests for the interaction of treatment with background LLT were conducted for the efficacy endpoints. The post hoc analyses presented in this manuscript were not pre-specified and, therefore, were not adjusted for multiplicity. Nominal P values and 95% confidence intervals (CIs) were considered descriptive measures for the strength of the association between treatment arms and endpoints and not formal criteria to claim statistical significance. Analyses were performed using SAS version 9.4.
Results
Baseline characteristics
Of a total of 3178 randomized patients, background LLT present at baseline was statin monotherapy (n = 2711; 85.3%), ezetimibe monotherapy (n = 54; 1.7%), statin plus ezetimibe (n = 214; 6.7%), or none (n = 199; 6.3%). Statin and/or ezetimibe were the sole LLT in 80.2% (n = 2548) of randomized patients. When patients were stratified by a baseline statin intensity category, 23 patients were excluded from the analysis as an intensity level could not be assigned (see Supplementary material online, Figure S1).
At baseline, mean (±SD) LDL-C levels were 2.7 mmol/L (±1.0), 2.6 mmol/L (±0.9), 3.7 mmol/L (±1.7), and 4.1 mmol/L (±1.5) among patients receiving statin and ezetimibe in combination, statin, ezetimibe, or neither LTT, respectively. By statin intensity, mean (±SD) LDL-C levels at baseline were 2.6 mmol/L (±0.9), 2.7 mmol/L (±0.9), and 4.0 mmol/L (±1.5) among the high-intensity (n = 2345; 73.8%), low-to-moderate intensity (n = 557; 17.5%), and no statin (n = 253; 8.0%) groups, respectively. Data on other baseline lipid (total cholesterol, non-HDL-C, and triglycerides) and lipoprotein (apoB) levels across all background LLT categories can be found in Table 1, Supplementary material online, Tables S2 and S3. Across all background LLT categories, mean baseline PCSK9 levels ranged between 273.5 ng/mL and 450.3 ng/mL, while median Lp(a) levels ranged between 31.0 and 120.5 nmol/L (Table 1, Supplementary material online, Tables S2 and S3). By ESC/EAS risk category, 98.9% (3144) of patients were categorized as very-high risk at baseline (see Supplementary material online, Table S4).1
Baseline demographic and clinical characteristics stratified by the baseline statin/ezetimibe (with or without other LLT) category
| Baseline statin/ezetimibe (± other LLT) | ||||||||
|---|---|---|---|---|---|---|---|---|
| Statin (±other LLT) | Statin + ezetimibe (± other LLT) | Ezetimibe (±other LLT) | None (±other LLT) | |||||
| Inclisiran (n = 1363) | Placebo (n = 1348) | Inclisiran (n = 104) | Placebo (n = 110) | Inclisiran (n = 28) | Placebo (n = 26) | Inclisiran (n = 96) | Placebo (n = 103) | |
| Age, years, mean ± SDb | 65.4 ± 8.5 | 65.2 ± 8.8 | 65.2 ± 8.4 | 63.5 ± 8.5 | 70.5 ± 8.5a | 64.3 ± 8.8a | 67.5 ± 9.5 | 67.7 ± 8.7 |
| Male, n (%) | 969 (71.1) | 977 (72.5) | 68 (65.4) | 73 (66.4) | 18 (64.3) | 13 (50.0) | 59 (61.5) | 66 (64.1) |
| BMI, kg/m2, mean ± SD | 30.6 ± 5.6 | 31.0 ± 5.8 (n = 1346) | 30.0 ± 4.4 | 30.6 ± 5.8 | 30.3 ± 4.7 | 31.9 ± 5.7 | 31.5 ± 7.7 | 30.8 ± 6.4 |
| CV risk factors, n (%) | ||||||||
| ASCVD | 1288 (94.5) | 1262 (93.6) | 100 (96.2) | 107 (97.3) | 28 (100.0)a | 22 (84.6)a | 77 (80.2) | 91 (88.3) |
| ASCVD risk equivalent | 75 (5.5) | 86 (6.4) | 4 (3.8) | 3 (2.7) | 0 (0.0)a | 4 (15.4)a | 19 (19.8) | 12 (11.7) |
| CHF | 178 (13.1) | 173 (12.8) | 13 (12.5) | 21 (19.1) | 3 (10.7) | 4 (15.4) | 15 (15.6) | 20 (19.4) |
| Current smoker | 265 (19.4)a | 218 (16.2)a | 11 (10.6) | 9 (8.2) | 0 (0.0) | 3 (11.5) | 7 (7.3) | 13 (12.6) |
| Diabetes mellitusb | 587 (43.1)a | 514 (38.1)a | 34 (32.7) | 37 (33.6) | 7 (25.0)a | 16 (61.5)a | 39 (40.6) | 36 (35.0) |
| FH | 81 (5.9) | 79 (5.9) | 13 (12.5) | 19 (17.3) | 2 (7.1) | 2 (7.7) | 10 (10.4)a | 15 (14.6)a |
| Hypertension | 1165 (85.5) | 1156 (85.8) | 85 (81.7) | 99 (90.0) | 25 (89.3) | 21 (80.8) | 79 (82.3) | 86 (83.5) |
| ESC/EAS risk category, n (%) | ||||||||
| Very-high risk | 1348 (98.9) | 1337 (99.2) | 102 (98.1) | 109 (99.1) | 28 (100.0) | 25 (96.2) | 95 (99.0) | 100 (97.1) |
| High risk | 13 (1.0) | 10 (0.7) | 2 (1.9) | 1 (0.9) | 0 (0.0) | 1 (3.8) | 1 (1.0) | 3 (2.9) |
| Moderate risk | 2 (0.1) | 1 (0.1) | 0 (0.0) | 0 (0.0) | 0 (0.0) | 0 (0.0) | 0 (0.0) | 0 (0.0) |
| LLT at Day 1, n (%) | ||||||||
| Statin | 1363 (100.0) | 1348 (100.0) | 104 (100.0) | 110 (100.0) | 0 (0.0) | 0 (0.0) | 0 (0.0) | 0 (0.0) |
| High-intensity statin | 1099 (80.6) | 1090 (80.9) | 72 (69.2) | 84 (76.4) | 0 (0.0) | 0 (0.0) | 0 (0.0) | 0 (0.0) |
| Ezetimibe | 0 (0.0) | 0 (0.0) | 104 (100.0) | 110 (100.0) | 28 (100.0) | 26 (100.0) | 0 (0.0) | 0 (0.0) |
| Laboratory measurements (mean ± SD unless indicated) | ||||||||
| LDL-C, mmol/L | 2.6 ± 0.9 | 2.6 ± 0.8 | 2.7 ± 0.8 | 2.8 ± 1.1 | 4.0 ± 2.1 | 3.3 ± 1.0 | 4.1 ± 1.6 | 4.0 ± 1.3 |
| TC, mmol/Lb | 4.6 ± 1.1 | 4.6 ± 1.0 | 4.7 ± 1.0 | 4.8 ± 1.3 | 6.2 ± 2.4 | 5.3 ± 1.0 | 6.3 ± 1.8 | 6.1 ± 1.4 |
| Non-HDL-C, mmol/L | 3.4 ± 1.0 | 3.4 ± 1.0 | 3.5 ± 0.9 | 3.5 ± 1.3 | 4.8 ± 2.3 | 4.1 ± 0.9 | 5.1 ± 1.7 | 4.9 ± 1.4 |
| ApoB, mg/dL | 92.7 ± 23.7 (n = 1360) | 92.1 ± 22.6 (n = 1346) | 96.4 ± 21.6 | 96.3 ± 28.9 | 121.3 ± 46.6 | 109.7 ± 21.5 | 129.6 ± 38.1 (n = 95) | 125.1 ± 31.4 |
| Lp(a), nmol/L, median (Q1, Q3) | 50.5 (18.0, 184.0) (n = 1360) | 42.0 (19.0, 183.0) (n = 1346) | 69.5 (18.5, 284.5) | 120.5 (31.0, 297.0) | 59.5 (19.0, 144.0) | 43.0 (11.0, 152.0) | 35.0 (14.0, 133.0) (n = 95) | 31.0 (14.0, 143.0) (n = 102) |
| TG, mmol/L, median (Q1, Q3) | 1.5 (1.1, 2.0) | 1.5 (1.1, 2.1) | 1.5 (1.0, 1.9) | 1.3 (1.0, 1.9) | 1.4 (1.0, 1.9) | 1.5 (1.2, 1.9) | 2.1 (1.3, 2.6) | 1.8 (1.4, 2.5) |
| PCSK9, ng/mL | 385.8 ± 140.4 (n = 1358) | 381.6 ± 111.6 (n = 1343) | 450.3 ± 127.8 | 437.0 ± 135.4 | 361.0 ± 158.7a | 286.2 ± 58.1a | 357.2 ± 214.5 (n = 95) | 373.1 ± 248.4 |
| eGFR, mL/min/1.73 m2 | 78.2 ± 21.0 | 78.1 ± 21.0 | 77.8 ± 20.6 | 75.4 ± 19.5 | 80.3 ± 17.2 | 79.1 ± 18.7 | 71.8 ± 19.5 | 73.3 ± 21.2 |
ApoB, apolipoprotein B; ASCVD, atherosclerotic cardiovascular disease; BMI, body mass index; CHF, congestive heart failure; CV, cardiovascular; EAS, European Atherosclerosis Society; eGFR, estimated glomerular filtration rate; ESC, European Society of Cardiology; FH, familial hypercholesterolaemia; HDL-C, high-density lipoprotein cholesterol; LDL-C, low-density lipoprotein cholesterol; LLT, lipid-lowering therapy; Lp(a), lipoprotein(a); PCSK9, proprotein convertase subtilisin/kexin type 9; Q1, lower quartile; Q3, upper quartile; SD, standard deviation; TC, total cholesterol; TG, triglyceride.
aInclisiran vs. placebo P < 0.05.
bSignificant interaction effect between treatment group and baseline statin/ezetimibe category P < 0.05.
Efficacy
With inclisiran compared with placebo, a significant reduction in LDL-C was observed regardless of baseline statin/ezetimibe and baseline statin intensity category treatment (Figure 1, Supplementary material online, Figures S2 and S3).
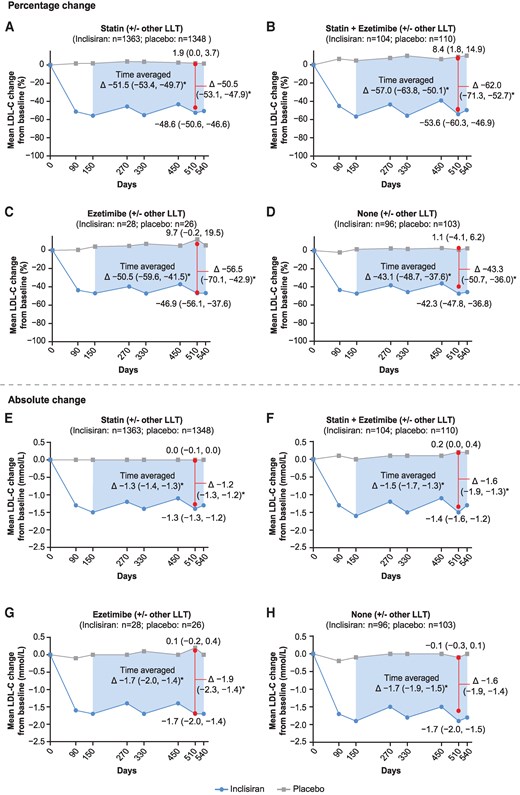
Change in LDL-C over time stratified by the baseline statin/ezetimibe (with or without other LLT) category. (A–D) LS mean (95% CI) percentage change in LDL-C from baseline to Day 510 (red vertical line) was analyzed using ANCOVA with a multiple imputation washout model for missing LDL-C values; time-adjusted LS mean (95% CI) percentage change in LDL-C from baseline after Day 90 and up to Day 540 (shaded blue area) was analysed by MMRM using a CB-PMM for missing data imputation. The LS mean percentage change in LDL-C for post-baseline visits from Day 90 to Day 540 (grey line for placebo, blue line for inclisiran) was analysed using MMRM without imputation of missing data. (E–H) LS mean (95% CI) absolute change in LDL-C from baseline to Day 510 (red vertical line) was analysed using ANCOVA with a multiple imputation washout model for missing LDL-C values; LS mean (95% CI) absolute time-adjusted change in LDL-C from baseline after Day 90 and up to Day 540 (shaded blue area) and the LS mean absolute change in LDL-C for post-baseline visits from Day 90 to Day 540 (grey line for placebo, blue line for inclisiran) were analyzed using MMRM without imputation of missing data. *Inclisiran vs. placebo, P < 0.0001. ANCOVA, analysis of covariance; CB-PMM, control-based pattern mixture model; CI, confidence interval; LDL-C, low-density lipoprotein cholesterol; LLT, lipid-lowering therapy; LS, least squares; MMRM, mixed-effects model for repeated measures.
When stratified by baseline statin/ezetimibe (with or without other LLT), the mean (95% CI) time-adjusted, placebo-corrected percentage changes in LDL-C with inclisiran after Day 90 and up to Day 540 in decreasing hierarchy were, −57.0% (−63.8, −50.1) in the statin plus ezetimibe group, −51.5.% (−53.4, −49.7) in the statin group, −50.5.% (−59.6, −41.5) in the ezetimibe group, and −43.1% (−48.7, −37.6) in the none group (Figure 1). The corresponding mean (95% CI) time-adjusted, placebo-corrected absolute changes in LDL-C from baseline to Day 510 were −1.5 mmol/L (−1.7, −1.3), −1.3 mmol/L (−1.4, −1.3), −1.7 mmol/L (−2.0, −1.4), and −1.7 mmol/L (−1.9, −1.5). The corresponding mean (95% CI) placebo-corrected percentage and absolute changes in LDL-C at Day 510 are presented in Figure 1, while corresponding results from the baseline statin/ezetimibe (without other LLT) category are presented in Supplementary material online, Figure S2.
When patients were stratified by the baseline statin intensity category, the mean (95% CI) time-adjusted, placebo-corrected percentage changes in LDL-C with inclisiran after Day 90 and up to Day 540 in the high-intensity statin, low-to-moderate intensity statin, and no statin groups were −51.6% (−53.7, −49.6), −53.1% (−57.0, −49.3), and −44.5% (−49.3, −39.7), respectively (see Supplementary material online, Figure S3). The corresponding mean (95% CI) time-adjusted, placebo-corrected absolute change in LDL-C from baseline to Day 510 were −1.4 mmol/L (−1.5, −1.3), −1.3 mmol/L (−1.4, −1.3), and −1.7 mmol/L (−1.9, −1.5). The corresponding mean (95% CI) placebo-corrected percentage and absolute changes in LDL-C at Day 510 are presented in Supplementary material online, Figure S3.
In a separate subgroup analysis, a similar pattern on percentage and absolute change in LDL-C was observed in patients with ASCVD only (see Supplementary material online, Figures S4–S6).
Overall, treatment with inclisiran compared with placebo significantly lowered levels of total cholesterol, non HDL-C, apoB, and PCSK9 from baseline to Day 510 irrespective of the patients background LLT at baseline; significant differences in triglycerides and Lp(a) levels with inclisiran were also observed in some therapy groups, but not all (Figure 2, Supplementary material online, Figures S7 and S8). When patients were stratified by statin/ezetimibe (with or without other LLT) at baseline, the mean (95% CI) placebo-corrected percentage change in total cholesterol, non-HDL-C, triglycerides, and apoB with inclisiran in the statin plus ezetimibe group were −37.3% (−43.7, −31.0), −54.6% (−63.4, −45.8), −10.2% (−27.9, 7.4), and −47.9% (−54.8, −41.0), respectively. In the no LLT therapy group, the corresponding changes were −29.5% (−34.3, −24.8), −39.2% (−45.0, −33.4), 0.4% (−13.5, 14.3), and −36.6% (−41.6, −31.6; Figure 2). In the statin intensity category, the mean (95% CI) placebo-corrected percentage change in total cholesterol, non-HDL-C, triglycerides, and apoB with inclisiran in the high-intensity statin group were −32.4% (−34.1, −30.8), −47.3% (−49.5, −45.0), −10.0% (−13.6, −6.3), and −43.1% (−45.0, −41.3), respectively; corresponding changes of −30.6% (−34.7, −26.5), −41.1% (−46.1, −36.1), −3.2% (−14.3, 8.0), and −37.8% (−42.2, −33.4) were observed in the no statin therapy group (see Supplementary material online, Figure S8).
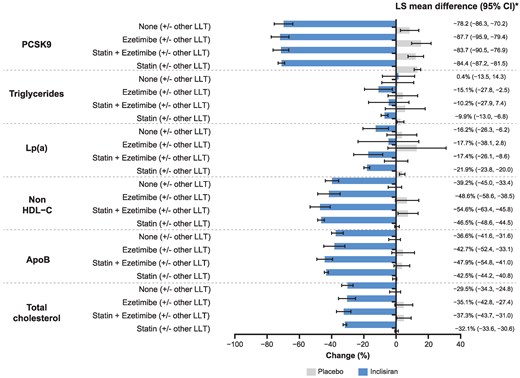
Percentage change in PCSK9 and other atherogenic lipids and lipoproteins at Day 510 stratified by the baseline statin/ezetimibe (with or without other LLT) category. Data are presented as LS mean (95% CI) at Day 510, except for Lp(a) data, which is presented as median values (95% CI) at Day 540. *Inclisiran vs. placebo, P < 0.0001 for all comparisons except for the following: Triglycerides, statin + ezetimibe (P = 0.2541), ezetimibe (P = 0.0196), and none (P = 0.9549); Lp(a), statin + ezetimibe (P = 0.0001), ezetimibe (P = 0.0883), and none (P = 0.0017). ApoB, apolipoprotein B; CI, confidence interval; HDL-C, high-density lipoprotein cholesterol; LLT, lipid-lowering therapy; Lp(a), lipoprotein(a); LS, least squares; PCSK9, proprotein convertase subtilisin/kexin type 9.
The mean (95% CI) placebo-corrected percentage reduction in PCSK9 from baseline to Day 510 in the statin/ezetimibe (with or without other LLT) category ranged between −87.7% (−95.9, −79.4) and −78.2% (−86.3, −70.2) in the ezetimibe and none therapy groups, respectively (Figure 2), and by baseline statin intensity, ranged between −84.9% (−90.5, −79.2) and −79.6% (−85.9, −73.3) in the low-to-moderate intensity statin and no statin groups, respectively (see Supplementary material online, Figure S8). The median (95% CI) placebo-corrected percentage change in Lp(a) from baseline to Day 540 ranged between −21.9% (−23.8, −20.0; statin group) and −16.2% (−26.3, −6.2; none group) in the baseline statin/ezetimibe (with or without other LLT) category (Figure 2) and between −22.8% (−27.7, −17.8; low-to-moderate intensity statins group) and −16.1% (−24.6, −7.5; no statin group) when stratified by baseline statin intensity (see Supplementary material online, Figure S8).
Irrespective of the background LLT category, inclisiran treatment resulted in a significant increase in LDL-C goal attainment compared with placebo across all therapy groups. In the baseline statin/ezetimibe (with or without other LLT) category, 94.4%, 84.4%, 72.9%, and 47.7% of inclisiran-treated patients in the statin therapy group achieved LDL-C goals of <2.6 mmol/L, <1.8 mmol/L, <1.4 mmol/L, and <1.0 mmol/L, respectively; similar responses were observed in the statin plus ezetimibe therapy group treated with inclisiran. In the no background therapy group, 72.1%, 38.4%, 23.3%, and 5.8% of inclisiran-treated patients achieved respective LDL-C goals (Figure 3). Goal attainment data in the corresponding therapy groups from the baseline statin/ezetimibe (without other LLT) category were similar with inclisiran treatment (see Supplementary material online, Figure S9). Supplementary material online, Figure S10 details the proportion of inclisiran-treated patients achieving LDL-C goals at Day 510 stratified by statin intensity. In the high intensity statins therapy group, 94.2%, 84.1%, 72.9%, and 47.6% of inclisiran-treated patients achieved LDL-C goals of <2.6 mmol/L, <1.8 mmol/L, <1.4 mmol/L, and <1.0 mmol/L, respectively. In the no statin therapy group, 74.6%, 43.0%, 26.3%, and 5.3% of inclisiran-treated patients achieved corresponding LDL-C goals. Further analysis in all background LLT categories on the proportion of patients achieving a ≥50% reduction in LDL-C alone or combined with an LDL-C goal of either <1.4 mmol/L or <1.0 mmol/L is provided (Figure 3, Supplementary material online, Figures S9 and S10). The majority of patients (98.9%; n = 3144) were categorized as very high risk; within this, 69.5% of patients treated with inclisiran achieved an LDL-C goal <1.4 mmol/L at Day 510 (see Supplementary material online, Table S5).
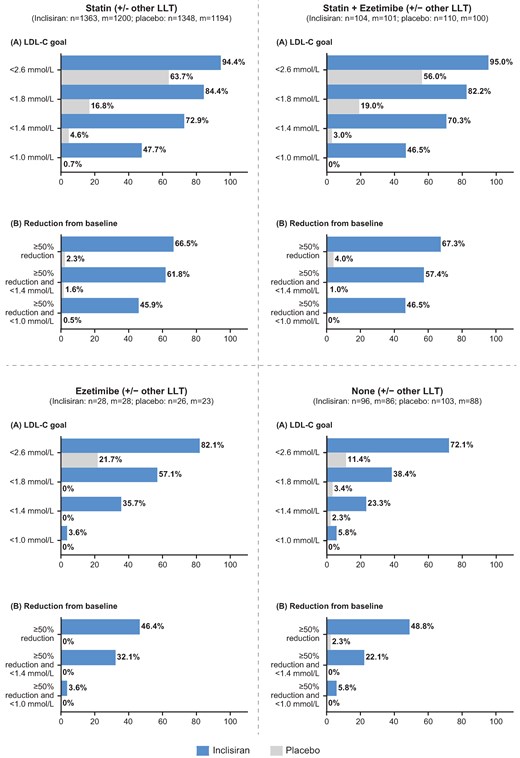
Secondary prevention goal attainment at Day 510 stratified by the baseline statin/ezetimibe (with or without other LLT) category. M = Number of patients with available LDL-C data at Day 510. Presented are number of patients (%) reaching each target. Percentages use M as the denominator. (A) The percentage of patients reaching LDL-C goals at Day 510. (B) The percentage of patients reaching a ≥50% reduction in LDL-C from baseline and indicated LDL-C goals at Day 510. LDL-C, low-density lipoprotein cholesterol; LLT, lipid-lowering therapy.
Safety
The key safety findings are summarized in Table 2 for the baseline statin/ezetimibe (with or without other LLT) category, and Supplementary material online, Table S6 for the baseline statin intensity category. Clinically relevant TEAEs at the injection site occurred in 3.3–7.1% of inclisiran-treated patients compared with 0.0–3.8% of placebo-treated patients in the baseline statin/ezetimibe (with or without other LLT) category (Table 2); when stratified by statin intensity at baseline, the occurrence was 3.4–4.8% with inclisiran treatment compared with 0.7–0.8% in placebo-treated patients (see Supplementary material online, Table S6). In both background LLT categories, TEAEs at the injection site were mild or moderate in severity. No severe TEAEs at the injection site were reported in the underlying studies. The discontinuation rate due to TEAEs was generally low while the proportion of patients with clinically relevant laboratory measurements were generally similar (Table 2, Supplementary material online, Table S6). Incident diabetes cases in each background LLT treatment category were generally balanced across therapy groups. With inclisiran vs. placebo, incident diabetes occurred 9.7% vs. 11.6% receiving background statin; 9.0% vs. 4.2% receiving statin and ezetimibe; 4.8% vs. 10.0% receiving ezetimibe without statin; and 7.1% vs. 6.2% receiving neither treatment. Similarly, with inclisiran vs. placebo, incident diabetes was observed in 10.6% vs. 11.5% receiving background high-intensity statin; 5.8% vs. 9.1% receiving low-to-moderate intensity statin; and 6.5% vs. 6.7% receiving no statin.
Safety summary stratified by the baseline statin/ezetimibe (with or without other LLT) category
| Parameter | Baseline statin/ezetimibe (± other LLT) | |||||||
|---|---|---|---|---|---|---|---|---|
| Statin (± other LLT) | Statin + ezetimibe (± other LLT) | Ezetimibe (± other LLT) | None (± other LLT) | |||||
| Inclisiran (n = 1364) | Placebo (n = 1344) | Inclisiran (n = 104) | Placebo (n = 110) | Inclisiran (n = 28) | Placebo (n = 26) | Inclisiran (n = 96) | Placebo (n = 102) | |
| ≥1 TEAE | 1054 (77.3) | 1046 (77.8) | 87 (83.7) | 86 (78.2) | 25 (89.3) | 20 (76.9) | 79 (82.3) | 85 (83.3) |
| ≥1 TESAE | 291 (21.3) | 317 (23.6) | 30 (28.8) | 34 (30.9) | 9 (32.1) | 6 (23.1) | 26 (27.1) | 29 (28.4) |
| ≥1 drug-related TESAE | 2 (0.1) | 5 (0.4) | 0 (0.0) | 0 (0.0) | 0 (0.0) | 0 (0.0) | 0 (0.0) | 0 (0.0) |
| Discontinued due to TEAEs | 10 (0.7) | 4 (0.3) | 0 (0.0) | 0 (0.0) | 0 (0.0) | 0 (0.0) | 2 (2.1) | 1 (1.0) |
| Deaths | 23 (1.7) | 22 (1.6) | 1 (1.0) | 2 (1.8) | 0 (0.0) | 0 (0.0) | 2 (2.1) | 2 (2.0) |
| ≥1 Clinically relevant TEAE at the injection site | ||||||||
| Any | 45 (3.3) | 10 (0.7) | 7 (6.7) | 0 (0.0) | 2 (7.1) | 1 (3.8) | 4 (4.2) | 0 (0.0) |
| Mild | 28 (2.1) | 9 (0.7) | 6 (5.8) | 0 (0.0) | 1 (3.6) | 1 (3.8) | 3 (3.1) | 0 (0.0) |
| Moderate | 17 (1.2) | 1 (0.1) | 1 (1.0) | 0 (0.0) | 1 (3.6) | 0 (0.0) | 1 (1.0) | 0 (0.0) |
| Severe | 0 (0.0) | 0 (0.0) | 0 (0.0) | 0 (0.0) | 0 (0.0) | 0 (0.0) | 0 (0.0) | 0 (0.0) |
| Clinically relevant laboratory parameters | ||||||||
| ALT >3 × ULN | 5 (0.4) | 5 (0.4) | 0 (0.0) | 1 (0.9) | 0 (0.0) | 0 (0.0) | 1 (1.0) | 0 (0.0) |
| AST >3 × ULN | 5 (0.4) | 7 (0.5) | 0 (0.0) | 2 (1.8) | 0 (0.0) | 0 (0.0) | 1 (1.0) | 0 (0.0) |
| ALP >2 × ULN | 5 (0.4) | 5 (0.4) | 0 (0.0) | 0 (0.0) | 0 (0.0) | 0 (0.0) | 1 (1.0) | 0 (0.0) |
| Creatinine >2 mg/dL | 32 (2.3) | 32 (2.4) | 2 (1.9) | 3 (2.7) | 0 (0.0) | 0 (0.0) | 1 (1.0) | 3 (2.9) |
| Muscle CK >5 × ULN | 17 (1.2) | 12 (0.9) | 0 (0.0) | 3 (2.7) | 1 (3.6) | 0 (0.0) | 2 (2.1) | 2 (2.0) |
| Bilirubin >2 × ULN | 7 (0.5) | 10 (0.7) | 2 (1.9) | 0 (0.0) | 0 (0.0) | 0 (0.0) | 1 (1.0) | 1 (1.0) |
| Platelet count ≤75 × 109/L | 1 (0.1) | 1 (0.1) | 0 (0.0) | 0 (0.0) | 0 (0.0) | 0 (0.0) | 0 (0.0) | 0 (0.0) |
Presented are number of patients (%).
ALT, alanine aminotransferase; AP, alkaline phosphatase; AST, aspartate aminotransferase; CK, creatine kinase; LLT, lipid-lowering therapy; TEAE, treatment-emergent adverse event; TESAE, treatment-emergent serious adverse event; ULN, upper limit of normal.
Discussion
Inclisiran is an approved siRNA which is effective in combination with maximally tolerated statin therapy and/or ezetimibe to lower LDL-C as reported in the pivotal Phase 3 trials13 and long-term open-label extension trials.14,15 This post hoc analysis is the first detailed analysis to evaluate whether differences in background LLT, at the time of randomization to inclisiran or placebo, impacted the efficacy and/or safety and tolerability of inclisiran with regards to LDL-C lowering. The analyses reported here indicates that inclisiran provides sustained and effective LDL-C lowering that is consistent across all backgrounds of concomitant LLT (Graphical abstract). The absence or presence of LLT other than statin or ezetimibe did not appear to impact the response to inclisiran treatment as has been reported with the use of anti PCSK9 mAbs.16–18 A network-meta analysis suggests similar lipid-lowering efficacy of anti-PCSK9 mAbs and inclisiran.19
Overall, the LDL-C–lowering effect of inclisiran was consistent over an 18-month period, irrespective of the background LLT. These data may help guide clinicians use of inclisiran as an adjunct LLT strategy.13 Additionally, the data did not reveal any safety concerns or that TEAEs at the injection site were influenced by background LLT.
Other lipid parameters
The assessment of other atherogenic lipids (total cholesterol, non-HDL-C, and triglycerides) and lipoproteins including apoB and Lp(a) followed a similar pattern to LDL-C. Inclisiran reduced total cholesterol, non-HDL-C, triglycerides, Lp(a), apoB, and PCSK9 levels irrespective of background LLT. As for LDL-C, these reductions were consistent over an 18-month period. The percentage reduction in Lp(a) with inclisiran treatment ranged between −10.0% and −22.8% across all therapy groups and are consistent with previous studies of inclisiran13 and evolocumab treatment.20 The placebo-corrected percentage change in plasma PCSK9 levels from baseline to Day 510 with inclisiran treatment was consistent, irrespective of background LLT, with a minimal reduction of −78.2%, which was observed in the none (with or without other LLT) therapy group (n = 199; 6.3%).
Achievement of LDL-C goals in patients with very-high CV risk
Achieving guideline-recommended LDL-C goals is particularly important for patients with very-high CV risk who require the most intensive LLT management.1,2 However, a common challenge in the clinical management of patients with elevated LDL-C is the difficulty in achieving and sustaining low LDL-C thresholds, partly due to long-term non-adherence to LLTs which increases CV risk.21 Therefore, effective therapies, which are safe and do not significantly add to the medication burden for patients would be highly beneficial towards LDL-C goal attainment.22 The majority (98.9%) of patients included in this analysis were categorized as very-high risk, with a mean baseline LDL-C level of 2.7 mmol/L despite treatment. The addition of inclisiran to background LLT resulted in 69.5% (972) of these patients reaching their LDL-C goal (<1.4 mmol/L) compared with 4.3% (60) of patients from the placebo arm. This finding demonstrates how the sustained and effective LDL-C–lowering effect of inclisiran can translate into improved LDL-C management in patients at the highest risk, when used in combination with maximum-tolerated LLT (primarily statin and/or ezetimibe). This is further demonstrated in the baseline statin/ezetimibe (with or without other LLT) and statin-intensity categories, where the majority of placebo-treated patients were unable to attain their LDL-C goals despite receiving intensive LLT; but 72.9% of inclisiran-treated patients receiving high-intensity statins achieved an LDL-C goal >1.4 mmol/L at Day 510.
The safety analysis from this post hoc analysis is consistent with findings from other analyses of ORION trials, which have shown a favourable long-term safety and tolerability profile of inclisiran in patients with dyslipidaemia treated for up to 6 years.15,23 Despite the different background LLT, no overt safety signals including TEAEs, TESAEs, and clinically relevant laboratory measurements were identified in any subgroup, except for a modest excess of mild-to-moderate TEAEs at the injection site with inclisiran in all therapy groups. This is consistent with previous findings.10,11,13,15
The limitations of this study include the post hoc nature of the analysis. The choice of background LLT was made by individual providers, was not systematically determined, and was likely influenced by untreated lipid levels, which were not available for this analysis. The background LLT therapy groups other than statin monotherapy were small, and accordingly there was more uncertainty in the estimate of inclisiran's effects in those therapy groups. As such, this analysis is not sufficiently powered for comparison between different therapy groups and the conclusions are limited based on comparisons between inclisiran vs. placebo in each group. This analysis did not consider potential changes in background LLT adherence or therapy adjustments during the trial period. This analysis did not examine the influence of background LLT on the risk of CV events with inclisiran vs. placebo. The effect of inclisiran on CV outcomes is currently being investigated in large, long-term placebo-controlled trials, ORION-4 (NCT03705234), VICTORION-1 Prevent (NCT05739383), and VICTORION-2 Prevent (NCT05030428).
In conclusion, the sustained and effective LDL-C–lowering effect of twice-yearly inclisiran (after initial and 3-month doses) was observed irrespective of background LLT. Inclisiran was overall well tolerated with all background LLT treatments, consistent with its established safety profile. Inclisiran can therefore provide a safe alternative escalation therapy for individuals at risk across the entire spectrum of suitable background LLT.
Supplementary material
Supplementary material is available at European Journal of Preventive Cardiology.
Acknowledgements
The authors thank all the investigators, trial site staff, and patient volunteers who participated in the trials. The authors thanks Tony Walsh, PhD (Novartis Ireland Ltd.), and Shivani Vadapalli, PhD (Novartis, Healthcare Pvt. Ltd. India) for providing medical writing support in accordance with Good Publication Practice 2022 (https://www.acpjournals.org/doi/10.7326/M22-1460), and Klaus Molle, PhD (Novartis Pharma AG) for critical review of the manuscript.
Author contributions
U.L. and R.S.W. directed the conception of the manuscript. L.G.C. performed medical review of the analysis plan and first interpretable results. J.H. carried out statistical analysis. U.L., R.S.W., W.K., L.A.L., F.J.R., K.K.R., G.G.S., L.C.G., and J.H. drafted the manuscript and performed critical revision. U.L., R.S.W., W.K., L.A.L., F.J.R., K.K.R., G.G.S., L.C.G., and J.H. gave final approval to submit the manuscript and agree to be accountable for all aspects of work ensuring integrity and accuracy.
Funding
This study was funded by Novartis Pharma AG, Basel, Switzerland.
Data availability
The data underlying this article cannot be shared publicly due to the privacy of individuals that participated in each clinical trial. The data will be shared on reasonable request to the corresponding author.
References
Author notes
Conflict of interest: U.L. reports lecture or consultancy honoraria from Amgen, Menarini, Novartis, Sanofi and research support to the institution from Abbott, MSD and Novartis; W.K. reports receiving consulting fees and lecture fees from AstraZeneca, Novartis, and Amgen; consulting fees from Pfizer, The Medicines Company and Novartis, DalCor Pharmaceuticals, Kowa, Corvidia Therapeutics, Esperion, Genentech, OMEICOS, Novo Nordisk, LIB Therapeutics, Daiichi Sankyo; New Amsterdam Pharma and TenSixteen Bio; lecture fees from Berlin-Chemie, Bristol-Myers Squibb, and Sanofi; and grant support and provision of reagents from Singulex, Abbott, Roche Diagnostics, and Dr Beckmann Pharma; L.A.L. reports fees for serving on a steering committee, advisory board fees, and fees for providing CME from Amgen, Eli Lilly, and Novartis; and advisory board fees and fees for CME from HLS, Merck, and Regeneron; F.J.R. reports receiving advisory board fees and lecture fees from Amgen, Sanofi-Aventis, Regeneron Pharmaceuticals, Novartis, Ultragenyx and LIB Therapeutics; K.K.R. reports receiving support from the National Institute for Health Research (NIHR) Imperial Biomedical Research Centre; his institution (Imperial College London) receives support from the NIHR Applied Research Collaboration Northwest London. Prof. Ray also reports receiving lecture fees from Aegerion Pharmaceuticals, Kowa, Cipla, Algorithm, and Zuelling Pharma; grant support paid to his institution, lecture fees, and advisory board fees from Amgen, Regeneron Pharmaceuticals/Sanofi, and Pfizer; lecture fees and fees for serving on steering committees for trials from AstraZeneca and Eli Lilly; fees for serving on steering committees for trials from Cerenis Therapeutics, The Medicines Company, and Esperion; advisory board fees from Akcea Therapeutics, Novartis, Silence Therapeutics, Bayer, and Daiichi Sankyo; lecture fees and advisory board fees from Takeda, Boehringer Ingelheim, and Dr Reddy's Laboratories; grant support and advisory board fees from Merck Sharp & Dohme; fees for serving on a clinical events adjudication committee from AbbVie; and fees for serving as principal investigator for a trial from Resverlogix. G.G.S. reports receiving research support paid to his institution from AstraZeneca, Sanofi, and Silence Therapeutics, and a pending patent (62/806313) on a method for reducing cardiovascular risk assigned in full to the University of Colorado; J.H. reports being employed by Novartis at the time of analysis; L.G.C. reports being employed by Novartis at the time of analysis; R.S.W. reports receiving advisory board fees from Boehringer Ingelheim, Novartis and The Medicines Company.

Comments