


Abstract
The nonalcoholic fatty liver disease fibrosis score (NFS) is comprised of metabolic risk indicators that may accurately predict residual cardiovascular risk in patients with CAD.
This is a nested case control study of the post PCI registry from single tertiary hospital. Among 5589 patients who underwent PCI from 2010 through 2014, previously diagnosed 1510 NAFLD patients and 296 consecutive NAFLD patients who had undergone both PCI and ultrasonography of abdomen within 1 year between the tests were enrolled. (median age, 64y (IQR 55–73)). We applied the NFS to the patients at baseline, using validated NFS cut-offs and 201 patients with higher NFS, defined as NFS >0.67 at PCI, were 1:1 matched with controls, based on propensity scores for higher NFS >0.67.
Higher NFS (NFS >0.67) was more prevalent in patients with left ventricle (LV) dysfuction (LVEF at PCI <40%) than in those without (81.0% vs 33.6%, p<0.001). Baseline higher NFS was significantly associated with LV dysfunction (adjusted OR 1.86, 95% CI 1.36 to 2.55, p<0.001), and baseline higher NFS and persistent higher NFS at 1 year after PCI were independent predictor of a 5-years CV death, after adjustment for LVEF (adjusted HR 1.42, 95% CI 1.03 to 1.95, p=0.023; adjusted HR 1.52, 95% CI 1.08 to 2.64, p=0.033).
With a longitudinal assessment of the association between NAFLD status by NFS and the risk of CV death, we found post-PCI patients with persistent higher NFS were at higher risk of CV death compared with those without.
Multivariable Cox regression models for cardiovascular death
| Models | Adjusted HR (95% CI) | p |
|---|---|---|
| Model 1 | ||
| Age | 1.45 (1.03 to 1.94) | 0.032 |
| Gender | 0.71 (0.47 to 1.07) | 0.104 |
| Diabetes | 1.49 (1.09 to 2.04) | 0.015 |
| Baseline LVEF <40% | 2.20 (1.53 to 3.15) | <0.001 |
| Baseline high NFS >0.67 | 1.86 (1.36 to 2.55) | <0.001 |
| Model 2 | ||
| Age | 1.33 (0.94 to 1.87) | 0.108 |
| Gender | 1.26 (0.90 to 1.76) | 0.175 |
| Diabetes | 1.80 (1.20 to 2.95) | 0.02 |
| LVEF imrpovement >20% after PCI | 0.63 (0.42 to 0.94) | 0.026 |
| Persistent high NFS >0.67 after PCI | 1.52 (1.08 to 2.64) | 0.033 |
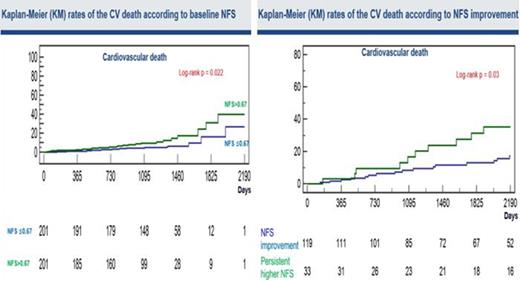
KM rates of CV death according to NFS
Type of funding source: None

