


Abstract
Epicardial fat (EF), the true visceral fat depot of the heart, has been strongly correlated with both coronary artery disease (CAD) incidence and severity. However, the methods for its measurement were not always affordable. Its measurement by echocardiography is fast, accessible and easily reproducible, turning it into a promising clinical tool for assessing cardiovascular risk to predict the incidence of CAD.
To determine the correlation between EF tissue dimensions measured by transthoracic echocardiography and the presence of CAD.
We prospectively analysed data from 196 consecutive patients admitted for acute coronary syndrome in our coronary care unit. All patients underwent diagnostic coronary angiography and echocardiogram during stay. EF dimensions were obtained with transthoracic echocardiography by measuring maximum EF diameter (mm) at the basal right ventricular free wall (PLAXB) level and mid-right ventricular free wall (PLAXM) level [in paraesternal long-axis view (PLAX)] and maximum right-ventricle free wall EF diameter at basal (PSAXB) level and papillary-muscle (PSAXM) level [in paraesternal short-axis view (PSAX)]. All measures were taken at end-systole. Patients were divided in 2 groups according to the presence of significant CAD (sCAD) or not (nCAD), defined as having at least 1 diseased epicardial vessel with a stenosis >50%.
One-hundred and sixty-three (83.2%) had significant CAD. 22 patients (11.2%) were admitted for unstable angina, 60 patients (30.6%) for non-ST elevation myocardial infarction and 93 patients (47,4%) for ST-elevation myocardial infarction. Mean EF diameters were as follows: PLAXB (19,3±5.1 mm), PLAXM (11.3±2.6), PSAXB (10,6±2.8), PSAXM (10.5±2.8). We found a direct correlation between number of diseased epicardial coronary vessels and epicardial fat thickness in PLAXB (r=0.506, p<0.001), PLAXM (r=0.372, p<0.001), PSAXB (r=0.445, p<0.001) and PSAXM (r=0.372, p<0.001). EF was significantly different between groups: PLAXB (20,6±4.4 vs. 13.8±3,8, p<0.001), PLAXM (11.8±2.5 vs. 9.0±1.9, p<0.001), PSAXB (11.1±2.7 vs. 8.3±2.3, p<0.001) and PSAXM (11.0±2.6 vs. 8.2±4, p<0.001). Receiver operating characteristic curve analysis showed that the predictive value of mean right ventricular EF [(PLAXB+PSAXB)/2] for significant CAD was 0.895 (AUC=0.895, CI 95% 0.818–0,972, p<0.001). For a [(PLAXB+PLAXM)/2] value of 12.57 mm, sensitivity was 86.3% and specificity was 79.3%.
In a population of high suspicion of acute coronary syndromes, echocardiographic EF is a sensitive and specific marker of the presence of significant coronary disease and could become an important tool for coronary risk prediction.
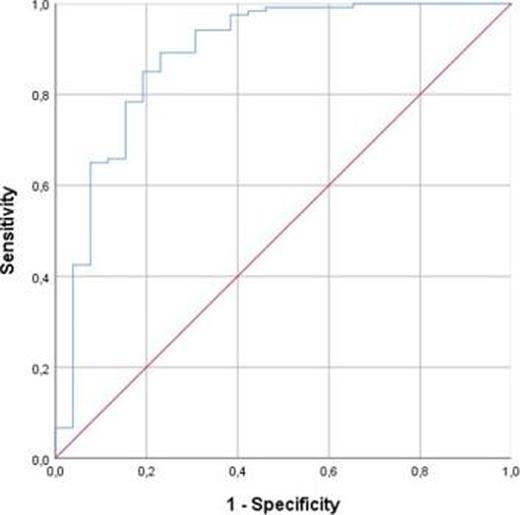
Figure 1
Type of funding source: None

