


Abstract
Physical activity has proven effective in preventing atherosclerotic cardiovascular disease, but its role in preventing degenerative valvular heart disease (VHD) remains uncertain. This study aimed to explore the dose–response association between moderate to vigorous physical activity (MVPA) volume and the risk of degenerative VHD among middle-aged adults.
A full week of accelerometer-derived MVPA data from 87 248 UK Biobank participants (median age 63.3, female: 56.9%) between 2013 and 2015 were used for primary analysis. Questionnaire-derived MVPA data from 361 681 UK Biobank participants (median age 57.7, female: 52.7%) between 2006 and 2010 were used for secondary analysis. The primary outcome was the diagnosis of incident degenerative VHD, including aortic valve stenosis (AS), aortic valve regurgitation (AR), and mitral valve regurgitation (MR). The secondary outcome was VHD-related intervention or mortality.
In the accelerometer-derived MVPA cohort, 555 incident AS, 201 incident AR, and 655 incident MR occurred during a median follow-up of 8.11 years. Increased MVPA volume showed a steady decline in AS risk and subsequent AS-related intervention or mortality risk, levelling off beyond approximately 300 min/week. In contrast, its association with AR or MR incidence was less apparent. The adjusted rates of AS incidence (95% confidence interval) across MVPA quartiles (Q1–Q4) were 11.60 (10.20, 13.20), 7.82 (6.63, 9.23), 5.74 (4.67, 7.08), and 5.91 (4.73, 7.39) per 10 000 person-years. The corresponding adjusted rates of AS-related intervention or mortality were 4.37 (3.52, 5.43), 2.81 (2.13, 3.71), 1.93 (1.36, 2.75), and 2.14 (1.50, 3.06) per 10 000 person-years, respectively. Aortic valve stenosis risk reduction was also observed with questionnaire-based MVPA data [adjusted absolute difference Q4 vs. Q1: AS incidence, −1.41 (−.67, −2.14) per 10 000 person-years; AS-related intervention or mortality, −.38 (−.04, −.88) per 10 000 person-years]. The beneficial association remained consistent in high-risk populations for AS, including patients with hypertension, obesity, dyslipidaemia, and chronic kidney disease.
Higher MVPA volume was associated with a lower risk of developing AS and subsequent AS-related intervention or mortality. Future research needs to validate these findings in diverse populations with longer durations and repeated periods of activity monitoring.
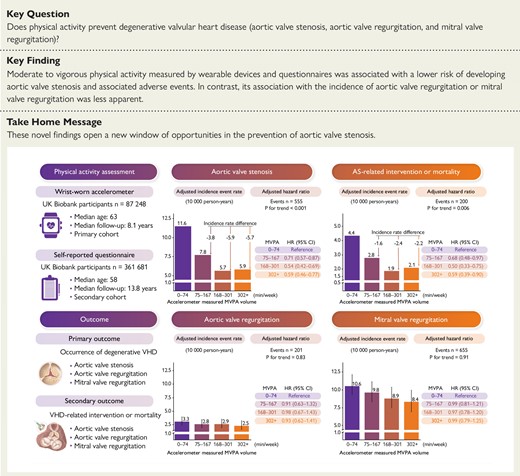
Moderate to vigorous physical activity volume and degenerative valvular heart disease risk. CI, confidence interval; HR, hazard ratio; MVPA, moderate to vigorous physical activity; VHD, valvular heart disease.
Introduction
Degenerative valvular heart disease (VHD) is the predominant form of valvular heart lesions in Western countries, primarily occurring in individuals in their fifth decade and beyond, with aortic valve stenosis (AS) being the most prevailing manifestation.1 The aging population has contributed to a rapid increase in the incidence of degenerative VHD, with AS incidence rate increasing seven-fold over the last three decades.2 Despite the growing epidemic trend and significant disease burden, there are currently no recommended preventive measures effectively thwarting VHD.3
Compelling evidence supports the role of physical activity in the prevention of atherosclerotic cardiovascular disease and related mortality.4,5 A recent meta-analysis involving over 30 million participants from 94 prospective cohorts found that adhering to the World Health Organization (WHO) recommendation of 150 min/week of moderate to vigorous physical activity (MVPA) was associated with a 21% lower risk of coronary heart disease.4 Given the favourable effects of physical activity on metabolic milieu, inflammatory milieu, and heart tissue adaptations, it is reasonable to expect its beneficial impact on valvular tissue as well.6,7 However, limited research has investigated its link to VHD risk, and recent epidemiological studies reported inconsistent findings regarding the association between physical activity and AS risk.8–10 It is important to note that these studies relied on questionnaires to quantify physical activity levels, which may introduce measurement error and recall bias. Therefore, the relationship between physical activity and degenerative VHDs remains incompletely understood.
The WHO Physical Activity Guidelines Panel recently recommended employing wearable devices to assess the relationship between physical activity and disease risk.11 Wearable devices possess objective measurement capabilities and continuous monitoring ability over a prolonged period, making them optimal tools for quantifying and tracking activity levels. Moreover, consumer wearable devices offer a user-friendly way to self-monitor activity levels, with their utilization expected to increase by 25% annually until 2025.12 Thus, in the present study, we utilized accelerometer-measured physical activity data from the UK Biobank to investigate the dose–response association between MVPA and the risk of degenerative VHDs.
Methods
Data sources
The UK Biobank is a prospective cohort study comprising more than 500 000 adults aged 40–69 years recruited from the general population across the UK between 2006 and 2010.13 Ethical approval for the UK Biobank was granted by the North West Multicenter Research Ethics Committee (reference number: 11/NW/0382), and all participants provided written informed consent. This study was conducted based on the UK Biobank cohort study under application number 91035.
Accelerometer-measured physical activity
From 2013 to 2015, a sub-sample of over 100 000 randomly selected participants from the UK Biobank wore accelerometers on their dominant wrist to assess their 7-day physical activity volume (see Supplementary data online, Methods).14 The physical activity intensity was quantified by the average vector magnitude in 5-s epochs, measured in milligravity (mg). The validity of acceleration intensity in estimating energy expenditure has been confirmed against the gold-standard criterion (doubly labelled water technique) with high precision.15 Previous studies computed the volume of MVPA in bouts, defined as 5-min periods where more than 80% of 5-s epochs had an average vector magnitude of ≥100 mg.16–18 Acknowledging that participant activities may not always fit 5-min period increments, we refined the approach to enhance the resolution of MVPA measures. It focuses on capturing activities shorter than 5 min at the end of bouts, where at least 80% of the 5-s epochs per minute exceed 100 mg (see Supplementary data online, Figure S1). This improvement allows for more precise weekly physical activity estimates, raising the median MVPA from 140 min/week [interquartile range (IQR): 60–255] to 167 min/week (IQR: 74–301) (see Supplementary data online, Figure S2). To validate these findings, MVPA time was further estimated using a proven accelerometer-based machine-learning scheme (see Supplementary data online, Methods).19
Questionnaire-based physical activity
Between 2006 and 2010, more than 400 000 UK Biobank participants provided self-reported physical activity data, as well as socio-demographic, lifestyle, and health information during recruitment. The activity data were obtained using the short version of the International Physical Activity Questionnaire, which assesses the weekly duration of engagement in three activity types: light-intensity, moderate-intensity, and vigorous-intensity activities.20,21 The total MVPA volume was computed by summing the durations of moderate-intensity and vigorous-intensity activities.
Assessment of valvular heart disease
The primary outcome was the occurrence of common degenerative VHDs [AS, aortic valve regurgitation (AR), and mitral valve regurgitation (MR)]. Specific incident events related to AS [the International Statistical Classification of Diseases and Related Health Problems 10th Revision (ICD-10) codes, I35.0 and I35.2], AR (ICD-10 codes, I35.1), and MR (ICD-10 codes, I34.0) were extracted from hospital episode records and death registers.22 The diagnostic validity of VHD using ICD-10 codes in national registers demonstrated high accuracy (positive predictive value > 80%), with most cases showing moderate to severe severity.23–26 The secondary outcome was VHD-related events, defined as the composite of VHD-related intervention or VHD-related mortality. Diagnostic and procedural codes for degenerative VHD are shown in Supplementary data online, Table S1. Individuals with a documented diagnosis of VHD at baseline, including rheumatic valve disease, degenerative valve disease (also known as non-rheumatic VHD), congenital valve disease, endocarditis with VHD, and Marfan’s syndrome, were excluded based on records obtained from self-report, primary care, or hospital admission sources.
Study cohorts
Two observational cohorts were formed based on distinct modalities of physical activity assessment: objective evaluation using wrist-worn accelerometers and subjective evaluation through self-reported questionnaires. The primary cohort included 87 248 participants with valid accelerometer-measured physical activity data and no prevalent VHD, heart failure, or cardiomyopathy at baseline (Figure 1; Supplementary data online, Figure S3). The secondary cohort comprised 361 681 participants who met the same exclusion criteria and completed a physical activity questionnaire at recruitment. Detailed inclusion and exclusion criteria were presented in Supplementary data online, Methods. All participants in the primary cohort were followed from the start of accelerometer wear, while in the secondary cohort, they were followed from the date of participant consent to join the UK Biobank. Person-years were calculated from the baseline enrolment until the occurrence of VHD (primary outcome), VHD-related intervention or VHD-related death (secondary outcome), death from other causes, or the end of follow-up on 31 December 2022, whichever came first.
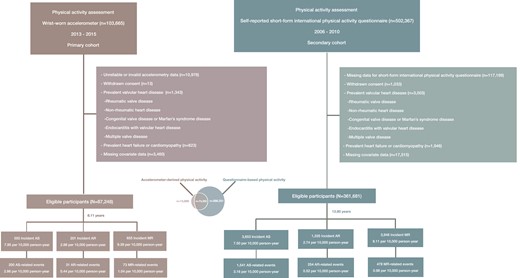
Flowchart of the study. The Venn diagram illustrates the number of individuals who completed either the accelerometer-based physical activity assessment, the questionnaire-based physical activity assessment, or both. AS, aortic valve stenosis; AR, aortic valve regurgitation; MR, mitral valve regurgitation
Covariates
Age was determined based on the date of birth of each participant and the recruitment time of cohorts. Socio-demographic information, such as sex (male or female), ethnicity (White or non-White), Townsend deprivation index, and education level (university degree or not), was collected at baseline. Lifestyle factors, including smoking status (never, former, or current), alcohol intake, diet score, sleep duration, and discretionary screen time, as well as information on medications (lipid-lowering, antihypertensive, anti-diabetic, antithrombotic, and anti-resorptive medication) and supplements (Vitamin D, Vitamin K, and calcium supplement), were collected through standardized touchscreen questionnaires or verbal interviews at visits closer to the accelerometry (see Supplementary data online, Figure S4). Detailed information for covariates was provided in Supplementary data online, Methods and Tables S2–S4.
Statistical analysis
A complete case analysis was conducted as the main analysis. Descriptive characteristics were presented as mean [standard deviation (SD)], median (IQR), or percentage as appropriate. Moderate to vigorous physical activity was categorized based on quartiles and deciles of the MVPA volume. The crude and adjusted incidence rates of outcomes across MVPA groups were estimated using Poisson regression models and reported as the number of events per 10 000 person-years, with time since MVPA measurement as the timescale. Adjusted incidence rate differences and rate ratios within MVPA groups were determined using g-computation with standard parametric regression models.27
To assess the dose–response relationship between MVPA volume and outcomes, we employed restricted cubic splines in Cox proportional hazard models. Age was used as the timescale, with three knots positioned at the 10th, 50th, and 90th percentiles.28 The reference point was set as 0 min/week, equivalent to the 3rd percentile of the accelerometer-derived MVPA volume distribution and the 14th percentile of the questionnaire-based MVPA volume distribution. Adjusted survival curves, based on Cox proportional hazard models, were plotted to depict the cumulative risk across different MVPA groups.29,30 Each subpopulation was balanced for confounding variables through marginal analysis (see Supplementary data online, Methods). Given the high reproducibility of accelerometer-derived physical activity (intraclass correlation coefficients = .70–.90) in repeat assessments over a moderate duration (<5 years),31–35 we estimated the 3-, 4-, and 5-year absolute risk across MVPA groups based on guideline-recommended weekly MVPA volume (0–74, 75–149, and ≥150 min) using Fine and Gray competing risks regression models.36,37
According to the directed acyclic graph (see Supplementary data online, Figure S5), covariates were categorized based on whether they were considered potential mediators in the causal pathway between physical activity and outcomes. Model 1 included age, sex, ethnicity, Townsend index of deprivation, education, smoking status, alcohol intake, diet score, sleep duration, and discretionary screen time, serving as confounders. Model 2 additionally adjusted for clinical comorbidities (hypertension, obesity, Type 2 diabetes, dyslipidaemia, ischaemic heart disease, atrial fibrillation, chronic obstructive pulmonary disease, chronic kidney disease, osteoporosis, and chronic inflammatory diseases such as psoriasis, systemic lupus erythematosus, and rheumatoid arthritis), medications (lipid-lowering, antihypertensive, anti-diabetic, antithrombotic, and anti-resorptive medication), and supplements (Vitamin D, Vitamin K, and calcium supplement), which were considered potential mediators in the causal pathway. To avoid potential over-adjustment for variables that could mediate associations between physical activity and VHD, Model 1 was conducted as the primary analysis, and Model 2 was conducted as the sensitivity analysis.38,39 Detailed information on variable selection was presented in Supplementary data online, Methods and Tables S5 and S6.
Furthermore, we conducted an exploratory analysis to investigate various MVPA volume trajectories with outcomes. This analysis included participants who completed a questionnaire-based physical activity assessment from 2006 to 2010 and an accelerometer-based assessment from 2013 to 2015 (n = 73 350), with a median duration of 5.65 years between the two assessments. Physical activity volume was categorized according to the guidelines as low (0–74 min of MVPA), intermediate (75–149 min of MVPA), and high (150+ min of MVPA). We then classified changes in physical activity volume into five categories: stable low (both assessments within the low range), stable intermediate (both within the intermediate range), stable high (both within the high range), improving (moving from a lower to a higher category), and declining (moving from a higher to a lower category).
Subgroup analyses and a series of sensitivity analyses were conducted. Firstly, covariates from Model 2 were further adjusted to assess the robustness of our results. Secondly, we employed the Fine and Gray competing risks regression model, treating death due to other causes as competing risks. Thirdly, to address potential reverse causality bias, individuals who experienced an incident VHD event within the initial 2 years of follow-up were excluded from the analysis. Fourthly, participants with atrial fibrillation, ischaemic heart disease, and chronic kidney disease at baseline were excluded to mitigate the influence of these risk factors on VHD development. Fifthly, MVPA volume was further estimated using a proven machine-learning scheme to validate our findings.19 Finally, missing covariate values were imputed using multiple imputation by chained equations (see Supplementary data online, Methods and Tables S7–S9). All analyses were performed using R version 4.2.2. A Bonferroni-corrected significance level of P < .017 (.05/3) was used to adjust for multiple testing of three VHD outcomes.
Results
In the primary cohort of 87 248 individuals [median age (IQR): 63.31 (56.16, 68.45) years; female: 56.9%], there were 555 incident AS, 201 incident AR, and 655 incident MR, along with 200 AS-related events, 31 AR-related events, and 73 MR-related events occurred during a median follow-up of 8.11 years (Figure 1). In the secondary cohort of 361 681 individuals [median age (IQR): 57.71 (50.06, 63.29) years; female: 52.7%], there were 3653 incident AS, 1335 incident AR, and 3948 incident MR, along with 1541 AS-related events, 254 AR-related events, and 478 MR-related events observed during a median follow-up of 13.80 years (Figure 1).
Sample characteristics
The median accelerometer-derived MVPA volume was 167 (IQR: 74–301) min/week, with 54.19% of individuals meeting the guideline-recommended volume. Similarly, the median questionnaire-based MVPA volume was 180 (IQR: 60–405) min/week, with 55.99% of individuals meeting the guideline-recommended volume. Participants with higher MVPA volume, as measured by accelerometers, tended to be younger, have a higher educational level, lower body mass index, and blood pressure levels. They were also less likely to smoke, reported better diet quality, and had fewer clinical comorbidities and medication usage (Table 1). These trends were less apparent in the questionnaire-based MVPA cohort (see Supplementary data online, Table S10).
Baseline characteristics by quartiles of moderate to vigorous physical activity volume groups
| Total | Accelerometer-derived moderate to vigorous physical activity (min/week) | ||||
|---|---|---|---|---|---|
| Quartile 1 (0–74 min/week) | Quartile 2 (75–167 min/week) | Quartile 3 (168–301 min/week) | Quartile 4 (302–2903 min/week) | ||
| n | 87 248 | 21 834 | 21 955 | 21 696 | 21 763 |
| Age, years, median [IQR] | 63.31 [56.16, 68.45] | 66.21 [59.67, 70.45] | 64.07 [56.85, 68.85] | 62.38 [55.38, 67.66] | 60.51 [53.76, 66.32] |
| Sex, n (%) | |||||
| Women | 49 638 (56.89) | 13 347 (61.13) | 12 763 (58.13) | 12 068 (55.62) | 11 460 (52.66) |
| Men | 37 610 (43.11) | 8487 (38.87) | 9192 (41.87) | 9628 (44.38) | 10 303 (47.34) |
| Ethnicity, n (%) | |||||
| White | 84 710 (97.09) | 21 240 (97.28) | 21 297 (97.00) | 21 036 (96.96) | 21 137 (97.12) |
| Black | 687 (.79) | 168 (.77) | 179 (.82) | 183 (.84) | 157 (.72) |
| Asian | 944 (1.08) | 246(1.12) | 274 (1.24) | 221(1.02) | 203(.93) |
| Mixed | 465 (.53) | 98 (.45) | 103 (.47) | 125 (.58) | 139 (.64) |
| Other | 442 (.51) | 82 (.38) | 102 (.46) | 131 (.60) | 127 (.58) |
| Townsend deprivation index, median [IQR] | −2.47 [−3.83, −.22] | −2.53 [−3.84, −.39] | −2.56 [−3.87, −.41] | −2.44 [−3.83, −.15] | −2.32 [−3.76, .07] |
| University education degree, n (%) | 38 218 (43.80) | 7666 (35.11) | 9202 (41.91) | 10 300 (47.47) | 11 050 (50.77) |
| Smoking status, n (%) | |||||
| Never | 50 526 (57.91) | 11 609 (53.17) | 12 749 (58.07) | 12 995 (59.90) | 13 173 (60.53) |
| Previous | 31 435 (36.03) | 8370 (38.33) | 7865 (35.82) | 7607 (35.06) | 7593 (34.89) |
| Current | 5287 (6.06) | 1855 (8.50) | 1341 (6.11) | 1094 (5.04) | 997 (4.58) |
| Alcohol intake, grams/day, median [IQR] | 12.11 [2.63, 24.11] | 9.60 [.80, 21.83] | 11.66 [2.56, 23.66] | 13.03 [3.87, 25.26] | 13.83 [4.34, 26.29] |
| Diet score, n (%) | |||||
| 0 | 10 535 (12.07) | 2822 (12.92) | 2767 (12.60) | 2564 (11.82) | 2382 (10.95) |
| 1 | 31 919 (36.58) | 8232 (37.70) | 8040 (36.62) | 7895 (36.39) | 7752 (35.62) |
| 2 | 31 413 (36.00) | 7618 (34.89) | 7909 (36.02) | 7873 (36.29) | 8013 (36.82) |
| 3 | 13 381 (15.34) | 3162 (14.48) | 3239 (14.75) | 3364 (15.51) | 3616 (16.62) |
| Sleep duration, h/day, median [IQR] | 7.00 [7.00, 8.00] | 7.00 [7.00, 8.00] | 7.00 [7.00, 8.00] | 7.00 [7.00, 8.00] | 7.00 [7.00, 8.00] |
| Discretionary screen time, h/day, median [IQR] | 3.50 [2.50, 5.00] | 4.00 [3.00, 5.00] | 3.50 [2.50, 5.00] | 3.00 [2.50, 4.50] | 3.00 [2.00, 4.00] |
| Comorbidities, n (%) | |||||
| Hypertension, n (%) | 22 852 (26.19) | 8052 (36.88) | 5952 (27.11) | 4828 (22.25) | 4020 (18.47) |
| Obesity, n (%) | 3296 (3.78) | 1561 (7.15) | 798 (3.63) | 563 (2.59) | 374 (1.72) |
| Type 2 diabetes, n (%) | 2778 (3.18) | 1453 (6.65) | 610 (2.78) | 443 (2.04) | 272 (1.25) |
| Dyslipidaemia, n (%) | 13 767 (15.78) | 4867 (22.29) | 3606 (16.42) | 2958 (13.63) | 2336 (10.73) |
| Ischaemic heart disease, n (%) | 4332 (4.97) | 1765 (8.08) | 1137 (5.18) | 812 (3.74) | 618 (2.84) |
| Stroke, n (%) | 1186 (1.36) | 481 (2.20) | 305 (1.39) | 224 (1.03) | 176 (.81) |
| Peripheral arterial disease, n (%) | 1133 (1.30) | 381 (1.74) | 248 (1.13) | 252 (1.16) | 252 (1.16) |
| Atrial fibrillation, n (%) | 1986 (2.28) | 763 (3.49) | 536 (2.44) | 353 (1.63) | 334 (1.53) |
| Chronic kidney disease, n (%) | 1535 (1.76) | 675 (3.09) | 362 (1.65) | 306 (1.41) | 192 (.88) |
| Chronic obstructive pulmonary disease, n (%) | 1561 (1.79) | 738 (3.38) | 341 (1.55) | 268 (1.24) | 214 (.98) |
| Osteoporosis, n (%) | 2355 (2.70) | 792 (3.63) | 611 (2.78) | 497 (2.29) | 455 (2.09) |
| Chronic inflammatory disease, n (%) | 3367 (3.86) | 1144 (5.24) | 809 (3.68) | 754 (3.48) | 660 (3.03) |
| Psoriasis, n (%) | 2219 (2.54) | 661 (3.03) | 551 (2.51) | 526 (2.42) | 481 (2.21) |
| Systemic lupus erythematosus, n (%) | 123 (.14) | 42 (.19) | 29 (.13) | 29 (.13) | 23 (.11) |
| Rheumatoid arthritis, n (%) | 1102 (1.26) | 475 (2.18) | 245 (1.12) | 215 (.99) | 167 (.77) |
| Cancer, n (%) | 12 375 (14.18) | 3849 (17.63) | 3185 (14.51) | 2824 (13.02) | 2517 (11.57) |
| Physical measures and biomarkers | |||||
| Systolic blood pressure, mmHg, mean (SD) | 137.59 (18.54) | 139.93 (18.60) | 138.07 (18.49) | 136.83 (18.49) | 135.53 (18.28) |
| Diastolic blood pressure, mmHg, mean (SD) | 81.10 (10.10) | 81.98 (10.14) | 81.32 (10.07) | 80.87 (10.09) | 80.21 (10.01) |
| Body mass index, kg/m2, mean (SD) | 26.65 (4.55) | 28.57 (5.33) | 26.89 (4.35) | 26.01 (3.95) | 25.13 (3.67) |
| C reactive protein, mg/L, median [IQR] | 1.13 [.57, 2.34] | 1.59 [.81, 3.28] | 1.21 [.63, 2.46] | 1.01 [.53, 2.02] | .85 [.45, 1.72] |
| eGFR, mL/min/1.73m2, median [IQR] | 97.30 [87.39, 103.59] | 95.63 [84.75, 101.67] | 96.64 [86.70, 103.04] | 97.85 [88.18, 104.04] | 99.22 [90.14, 105.35] |
| LDL direct, mmol/L, mean (SD) | 3.58 (.85) | 3.58 (.89) | 3.61 (.86) | 3.58 (.83) | 3.54 (.81) |
| Lipoprotein(a), nmol/L, median [IQR] | 20.30 [9.41, 60.60] | 20.20 [9.39, 61.10] | 20.32 [9.50, 59.50] | 20.30 [9.47, 60.40] | 20.40 [9.40, 61.20] |
| HDL, mmol/L, mean (SD) | 1.50 (.39) | 1.43 (.38) | 1.48 (.38) | 1.52 (.38) | 1.56 (.39) |
| Triglycerides, mmol/L, median [IQR] | 1.41 [1.00, 2.03] | 1.58 [1.12, 2.26] | 1.45 [1.04, 2.08] | 1.35 [.98, 1.94] | 1.26 [.91, 1.82] |
| HbA1c, mmol/mol, mean (SD) | 35.38 (5.52) | 36.65 (6.93) | 35.37 (5.32) | 34.93 (4.82) | 34.56 (4.43) |
| Serum calcium, mmol/L, mean (SD) | 2.38 (.09) | 2.39 (.09) | 2.38 (.09) | 2.38 (.09) | 2.38 (.09) |
| Serum phosphate, mmol/L, mean (SD) | 1.17 (.16) | 1.16 (.16) | 1.17 (.16) | 1.17 (.16) | 1.17 (.16) |
| Medications and supplements, n (%) | |||||
| Lipid-lowering medication, n (%) | 14 961 (17.15) | 5433 (24.88) | 3971 (18.09) | 3136 (14.45) | 2421 (11.12) |
| Antihypertensive medication, n (%) | 17 802 (20.40) | 6717 (30.76) | 4675 (21.29) | 3597 (16.58) | 2813 (12.93) |
| Anti-diabetic medication, n (%) | 2290 (2.62) | 1171 (5.36) | 495 (2.25) | 362 (1.67) | 262 (1.20) |
| Antithrombotic medication, n (%) | 10 788 (12.36) | 3873 (17.74) | 2788 (12.70) | 2225 (10.26) | 1902 (8.74) |
| Anti-resorptive medication, n (%) | 1480 (1.70) | 489 (2.24) | 386 (1.76) | 323 (1.49) | 282 (1.30) |
| Vitamin D/Vitamin K supplement, n (%) | 7584 (8.69) | 1863 (8.53) | 1949 (8.88) | 1907 (8.79) | 1865 (8.57) |
| Calcium supplement, n (%) | 6835 (7.83) | 1892 (8.67) | 1753 (7.98) | 1693 (7.80) | 1497 (6.88) |
| Physical activity measurement | |||||
| Average accelerationa, milligravity, median [IQR] | 27.28 [22.64, 32.71] | 21.67 [18.28, 25.07] | 25.58 [22.27, 29.13] | 28.89 [25.13, 32.80] | 35.28 [30.47, 40.65] |
| Wear duration, days, median [IQR] | 6.93 [6.73, 7.00] | 6.91 [6.66, 7.00] | 6.92 [6.73, 7.00] | 6.93 [6.75, 7.00] | 6.94 [6.77, 7.00] |
| MVPA, min/week, median [IQR] | 167.00 [74.00, 301.00] | 34.00 [14.00, 55.00] | 118.00 [96.00, 142.00] | 225.00 [195.00, 260.00] | 425.00 [355.00, 549.00] |
| Self-reported MVPA, min/week, median [IQR] | 180.00 [60.00, 405.00] | 130.00 [30.00, 360.00] | 160.00 [55.00, 362.50] | 180.00 [60.00, 400.00] | 240.00 [90.00, 480.00] |
| Self-reported MPA, min/week, median [IQR] | 120.00 [30.00, 280.00] | 90.00 [20.00, 240.00] | 100.00 [30.00, 270.00] | 120.00 [40.00, 270.00] | 135.00 [50.00, 300.00] |
| Self-reported VPA, min/week, median [IQR] | 30.00 [.00, 120.00] | 10.00 [.00, 60.00] | 30.00 [.00, 90.00] | 40.00 [.00, 120.00] | 60.00 [.00, 180.00] |
eGFR, estimated glomerular filtration rate; HbA1c, glycated haemoglobin; HDL, high-density lipoprotein; IQR, interquartile range; LDL, low-density lipoprotein; MPA, moderate-intensity physical activity; MVPA, moderate to vigorous physical activity; SD, standard deviation; VPA, vigorous-intensity physical activity.
aNo wear time bias adjusted.
Risk of aortic valve stenosis and related events
Accelerometer-measured MVPA showed non-linear associations with the risk of AS and AS-related intervention or mortality (Figure 2). Risk reduction was evident with higher levels of physical activity, levelling off beyond 300 min/week. Similarly, questionnaire-based MVPA also exhibited consistent directional associations with AS and AS-related events (see Supplementary data online, Figure S6).
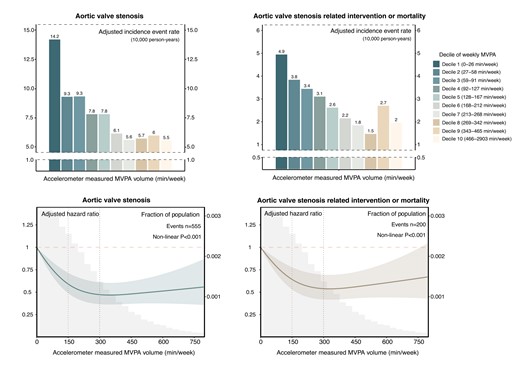
Dose–response relationship between moderate to vigorous physical activity volume and risk of aortic valve stenosis and related events. Upper panel: Absolute risk of aortic valve stenosis and related events across deciles of moderate to vigorous physical activity volume groups. The adjusted incidence rate, reported as per 10 000 person-years, was estimated using Poisson regression models with time since MVPA measurement as the timescale. Adjustments were made for age, sex, ethnicity, Townsend deprivation index, education, smoking status, alcohol intake, diet quality, sleep duration, and discretionary screen time. Lower panel: Relative risk of aortic valve stenosis and related events. The adjusted hazard ratio was estimated using Cox proportional hazard models with age as the timescale. Adjustments were made for sex, ethnicity, Townsend deprivation index, education, smoking status, alcohol intake, diet quality, sleep duration, and discretionary screen time. The solid line represents the adjusted hazard ratio, with the ribbon indicating the 95% confidence interval. The grey area denotes the proportion of the population (units: 30 min/week). MVPA, moderate to vigorous physical activity.
In the primary cohort, the overall incidence rates of AS and AS-related intervention or mortality were 7.95 [95% confidence interval (CI): 7.31, 8.64] and 2.86 (95% CI: 2.48, 3.29) per 10 000 person-years, respectively (Table 2). The adjusted incidence rates of AS across MVPA quartiles were 11.60 (95% CI: 10.20, 13.20), 7.82 (95% CI: 6.63, 9.23), 5.74 (95% CI: 4.67, 7.08), and 5.91 (95% CI: 4.73, 7.39) per 10 000 person-years. The corresponding adjusted incidence rates of AS-related intervention and mortality were 4.37 (95% CI: 3.52, 5.43), 2.81 (95% CI: 2.13, 3.71), 1.93 (95% CI: 1.36, 2.75), and 2.14 (95% CI: 1.50, 3.06) per 10 000 person-years. Compared with the lowest quartile of the MVPA group (Q1: 0–74 min/week), individuals in the second (Q2: 75–167 min/week), third (Q3: 168–301 min/week), and fourth quartile (Q4: ≥302 min/week) of the MVPA group showed decreasing adjusted absolute risks of 3.78 (95% CI: 1.71, 5.86), 5.85 (95% CI: 3.84, 7.82), and 5.69 (95% CI: 3.59, 7.55) AS events per 10 000 person-years and 1.56 (95% CI: .25, 2.80), 2.44 (95% CI: 1.28, 3.65), and 2.23 (95% CI: .97, 3.56) AS-related intervention or death events per 10 000 person-years, respectively. The corresponding adjusted hazard ratios for AS incidence and AS-related intervention or mortality were .71 (95% CI: .57, .87) and .68 (95% CI: .48, .97) for Q2, .54 (95% CI: .42, .69) and .50 (95% CI: .33,.75) for Q3, .59 (95% CI: .46, .77) and .59 (95% CI: .39, .90) for Q4, respectively (Figure 3). Similar findings were observed in questionnaire-based MVPA with a smaller effect size (see Supplementary data online, Table S11 and Figure S7).
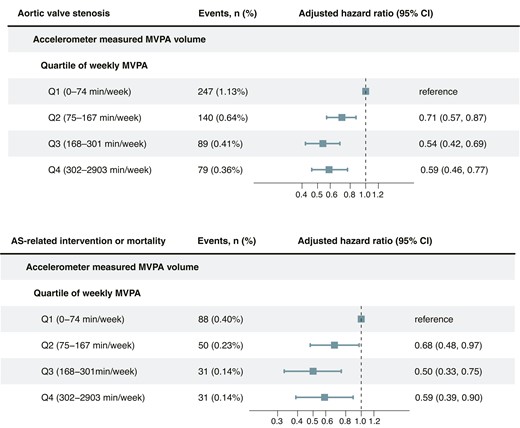
Adjusted hazard ratio for aortic valve stenosis and related events by quartiles of moderate to vigorous physical activity volume. The adjusted hazard ratio was estimated using Cox proportional hazard models, with age as the timescale. Adjustments were made for sex, ethnicity, Townsend index of deprivation, education, smoking status, alcohol intake, diet score, sleep duration, and discretionary screen time. AS, aortic valve stenosis; CI, confidence interval; MVPA: moderate to vigorous physical activity.
Incidence event rate, incidence rate difference, and incidence rate ratio of aortic valve stenosis by quartiles of accelerometer-derived moderate to vigorous physical activity volume groups
| Accelerometer-derived MVPA cohort | ||||||
|---|---|---|---|---|---|---|
| Total | Q1 (0–74 min/week) | Q2 (75–167 min/week) | Q3 (168–301 min/week) | Q4 (302–2903 min/week) | ||
| AS | Event, n | 555 | 247 | 140 | 89 | 79 |
| Incidence event ratea | 7.95 (7.31,8.64) | 14.39 (12.65, 16.29) | 7.97 (6.70, 9.40) | 5.10 (4.10, 6.28) | 4.49 (3.56, 5.60) | |
| Adjusted incidence event ratea,b | 11.60 (10.20, 13.20) | 7.82 (6.63, 9.23) | 5.74 (4.67, 7.08) | 5.91 (4.73, 7.39) | ||
| Adjusted incidence rate differencea,b | Ref. | −3.78 (−1.71, −5.86) | −5.85 (−3.84, −7.82) | −5.69 (−3.59, −7.55) | ||
| Adjusted incidence rate ratiob | Ref. | .67 (.54, .84) | .50 (.39, .63) | .51 (.40, .67) | ||
| AS-related intervention or mortality | Event, n | 200 | 88 | 50 | 31 | 31 |
| Incidence event ratea | 2.86 (2.48, 3.29) | 5.11 (4.10, 6.29) | 2.84 (2.11, 3.75) | 1.77 (1.21, 2.52) | 1.76 (1.20, 2.50) | |
| Adjusted incidence event ratea,b | 4.37 (3.52, 5.43) | 2.81 (2.13, 3.71) | 1.93 (1.36, 2.75) | 2.14 (1.50, 3.06) | ||
| Adjusted incidence rate differencea,b | Ref. | −1.56 (−.25, −2.80) | −2.44 (−1.28, −3.65) | −2.23 (−.97, −3.56) | ||
| Adjusted incidence rate ratiob | Ref. | .64 (.47, .93) | .44 (.29, .67) | .49 (.32, .73) | ||
Adjusted incidence rate difference and adjusted incidence rate ratio in bold represent statistical significance. AS, aortic valve stenosis; MVPA, moderate to vigorous physical activity.
aPer 10 000 person-years (95% confidence interval).
bAdjusted for age, sex, ethnicity, Townsend deprivation index, education, smoking status, alcohol intake, diet score, sleep duration, and discretionary screen time.
Adjusted survival curves, categorized by quartiles of MVPA volume, are displayed in Figure 4. The adjusted 3-, 4-, and 5-year risks of AS and AS-related intervention or mortality are depicted in Figure 5 and Supplementary data online, Figures S8 and S9. Higher levels of MVPA volume were associated with a lower 5-year absolute risk of AS and AS-related events in both men and women. For instance, among men and women aged 70–79, the 5-year risk of AS was 1.71% and .90% for MVPA volume with 0–74 min/week, 1.21% and .52% for MVPA volume with 75–149 min/week, and .67% and .27% for MVPA volume with ≥150 min/week, respectively. Corresponding values for 5-year risk of AS-related intervention or mortality were .67% and .27%, .46% and .16%, and .23% and .04%, respectively.
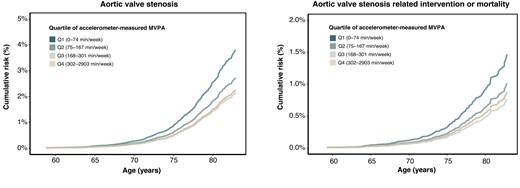
Adjusted survival curves for the risk of aortic valve stenosis and related events across quartiles of moderate to vigorous physical activity volume. Adjusted survival curves were estimated using Cox proportional hazard models, with age as the timescale. Adjustments were made for sex, ethnicity, Townsend index of deprivation, education, smoking status, alcohol intake, diet score, sleep duration, and discretionary screen time. MVPA, moderate to vigorous physical activity.
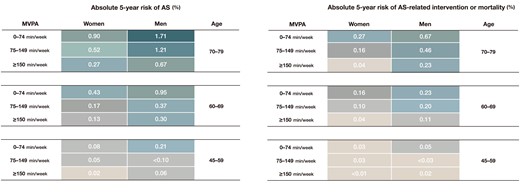
The 5-year absolute risk of aortic valve stenosis and related events. The 5-year absolute risk of aortic valve stenosis and related events in the primary cohort was estimated using Fine and Gray competing risks regression models. Cells containing ‘<’ indicate an insufficient number of participants for cumulative incidence estimation. AS, aortic valve stenosis; MVPA, moderate to vigorous physical activity.
Individuals who consistently maintained a high volume of MVPA (≥150 min/week) during both questionnaire and accelerometer assessments had the lowest 5-year absolute risk of AS incidence and AS-related intervention or mortality, with rates of .18% and .06%, respectively (see Supplementary data online, Figure S10). In contrast, those with a consistently low MVPA volume (0–74 min/week) faced the highest corresponding risks, with rates of .79% and .25%. Participants who increased their MVPA levels (identified as the improving MVPA volume group) exhibited a risk profile similar to those in the stable high MVPA volume group (AS incidence: .17% vs. .18%; AS-related intervention: .06% vs. .06%) and had a lower risk profile compared with individuals whose activity levels decreased (declining MVPA volume group) (AS incidence: .17% vs. .48%; AS-related intervention: .06% vs. .17%).
Risk of aortic regurgitation, mitral regurgitation, and related events
The dose–response associations between accelerometer-measured MVPA volume and the risk of AR and MR, along with related events, were less apparent (Figure 6; Supplementary data online, Figures S11 and S12). Although trends in incidence rates suggested a potential decrease in the risk of AR and MR across quartiles of the MVPA volume groups, significant group differences were not observed (see Supplementary data online, Tables S12 and S13 and Figure S13). Due to the smaller event size for AR and MR-related interventions and deaths in the primary cohort (AR: n = 31; MR: n = 73), further assessment was conducted on the associations between questionnaire-based MVPA volume and the risk of AR and MR-related events, revealing no discernible trend (P-trend for AR-related events: .15; P-trend for MR-related events: .22) (see Supplementary data online, Figure S14).
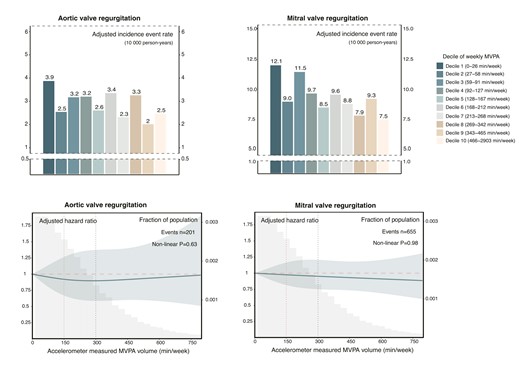
Dose–response relationship between moderate to vigorous physical activity volume and risk of aortic valve regurgitation and mitral valve regurgitation. Upper panel: Absolute risk of aortic valve regurgitation and mitral valve regurgitation across deciles of moderate to vigorous physical activity volume groups. The adjusted incidence rate, reported as per 10 000 person-years, was estimated using Poisson regression models with time since MVPA measurement as the timescale. Adjustments were made for age, sex, ethnicity, Townsend deprivation index, education, smoking status, alcohol intake, diet quality, sleep duration, and discretionary screen time. Lower panel: Relative risk of aortic valve regurgitation and mitral valve regurgitation. The adjusted hazard ratio was estimated using Cox proportional hazard models, with age as the timescale. Adjustments were made for sex, ethnicity, Townsend deprivation index, education, smoking status, alcohol intake, diet quality, sleep duration, and discretionary screen time. The solid line represents the adjusted hazard ratio, with the ribbon indicating the 95% confidence interval. The grey area denotes the proportion of the population (units: 30 min/week). MVPA, moderate to vigorous physical activity.
Subgroup analysis and sensitivity analysis
The inverse association between MVPA volume and risk of AS and AS-related events remained consistent across various subgroups, including age (<65 and ≥65), sex (male and female), educational background (university degree or not), smoking status (never, current, or previous), alcohol intake (<median and ≥median), diet score (0–1 and 2–3), systolic blood pressure (<140 and ≥140 mmHg), body mass index (<30 and ≥30 kg/m2), low-density lipoprotein-cholesterol (<3.4 and ≥3.4 mmol/L), triglycerides (<1.7 and ≥1.7 mmol/L), estimated glomerular filtration rate(eGFR) (<90 and ≥90), and C-reactive protein (<2 and ≥2 mg/L) (see Supplementary data online, Table S14).
The main results remained robust across various sensitivity analyses. Additional covariate adjustment (see Supplementary data online, Figures S15 and S16 and Table S15), accounting for competing risks from other causes of death (see Supplementary data online, Figures S17 and S18), excluding participants who had a VHD event within 2 years of follow-up (see Supplementary data online, Figures S19 and S20), excluding participants with atrial fibrillation, ischaemic heart disease, and chronic kidney disease at baseline (see Supplementary data online, Figures S21 and S22), or employing a validated machine-learning approach for MVPA estimation (see Supplementary data online, Figures S23 and S24 and Table S16) resulted in slightly attenuated associations. Analysing the total case sample, comprising 90 708 individuals in the primary cohort and 379 196 individuals in the secondary cohort, consistently revealed an inverse association between MVPA volume and AS risk (see Supplementary data online, Figures S25–S27).
Discussion
This large-scale prospective study provides novel insights into the relationship between physical activity and the risks of degenerative VHDs among middle-aged individuals (Structured Graphical Abstract). We observed a robust non-linear association between MVPA volume and risk of AS, as well as AS-related intervention or mortality. Our findings highlight the significance of every minute of physical activity in preventing AS, even when activity levels fall below the recommended 150 min/week. The inverse association persisted across high-risk groups for AS, including the elderly and individuals with conditions like hypertension, obesity, dyslipidaemia, and chronic kidney disease, suggesting that targeted physical activity in the early stages of the disease could effectively alleviate healthcare burdens. However, the association between MVPA and the incidence of AR or MR was less apparent, indicating distinct underlying mechanisms for valvular stenosis and regurgitation lesions.
Distinct modalities of physical activity assessment
Recent epidemiological studies revealed that favourable cardiovascular health is associated with a lower prevalence and incidence of AS.10,40,41 However, the role of physical activity, a cornerstone of cardiovascular health, in preventing AS remains uncertain. Researchers in the Multi-Ethnic Study of Atherosclerosis discovered that optimal levels of physical activity were linked to a 30% lower risk of incident aortic valve calcification,10 while findings from the Trøndelag Health Study (HUNT) indicated that cardiorespiratory fitness, rather than physical activity levels, was associated with a decreased risk of AS-related clinical events.42 It is worth noting that these studies relied on questionnaires to quantify physical activity, which may introduce recall bias and potential misclassification. Recent research has indicated that activity levels measured with accelerometers may produce divergent outcomes compared with questionnaire-based assessments within the same population.16,17 Depending solely on self-reported measures, which lack established validity and reliability, may lead to inconsistencies and false-negative findings in epidemiological studies.43 The differences in our findings compared with previous studies may be attributed to the diverse quantification approaches used to evaluate physical activity, as well as potential discrepancies in the methodologies employed for questionnaire-based assessments of activity levels.
Underlying mechanisms of aortic valve stenosis risk with physical activity
Our findings were consistent with recent laboratory studies showing that regular exercise prevented aortic valve sclerosis in low-density lipoprotein–receptor–deficient mice.44 This protection was attributed to maintaining endothelial cell integrity and reducing oxidative stress. Exercise may contribute to maintaining valvular tissue homoeostasis during the initiation phase of AS pathogenesis by modifying blood flow, shear stress, and tensile stress on the aortic side,45 increasing valvular endothelial cell-derived nitric oxide bioavailability,46 restraining the formation of oxidized lipoproteins and advanced glycated end-products,7 and reducing tissue expression of pro-inflammatory cytokines.47 Besides, exercise may prevent microcalcification deposition and regulate systematic mineral metabolism in the propagation phase of AS pathogenesis through inhibiting receptor activator of nuclear factor-kB ligand-induced osteoclastogenesis.48 A wealth of research evidence has confirmed that exercise can prevent relevant clinical comorbidities known to pose a higher risk of AS, such as hypertension, dyslipidaemia, obesity, Type 2 diabetes, chronic kidney disease, osteoporosis, and chronic inflammatory diseases.49–52 In our study, higher levels of MVPA were linked to lower levels of biomarkers and fewer clinical comorbidities in relevant pathobiology pathways. Notably, the inverse association between MVPA and AS risk persisted even after adjusting for potential mediators, suggesting that the benefits of exercise on AS health may extend beyond traditional risk factors. Furthermore, exercise may reduce angiotensin II accumulation in the heart, reversing valve obstruction-induced myocardial fibrosis and ventricular dysfunction,53,54 which may explain its association with a lower incidence of AS-related intervention or mortality in our study. Further research is warranted to gain a better understanding of the potential pathways involved.
Differential impact of physical activity on the risk of valvular stenosis and regurgitation
The differing impact of physical activity on valvular stenosis and regurgitation risks may be attributed to varying levels of calcification in different types of VHDs. Valvular calcification, a hallmark of ‘systemic atherosclerosis’, shares cardiometabolic risk factors with vascular calcifications.55 Aortic valve calcification is known to be a leading cause of AS,56 and evidence shows that regular exercise can mitigate valvular calcification,10,44 thereby reducing the risk of developing AS and related adverse events. In contrast, calcification is less prevalent in isolated organic AR (17%) and MR (12%).57,58 Degenerative AR and MR may not be strongly associated with lipid metabolism, chronic inflammation, or calcium and phosphate balance, indicating limited modifiable risk factors.59,60 The variation in valvular calcification and associated risk factors may be due to different aetiologies: AS is mainly due to osteoblastic-driven bone formation in valvular interstitial cells, while AR typically arises from cusp prolapse due to aortic medial degeneration58; MR primarily occurs from mitral valve prolapse, characterized by fibro-myxomatous alterations in the leaflets.61 Therefore, compared with its impact on AS pathogenesis and relevant risk factors, physical activity may offer a limited contribution to the prevention of regurgitation lesions. Our exploratory analysis revealed a trend towards lower AR risk, when accompanied by AS, in physically active individuals compared with those with isolated AR (see Supplementary data online, Figure S28). The observed similarity in calcification patterns between combined AR and AS and those in pure AS suggests that calcification predominantly drives stenosis and the subsequent development of regurgitation.62 Thus, the extent of calcification may mediate the impact of physical activity on the risk of developing degenerative VHD, explaining the varied effects on stenosis and regurgitation.
Clinical implications
Currently, there is a lack of pharmacological treatments for AS. While aortic valve replacement (AVR) has improved clinical outcomes for severe AS patients, it remains a conventional therapeutic paradigm initiated at the late stages of the disease. Alarmingly, more than 40% of severe AS patients either do not promptly receive AVR or are ineligible for AVR procedures.63,64 Therefore, early initiation of disease management is crucial for high-risk AS individuals. Our study provides novel insights into the potential role of activity levels in reducing AS risk. Adhering to the guideline-recommended MVPA duration (above 150 min/week) may be feasible for middle-aged individuals. The rising popularity of smart wearable devices has revolutionized physical activity monitoring, offering valuable insights for tailored prevention approaches.
Current guidelines advocate regular exercise as a fundamental aspect of primary, secondary, and tertiary cardiovascular disease prevention.36,37 Recent studies on tertiary prevention have shown that higher levels of habitual physical activity are linked to reduced 12-month mortality and functional decline in older adults undergoing transcatheter AVR.65,66 Integrating these findings with our primary prevention results, future research could explore the potential of regular exercise as a secondary prevention strategy for AS. This could involve investigating whether regular physical activity could delay disease progression in individuals with early-stage conditions like aortic valve sclerosis or mild-to-moderate stenosis. Given the absence of effective medical treatments to halt or slow down the progression of aortic valve sclerosis, identifying physical activity as a potential non-pharmaceutical intervention could be advantageous in altering the natural course of the disease.
Limitations
However, several factors should be considered when interpreting our findings. First, the accelerometer data were collected over a single 7-day period at baseline, which may not fully capture long-term habitual physical activity patterns due to possible changes in routines during that specific measurement week. Additionally, the progression from no aortic valve sclerosis to clinical AS can span nearly a decade; thus, relying on a single time-point measurement, whether from accelerometers or questionnaires, limits our ability to capture the variability in MVPA volume over time. Despite this, previous studies have shown high consistency in physical activity measurements (intraclass correlation coefficients between .76 and .90) across repeated assessments with wearable devices from two months to four years,31–35 and 64.0% of participants displaying stable activity trajectories in a UK Biobank subsample with at least one repeated questionnaire-based MVPA measurement over 7 years.67 Additionally, our method of employing two distinct MVPA assessments to explore changes in MVPA volume and outcomes has further supported our main findings. Nevertheless, future research that includes longer and repeated periods of activity monitoring is crucial to further substantiate these findings. Second, relying solely on ICD-10 diagnosis codes may primarily capture advanced stages of VHD, potentially leading to an underestimation of disease risk due to the under-diagnosis or late identification of milder, asymptomatic cases. Additionally, this approach also lacks the capacity for a quantitative severity assessment of valvular stenosis or regurgitation, which limits our ability to analyse the impact of physical activity on disease progression as a secondary prevention measure. Third, the inherent limitations of our observational study design prevent us from establishing causality and fully ruling out the possibility of residual confounding, despite our efforts to adjust for a broad range of confounders. Fourth, the main UK Biobank sample is not fully representative of the overall UK population, with a low response rate of 4.5%.68 It mainly consists of individuals of White European ancestry who tend to have better health than the general population. Nonetheless, it is noteworthy that the median physical activity levels observed in UK Biobank study participants (42 kJ/kg/day) are consistent with age-specific national estimates (for age ≥ 65 years, female: 42 kJ/kg/day; male: 46 kJ/kg/day).69,70 Additionally, the incidence rates of AS within our primary and secondary cohorts (7.95 and 7.50 per 10 000 person-years, respectively) are comparable with nationally representative estimates from other Western European regions (overall AS incidence rates per 10 000 person-years: Scotland: 3.65; France: 3.87; Denmark: 11.4).71–73 Recent studies have shown that the associations between physical activity and cardiovascular disease mortality outcomes in the UK Biobank study are consistent with observations from other more representative samples.74,75 Despite these findings, further research is needed to explore the impact of physical activity on VHD risk across diverse populations.
Conclusions
Findings from the UK Biobank suggest that increased physical activity may be effective in preventing AS and associated adverse events. Future research needs to validate these findings in diverse populations with longer durations and repeated periods of activity monitoring.
Acknowledgements
We express our gratitude to the UK Biobank study participants and researchers for their essential contributions. Special thanks to Professor Yang Wang and Dr Yang Chen for their guidance on statistical analysis and manuscript revision and to Dr Ruixue Yang for representing our team at the American Heart Association's Annual Scientific Sessions 2023. Dr Pibarot holds the Canada Research Chair in Valvular Heart Diseases from the Canadian Institutes of Health Research. Dr Clavel holds an Early Career Investigator Award in Circulatory and Respiratory Health and the Canada Research Chair on Women’s Cardiac Valvular Health from the Canadian Institutes of Health Research. Dr Zhang holds a State Scholarship Fund from China Scholarship Council (No. 201806210439) and a fund from Capital’s Funds for Health Improvement and Research (CFH 2022-4-4037). Dr Li holds a State Scholarship Fund from China Scholarship Council (No. 202306210379). The images used in the figure were created by Figdraw.
Supplementary data
Supplementary data are available at European Heart Journal online.
Declarations
Disclosure of Interest
All authors declare no disclosure of interest for this contribution.
Data Availability
The UK Biobank data that support the findings of this study can be accessed by researchers on application (https://www.ukbiobank.ac.uk/register-apply/).
Funding
This work was supported by the Capital’s Funds for Health Improvement and Research (CFH 2022-4-4037) and the National High Level Hospital Clinical Research Funding (2023-GSP-RC-02 & 2023-GSP-QN-24).
Ethical Approval
Ethical approval for the UK Biobank was granted by the North West Multicenter Research Ethics Committee (reference number: 11/NW/0382), and all participants provided written informed consent.
Pre-registered Clinical Trial Number
None supplied.
References
Author notes
Bin Zhang, Haiyan Xu, Marie-Annick Clavel and Yongjian Wu contributed equally to the study and are joint corresponding authors.

