


Abstract
To explore male–female differences in aneurysm growth and clinical outcomes in a two-centre retrospective Dutch cohort study of adult patients with ascending aortic aneurysm (AscAA).
Adult patients in whom imaging of an AscAA (root and/or ascending: ≥40 mm) was performed between 2007 and 2022 were included. Aneurysm growth was analysed using repeated measurements at the sinuses of Valsalva (SoV) and tubular ascending aorta. Male–female differences were explored in presentation, aneurysm characteristics, treatment strategy, survival, and clinical outcomes.
One thousand eight hundred and fifty-eight patients were included (31.6% female). Median age at diagnosis was 65.4 years (interquartile range: 53.4–71.7) for females and 59.0 years (interquartile range: 49.3–68.0) for males (P < .001). At diagnosis, females more often had tubular ascending aortic involvement (75.5% vs. 70.2%; P = .030) while males more often had SoV involvement (42.8% vs. 21.6%; P < .001). Maximum absolute aortic diameter, at any location, at diagnosis did not differ between females (45.0 mm) and males (46.5 mm; P = .388). In females, tubular ascending growth was faster (P < .001), whereas in males, SoV growth was faster (P = .005), corrected for covariates. Unadjusted 10-year survival was 72.5% [95% confidence interval (CI) 67.8%–77.6%] for females and 78.3% (95% CI 75.3%–81.3%) for males (P = .010). Twenty-three type A dissections occurred, with an incidence rate of 8.2/1000 patient-years (95% CI 4.4–14.1) in females and 2.4/1000 patient-years (95% CI 1.2–4.5) in males [incidence rate ratio females/males: 3.4 (95% CI 1.5–8.0; P = .004)].
In patients having entered a diagnostic programme, involvement of aortic segments and age- and segment-related growth patterns differ between women and men with AscAA, particularly at an older age. Unravelling of these intertwined observations will provide a deeper understanding of AscAA progression and outcome in women and men and can be used as an evidence base for patient-tailored clinical guideline development.
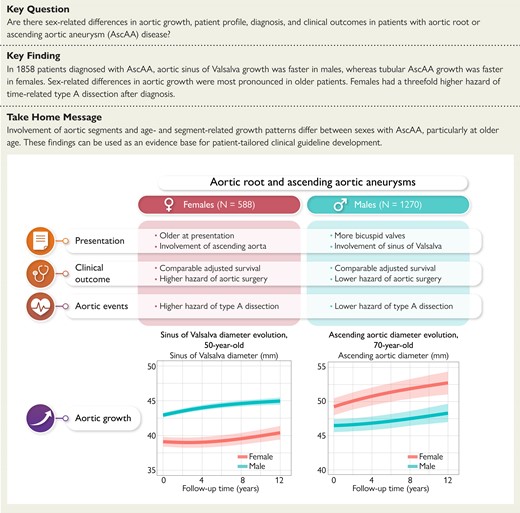
Comparative analysis of long-term clinical outcome and segment-specific aortic growth in males and females diagnosed with an aortic root and/or ascending aortic aneurysm. AscAA, ascending aortic aneurysm.
See the editorial comment for this article ‘Thoracic aortic disease: why sex matters’, by J. Dumfarth et al., https://doi.org/10.1093/eurheartj/ehae713.
Introduction
Ascending aortic aneurysms (AscAAs) are known as ‘silent killers’, with indolent progression and life-threatening aortic dissection and rupture hazards.1–3 To prevent aortic events, AscAAs usually require elective surgical intervention. Because of often relatively late diagnosis and subsequent early treatment thereafter, the natural history of AscAAs remains poorly understood. Better understanding of the clinical course of diagnosed AscAAs is crucial to enable patient-tailored care and guide optimal surgical planning and, considering male–female differences in this respect, may optimize tailoring of treatment for both females and males.
Following current European guidelines for aortic disease, males and females without any additional risk factors are advised to have preventive surgical treatment from equal aneurysm diameter cut-off values ranging between 50 and 55 mm for both the sinus of Valsalva (SoV) and ascending aorta.4–7 This while, compared with male, it is reported that females entail a higher hazard of thoracic aortic dissection or rupture.2 In the setting of abdominal aortic aneurysms (AAAs), reportedly acute aortic events (AAEs) occur at smaller diameters in females than in males, even when corrected for body size.8 Furthermore, several small-sized studies suggested faster aortic growth in females but provided no insights for age-related as well as SoV or ascending aortic growth specifically in patients after aneurysm diagnosis.9–11
Therefore, the aim of this study is to explore male–female differences in SoV and ascending aortic growth, treatment strategy, and clinical outcomes including AAEs in a Dutch two-centre retrospective cohort study of adult patients diagnosed with an aortic root and/or AscAA.
Methods
Study population
All adults receiving diagnostic and/or follow-up imaging of a SoV and/or tubular ascending aortic dilatation measuring ≥40 mm (AscAA) between 2007 and 2022 in the two participating centres were considered eligible for inclusion. Patients with infective aneurysms, mycotic aneurysms, chronic type A dissection (TAD), and patients that had no aortic measurements before TAD, aortic rupture, or ascending aortic intervention were excluded.
Ethical approval
The protocol for this study was reviewed and approved by the local medical ethics committees of the Erasmus University Medical Centre (MEC-2018-1535) and the Radboud University Medical Centre (MEC-2019-5157). The need for informed consent was waived. This study was conducted in light of the DisSEXion Study within the Size Matters Consortium, funded by ZonMW.12
Data collection and definitions
All data were collected retrospectively from the electronic patient files and were stored in data capture program OpenClinica, Community Edition, version 3.12.2 (OpenClinica, Waltham, MA, USA). Relevant patient, presentation and aneurysm characteristics, imaging data, and clinical outcomes were collected. Collected variables including their definitions are listed in Supplementary data online, Supplement S1.
An AscAA was defined as an aorta measuring ≥40 mm. Involvement of the SoV, sinotubular junction, tubular ascending aorta, or aortic arch was reported if the aorta measured ≥40 mm. Involvement of the aortic annulus, descending aorta, or abdominal aorta was reported if the aorta measured ≥30 mm. Aneurysm size was indexed according to the aortic size index (in mm/m2) by dividing aortic diameter by patient body surface area and the aortic height index (in mm/m) by dividing aortic diameter by patient height.13 A coincidental presentation was reported if the reason for imaging was not due to non-exercise or exercise-related symptoms and if the patient was not referred for any type of genetic or family screening. Functional class was reported according to the New York Heart Association (NYHA) classification for heart failure, and chest pain was reported according to the Canadian Cardiovascular Society (CCS) classification. Causes of death were classified as cardiovascular [e.g. vascular (including strokes)/aortic deaths] or non-cardiovascular (e.g. neurodegenerative, malignancy, and all other causes). To evaluate if patients were alive at the end of the inclusion period in 2022, the Dutch Personal Records Database was interrogated. Follow-up completeness was calculated using the modified Clark’s C method.14
Aortic imaging
Transthoracic echocardiography (TTE), magnetic resonance imaging (MRI), and computed tomography [CT(A)] reports were retrospectively screened for aortic diameter measurements at multiple levels: annulus, SoV, sinotubular junction, tubular ascending aorta, aortic arch, and descending aorta. There was no pre-specified imaging protocol for this retrospective study; aortic diameter measurements were measured according to the local imaging protocol at that time. For CT(angiography) and MRI studies, the largest SoV diameter was always entered into the database, in both bicuspid and tricuspid valves. Due to the retrospective nature, most but not all CT scans were electrocardiogram (ECG) gated.
Statistical analyses
Continuous data are presented as means ± standard deviations (Gaussian) or medians with an interquartile range (IQR) (non-Gaussian). Categorical data are presented as counts with percentage. The Shapiro–Wilk test was employed within subgroups (male/female, elderly/non-elderly) to analyse whether data were normally distributed. Comparisons out of continuous variables were made with the unpaired t-test or the Mann–Whitney test, as appropriate (two groups). For categorical variables, the χ2 or Fisher’s exact test (≤5 observations) was used for comparisons between groups. Patients were stratified by sex (male, female) and age [non-elderly (<70 years), elderly (≥70 years)].
Event occurrence rates are presented as incidence rates and were calculated using the number of observed events and the total number of patient-years. The comparison between the incidence rates of males and females was evaluated by the incidence rate ratio. Long-term survival and freedom from intervention after diagnosis were estimated and presented according to Kaplan–Meier (product–limit method). Patient survival was compared with the survival of the age-matched and sex-matched general Dutch population by a novel, patient-level matching strategy that can be freely accessed online (https://emcbiostatistics.shinyapps.io/Kit_BGMortality/). Patients were matched on an individual level using individual patient age (annually updating), calendar year of follow-up (annually updating), patient sex, and time of censoring. To investigate male–female differences in time-to-event outcomes, the log-rank test was used. Time to intervention was also analysed in the presence of death as a competing risk, by using a Fine and Gray model. Two multivariable Cox proportional hazard models were developed to identify independent baseline risk factors, one for mortality and one for intervention. Included risk factors were chosen based on clinical knowledge and were all at once entered in a multivariable model structure. Correlation between predictors was assessed by Spearman’s correlation coefficient before multivariable analysis, and in case of strong correlation (e.g. Spearman ≥0.70 or ≤−0.70), the clinically most important variable, determined by the research team, was retained. The proportional hazard assumption was tested with Schoenfeld residuals. In a separate model, the interaction terms between sex and clinical variables were tested for their association with time-to-event outcomes. A P ≤ .05 was considered statistically significant. All statistical analyses were performed in R Statistical Software (Rstudio v2022.07.2 and R Software v4.2.2) with the use of packages survival, mice, nlme, lme4, and JMbayes2.
To handle missing values in baseline characteristics, multiple imputation by chained equations using the statistical mice package in R was performed.15 Selected baseline variables with <45% missingness were imputed. In multivariable models, only imputed variables with <30% missingness were included, with an exception made for smoking status (35% missing), as it was deemed potentially important in aortic growth prediction, and the weight of this risk factor may vary between males and females.16 Imputation was performed in accordance with the considerations described by Papageorgiou et al.17 Multivariable Cox models were performed on each data set separately and pooled according to Rubin and Schenker’s rule.18 Details regarding imputation are given in Supplementary data online, Supplements S2 and S3.
To capture aortic growth over time, linear mixed-effects models were employed.19 Additionally, inter-modality imaging correlations were investigated.20 The linear mixed-effects model for aneurysm growth was inserted into a Cox proportional hazards model for surgical intervention and TAD using a Bayesian approach, to construct a joint model framework and thereby adjust for non-random dropout (related to aneurysm growth).21 All analyses were performed for the SoV and tubular ascending aorta separately, and SoV growth was also assessed in subjects presenting with an isolated tubular aneurysm—and vice versa. Thus, the aortic diameter was modelled in both segments to obtain insights into aortic growth in subjects diagnosed with a SoV and/or tubular aneurysm, regardless of aortic segment involvement. Further details regarding the mixed-effects and joint models are provided in Supplementary data online, Supplement S4.
Results
Patients and presentation
Between 2007 and 2022, 1858 patients (31.6% female) with a median age of 60.9 years (IQR: 50.5– 69.3 years) at diagnosis received diagnostic and/or follow-up imaging for their SoV and/or tubular ascending aorta. Median clinical follow-up was 5.9 years (IQR: 3.0–10.0 years). Baseline characteristics, stratified by sex and age group, are listed in Table 1. At diagnosis, females [65.4 years (IQR: 53.4–71.7)] were older compared with males [59.0 years (IQR: 49.3–68.0), P < .001]. In the elderly, the proportion of females (41.1%) was significantly higher compared with in the non-elderly (28.6%; P < .001).
Baseline characteristics of patients diagnosed with an aortic root or tubular ascending aortic aneurysm, stratified by sex (male, female) and age groups (non-elderly, elderly)
| Overall (n = 1858) | Men (n = 1270) | Women (n = 588) | P-value (men/women) | Non-elderly (n = 1401) | Elderly (n = 557) | P-value (non-elderly/elderly) | |
|---|---|---|---|---|---|---|---|
| Female patients (n) | 588 (31.6) | 588 (100.0) | 400 (28.6) | 188 (41.1) | <.001 | ||
| Age at diagnosis (years) | 60.9 (50.5, 69.3) | 59.0 (49.3, 68.0) | 65.4 (53.4, 71.7) | <.001 | 55.93 (45.59, 63.15) | 74.21 (71.62, 77.50) | <.001 |
| Height (cm) | 178.0 (170.0, 184.0) | 180.5 (176.0, 187.0) | 168.0 (162.0, 173.0) | <.001 | 1.78 (1.72, 1.85) | 1.73 (1.66, 1.79) | <.001 |
| Weight (kg) | 82.1 (72.0, 93.6) | 86.0 (78.0, 96.0) | 72.0 (63.0, 82.0) | <.001 | 84.10 (75.00, 95.00) | 77.40 (67.15, 86.00) | <.001 |
| BSA (m2) | 2.0 (1.9, 2.2) | 2.1 (2.0, 2.2) | 1.82 (1.70, 2.0) | <.001 | 2.04 (1.90, 2.18) | 1.91 (1.76, 2.05) | <.001 |
| BMI (kg/m2) | 26.2 (23.6, 29.1) | 26.3 (24.0, 29.0) | 25.70 (22.9, 29.4) | .019 | 26.35 (23.65, 29.41) | 25.61 (23.51, 28.34) | .008 |
| Bicuspid aortic valve (n) | 456 (24.5) | 349 (27.5) | 107 (18.2) | <.001 | 410 (29.3) | 46 (10.1) | <.001 |
| Aortic arch anatomy (n) | .933 | .266 | |||||
| Normal aortic arch (n) | 730 (39.9) | 515 (40.6) | 215 (36.6) | 542 (38.7) | 188 (41.1) | ||
| Bicarotid trunk (n) | 99 (5.3) | 68 (5.4) | 31 (5.3) | 76 (5.4) | 23 (5.0) | ||
| Aberrant RSA/lusoria (n) | 6 (0.3) | 4 (0.3) | 2 (0.3) | 6 (0.4) | |||
| Prior aortic surgery (n) | 120 (6.5) | 100 (7.9) | 20 (3.4) | <.001 | 87 (6.2) | 33 (7.3) | .501 |
| Same part of aorta (n) | 38 (2.0) | 31 (2.4) | 7 (1.2) | .112 | 38 (2.7) | .001 | |
| Other part of aorta (n) | 89 (4.8) | 74 (5.8) | 15 (2.6) | .001 | 56 (4.0) | 33 (7.2) | .007 |
| Prior cardiac interventiona (n) | 200 (10.8) | 163 (12.8) | 37 (6.3) | <.001 | 132 (9.4) | 18 (3.9) | <.001 |
| Prior CABG (n) | 25 (1.3) | 22 (1.7) | 3 (0.5) | .057 | 16 (1.1) | 9 (2.0) | .265 |
| Prior AVR (n) | 87 (4.7) | 76 (6.0) | 11 (1.9) | <.001 | 82 (5.9) | 5 (1.1) | <.001 |
| Prior other cardiac surgery (n) | 47 (2.5) | 39 (3.1) | 8 (1.4) | .044 | 43 (3.1) | 4 (0.9) | .016 |
| Prior myocardial infarction (n) | 96 (5.2) | 81 (6.4) | 15 (2.6) | .001 | 66 (4.7) | 30 (6.6) | .138 |
| Prior aortic stenosis, grade III/IV (n) | 198 (10.7) | 140 (11.0) | 58 (9.9) | .171 | 166 (11.8) | 32 (7.0) | .162 |
| Prior aortic insufficiency, grade III/IV (n) | 325 (17.5) | 219 (17.2) | 106 (18.0) | .771 | 246 (17.6) | 79 (17.3) | .009 |
| Hypertension (n) | 986 (53.1) | 651 (51.3) | 335 (57.0) | .028 | 690 (49.3) | 296 (64.8) | <.001 |
| Diabetes (n) | 116 (6.2) | 72 (5.7) | 44 (7.5) | .159 | 71 (5.1) | 45 (9.8) | <.001 |
| Diabetes NIDDM (n) | 102 (5.5) | 64 (5.0) | 38 (6.5) | 62 (4.4) | 40 (8.8) | .001 | |
| Diabetes IDDM (n) | 14 (0.8) | 8 (0.6) | 6 (1.0) | 9 (0.6) | 5 (1.1) | .506 | |
| Chronic obstructive pulmonary disease (n) | 168 (9.0) | 102 (8.0) | 66 (11.2) | .032 | 100 (7.1) | 68 (14.9) | <.001 |
| CVA (n) | 173 (9.3) | 115 (9.1) | 58 (9.9) | .619 | 119 (8.5) | 54 (11.8) | .042 |
| CKD (n) | 94 (5.1) | 64 (5.0) | 30 (5.1) | 1.000 | 58 (4.1) | 36 (7.9) | .002 |
| Smoking (n) | .951 | .001 | |||||
| Never (n) | 322 (17.3) | 228 (18.0) | 94 (16.0) | 256 (18.3) | 66 (14.4) | .014 | |
| Currently (n) | 327 (17.6) | 229 (18.0) | 98 (16.7) | 257 (18.3) | 70 (15.3) | .040 | |
| In the past (n) | 583 (31.4) | 407 (32.0) | 176 (29.9) | 401 (28.6) | 182 (39.8) | <.001 | |
| Hyperlipidaemia (n) | 445 (24.0) | 310 (24.4) | 135 (23.0) | .578 | 323 (23.1) | 122 (26.7) | .105 |
| Prior aortic dissection or aneurysm (n) | 142 (7.6) | 113 (8.9) | 29 (4.9) | .004 | 77 (5.5) | 65 (14.2) | <.001 |
| Genetic disease (n) | 267 (14.4) | 167 (13.1) | 100 (17.0) | .033 | 243 (17.3) | 24 (5.3) | <.001 |
| Marfan syndrome (n) | 93 (5.0) | 52 (4.1) | 41 (7.0) | .016 | 91 (6.5) | 2 (0.4) | <.001 |
| Turner syndrome (n) | 15 (0.8) | 15 (2.6) | <.001 | 15 (1.1) | .157 | ||
| SMAD3 mutation (n) | 16 (0.9) | 12 (0.9) | 4 (0.7) | .680 | 15 (1.1) | 1 (0.2) | .419 |
| Suspected genetic disease (n) | 51 (2.7) | 34 (2.7) | 17 (2.9) | 1.000 | 48 (3.4) | 3 (0.7) | .046 |
| Family history of aortic disease (n) | 436 (23.5) | 290 (22.8) | 146 (24.8) | .133 | 356 (25.4) | 80 (17.5) | .084 |
| Family history of connective tissue disease (n) | 126 (6.8) | 76 (6.0) | 50 (8.5) | .033 | 121 (8.6) | 5 (1.1) | <.001 |
| NYHA (n) | .013 | .062 | |||||
| Class I (n) | 995 (53.3) | 710 (55.9) | 285 (48.5) | .001 | 792 (56.5) | 203 (44.4) | .023 |
| Class II (n) | 201 (10.8) | 125 (9.8) | 76 (12.9) | .033 | 152 (10.8) | 49 (10.7) | .430 |
| Class III (n) | 144 (7.8) | 89 (7.0) | 55 (9.4) | .065 | 101 (7.2) | 43 (9.4) | .021 |
| Class IV (n) | 19 (1.0) | 12 (0.9) | 7 (1.2) | .770 | 15 (1.1) | 4 (0.9) | 1.000 |
| CCS (n) | .032 | .756 | |||||
| Class I (n) | 1233 (66.4) | 851 (67.0) | 382 (65.0) | .268 | 961 (68.6) | 272 (59.5) | |
| Class II (n) | 70 (3.8) | 39 (3.1) | 31 (5.3) | .025 | 51 (3.6) | 19 (4.2) | |
| Class III (n) | 26 (1.4) | 22 (1.7) | 4 (0.7) | .116 | 21 (1.5) | 5 (1.5) | |
| Class IV (n) | 34 (1.8) | 22 (1.7) | 12 (2.0) | .765 | 27 (2.5) | 7 (2.3) | |
| LVEF (n) | .152 | <.001 | |||||
| Good (n) | 1365 (73.5) | 932 (73.4) | 433 (73.6) | 1081 (77.2) | 284 (62.1) | <.001 | |
| Reduced (n) | 221 (11.9) | 166 (13.1) | 55 (9.4) | 146 (10.4) | 75 (16.4) | <.001 | |
| Moderate (n) | 104 (5.6) | 77 (6.1) | 27 (4.6) | 73 (5.2) | 31 (6.8) | .125 | |
| Poor (n) | 14 (0.8) | 10 (0.8) | 4 (0.7) | 9 (0.6) | 5 (1.1) | .425 | |
| ECG rhythm (n) | .001 | <.001 | |||||
| Sinus rhythm (n) | 1466 (78.9) | 975 (76.8) | 491 (83.5) | .001 | 1120 (79.9) | 346 (75.7) | .063 |
| Bradycardia (n) | 167 (9.0) | 134 (10.6) | 33 (5.6) | .001 | 138 (9.9) | 29 (6.3) | .029 |
| SVT (n) | 119 (6.4) | 94 (7.4) | 25 (4.3) | .013 | 72 (5.1) | 47 (10.3) | <.001 |
| Paced rhythm (n) | 18 (1.0) | 12 (0.9) | 6 (1.0) | 1.000 | 11 (0.8) | 7 (1.5) | .254 |
| Ischemia on ECG (n) | 131 (7.1) | 99 (7.8) | 32 (5.4) | .050 | 100 (7.1) | 31 (6.8) | .476 |
| Creatinine (µmol/L) | 82.0 (70.0, 97.0) | 88.0 (77.0, 101.0) | 69.0 (60.0, 80.0) | <.001 | 82.00 (70.00, 94.50) | 86.00 (71.00, 103.25) | .002 |
| eGFR (mL/min/1.73 m2) | 81.0 (65.0, 90.0) | 81.0 (64.0, 90.0) | 80.00 (65.0, 90.0) | .163 | 85.00 (70.00, 90.00) | 67.00 (54.75, 83.00) | <.001 |
Bold P-values indicate significance at .05 level (P < .05). Non-elderly, <70 years; elderly, ≥70 years.
BSA, body surface area; BMI, body mass index; PTCA, percutaneous transluminal coronary angioplasty; CABG, coronary artery bypass grafting; AVR, aortic valve replacement; NIDDM, non-insulin-dependent diabetes mellitus; IDDM, insulin-dependent diabetes mellitus; CVA, cerebral vascular accident; CKD, chronic kidney disease; NYHA, New York Heart Association; CCS, Canadian Cardiovascular Society; LVEF, left ventricular ejection fraction; ECG, electrocardiography; eGFR, glomerular filtration rate.
aPrior cardiac intervention includes PTCA/PCI procedures and surgical cardiac procedures.
Females more often had ascending aortic involvement (75.5% vs. 70.2%; P = .030) while males more often had SoV involvement at diagnosis (42.8% vs. 21.6%; P < .001). While the overall maximum absolute aortic diameter, at any location, at diagnosis did not differ between females (45.0 mm) and males (46.5 mm; P = .388), the SoV diameter at diagnosis was significantly smaller in females compared with males [females: 40.0 mm (IQR: 35.0–42.3), males: 43.0 mm (IQR: 40.0–47.0; P < .001)]. The ascending aortic diameter at diagnosis was significantly larger in elderly females compared with elderly males [females: 50.0 mm (IQR: 43.7–55.0), males: 47.0 mm (IQR: 42.0–52.0; P < .001)]. After indexing for patient height, the maximum aortic diameter was larger in females [27.4 mm/m (IQR: 25.0–31.8)] compared with males [25.6 mm/m (IQR: 23.6–28.4), P < .001]. Details on AscAA presentation are listed in Table 2, stratified for males and females as well as elderly and non-elderly.
Aneurysm characteristics at presentation for all ascending aortic aneurysm patients (n = 1858) and stratified by sex (male, female) and age groups (non-elderly, elderly)
| Overall (n = 1858) | Men (n = 1270) | Women (n = 588) | P-value (men/women) | Non-elderly (n = 1401) | Elderly (n = 457) | P-value (non-elderly/elderly) | |
|---|---|---|---|---|---|---|---|
| Age at diagnosis (years) | 60.9 (50.5, 69.3) | 59.0 (49.3, 68.0) | 65.4 (53.4, 71.7) | <.001 | 55.9 (45.6, 63.2) | 74.2 (71.6, 77.5) | <.001 |
| First presentation (n) | .541 | <.001 | |||||
| Coincidental finding (n) | 833 (44.8) | 571 (45.0) | 262 (44.6) | 578 (41.3) | 255 (55.8) | <.001 | |
| Family screening (n) | 237 (12.8) | 170 (13.4) | 67 (11.4) | 221 (15.8) | 16 (3.5) | <.001 | |
| Suspected connective tissue disease (n) | 39 (2.1) | 24 (1.9) | 15 (2.6) | 39 (2.8) | 0 (0.0) | .001 | |
| Exercise related symptoms/complaints (n) | 186 (10.0) | 121 (9.5) | 65 (11.1) | 140 (10.0) | 46 (10.1) | 1.000 | |
| Non-exercise related symptoms/complaints (n) | 237 (12.8) | 164 (12.9) | 73 (12.4) | 176 (12.6) | 61 (13.3) | .740 | |
| Maximum aortic diameter (mm) | 46.0 (42.0, 51.0) | 46.5 (43.0, 51.0) | 45.0 (42.0, 53.0) | .388 | 46.0 (42.0, 50.0) | 48.0 (43.0, 54.0) | <.001 |
| ASI (mm/m2) | 22.6 (20.1, 26.1) | 21.7 (19.4, 24.3) | 25.4 (22.5, 29.2) | <.001 | 22.1 (19.7, 25.1) | 24.9 (21.9, 28.9) | <.001 |
| AHI (mm/m) | 26.1 (23.9, 29.4) | 25.6 (23.6, 28.4) | 27.4 (25.0, 31.8) | <.001 | 25.7 (23.7, 28.6) | 27.8 (25.0, 31.4) | <.001 |
| Max aortic diameter at aortic sinuses (n) | 516 (27.8) | 407 (32.0) | 109 (18.5) | <.001 | 443 (34.2) | 73 (17.7) | <.001 |
| Max aortic diameter at tubular ascending (n) | 1127 (66.0) | 790 (62.2) | 437 (74.3) | <.001 | 880 (67.8) | 347 (84.2) | <.001 |
| Annular diameter (mm) | 26.0 (24.0, 29.2) | 27.0 (25.0, 30.0) | 24.2 (22.3, 25.5) | <.001 | 26.0 (23.78, 29.13) | 48.0 (43.0, 54.0) | .959 |
| Aortic sinus diameter (mm) | 42.0 (39.0, 46.0) | 43.0 (40.0, 47.0) | 40.0 (35.0, 42.3) | <.001 | 42.0 (39.55, 46.55) | 41.0 (38.0, 44.3) | .008 |
| Tubular ascending aortic diameter (mm) | 45.0 (41.0, 51.0) | 45.0 (41.0, 50.0) | 45.0 (41.0, 52.0) | .132 | 45.0 (40.0, 50.0) | 48.0 (42.0, 54.0) | <.001 |
| Arch diameter (mm) | 32.0 (27.0, 38.3) | 32.0 (28.0, 38.0) | 32.0 (25.0, 39.0) | .057 | 30.0 (26.0, 35.0) | 36.0 (32.0, 41.5) | <.001 |
| Descending diameter (mm) | 32.0 (27.0, 43.0) | 31.0 (27.0, 41.0) | 33.0 (25.5, 46.0) | .666 | 29.0 (25.0, 38.0) | 41.0 (31.0, 52.8) | <.001 |
| Involvement annulus (n) | 50 (2.7) | 46 (3.6) | 4 (0.7) | <.001 | 43 (3.1) | 7 (1.5) | .879 |
| Involvement aortic sinuses (n) | 671 (36.1) | 544 (42.8) | 127 (21.6) | <.001 | 555 (39.6) | 116 (25.4) | .023 |
| Involvement tubular ascending (n) | 1335 (71.9) | 891 (70.2) | 444 (75.5) | .030 | 962 (68.7) | 373 (81.6) | <.001 |
| Involvement arch (n) | 74 (4.0) | 48 (3.8) | 26 (4.4) | .915 | 34 (2.4) | 40 (9.2) | <.001 |
| Involvement descending (n) | 130 (7.0) | 72 (5.7) | 58 (9.9) | .172 | 51 (3.6) | 79 (17.3) | <.001 |
Bold P-values indicate significance at .05 level (P < .05). Non-elderly, <70 years; elderly, ≥70 years.
AHI, aortic height index; ASI, aortic size index.
Long-term survival after diagnosis
Follow-up completeness was 93.9% for survival. During a total of 13 021 years of clinical follow-up, 19.5% (n = 363) of patients died. Causes of death included non-cardiovascular death in 15.7% (n = 57), cardiovascular death in 7.4% (n = 27), death during/after elective aortic surgery in 3.3% (n = 12), death during/after emergent surgery in 1.4% (n = 5), and unknown in 76.0% (n = 276) of all deaths. Aortic or vascular death was reported in 4.4% (n = 16) of cases, of which 10 consisted of confirmed aortic rupture (6 in males, 4 in females; P = .937). There was no significant difference in causes of death between males and females (P = .121).
Kaplan–Meier survival estimates for males, females, non-elderly, and elderly are presented in Figure 1. Kaplan–Meier survival for all patients is presented in Supplementary data online, Supplement S5. Unadjusted survival estimates for females at 5, 10, and 15 years after diagnosis were 86.0% [95% confidence interval (CI) 83.0%–89.2%], 72.5% (67.8%–77.6%), and 56.1% (48.7%–64.5%), respectively. Unadjusted survival estimates for males at 5, 10, and 15 years after diagnosis were 88.9% (87.0%–90.8%), 78.3% (75.3%–81.3%), and 65.7% (61.4%–70.4%) (log-rank P = .010), respectively. Relative survival as a proportion of expected in the age- and sex-matched general Dutch population was 68.8% in females and 78.7% in males at 15 years after diagnosis (Figure 1A). A Cox proportional hazard model correcting for covariates showed that mortality hazards did not differ between males and females (P for sex = .706) (Table 3). All interaction terms between sex and other risk factors were not significant (P > .05) (see Supplementary data online, Supplement S6).
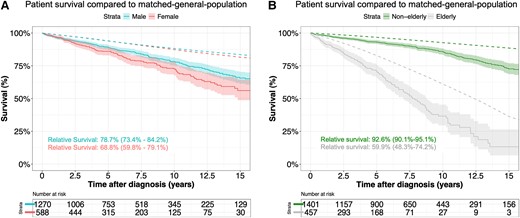
Overall survival from diagnosis compared with the matched general population for males and females with an ascending thoracic aortic aneurysm (A) and non-elderly and elderly with an ascending thoracic aortic aneurysm (B). Relative survival is presented at 15 years and constitutes the survival of the patients as a proportion of that expected in an age-, sex-, and origin-matched general population
Model coefficients of the multivariable Cox proportional hazard model for all-cause mortality and surgical intervention after diagnosis
| Variable | Mortality | Intervention | ||
|---|---|---|---|---|
| Hazard (95% CI) | P-value | Hazard (95% CI) | P-value | |
| Female | 0.96 (0.75–1.22) | .706 | 1.16 (1.02–1.33) | .028 |
| First diameter | 1.01 (0.99–1.03) | .209 | 1.05 (1.05–1.06) | <.001 |
| BAV | 1.21 (0.88–1.64) | .229 | 1.85 (1.63–2.10) | <.001 |
| Age at diagnosis | 1.08 (1.02–1.15) | .017 | 0.99 (0.98–0.99) | <.001 |
| NYHA I | Reference | Reference | Reference | Reference |
| NYHA II | 0.84 (0.59–1.20) | .367 | 1.22 (1.02–1.47) | .031 |
| NYHA III | 1.04 (0.74–1.46) | .787 | 1.48 (1.15–1.91) | .004 |
| NYHA IV | 0.75 (0.22–2.6) | .640 | 1.15 (0.69–1.91) | .610 |
| Hypertension | 1.12 (0.79–1.6) | .521 | 0.97 (0.85–1.11) | .648 |
| Chronic obstructive pulmonary disease | 1.46 (1.01–2.12) | .042 | 0.91 (0.73–1.14) | .415 |
| Diabetes | 1.12 (0.73–1.73) | .599 | 1.05(0.80–1.38) | .706 |
| Smoking, never | Reference | Reference | Reference | Reference |
| Current smoking | 1.72 (1.11–2.68) | .019 | 0.96 (0.78–1.17) | .660 |
| Smoking in the past | 1.11 (0.67–1.85) | .646 | 1.08 (0.91–1.29) | .344 |
| CCS I | Reference | Reference | Reference | Reference |
| CCS II | 0.80 (0.42–1.51) | .475 | 1.30 (1.01–1.69) | .045 |
| CCS III | 0.90 (0.31–2.62) | .839 | 0.89 (0.50–1.61) | .703 |
| CCS IV | 0.66 (0.18–2.47) | .510 | 0.72 (0.45–1.19) | .203 |
| Prior aortic surgery | 1.21 (0.80–1.85) | .368 | 1.02 (0.79–1.31) | .890 |
| Prior cardiac surgery | 1.26 (0.69–2.3) | .433 | 0.91 (0.73–1.14) | .416 |
| CKD | 1.70 (1.18–2.45) | .004 | 0.99 (0.72–1.34) | .927 |
| LVEF, good | Reference | Reference | Reference | Reference |
| LVEF, reduced | 1.38 (0.89–2.16) | .135 | 0.93 (0.77–1.12) | .453 |
| LVEF, moderate | 1.61 (1.07–2.43) | .023 | 1.04 (0.82–1.31) | .769 |
| LVEF, poor | 5.07 (2.04–12.70) | .001 | 1.72 (0.87–3.43) | .119 |
Bold P-values indicate significance at .05 level (P < .05). CI, confidence interval; BAV, bicuspid aortic valve; NYHA, New York Heart Association; CCS, Canadian Cardiovascular Score; CKD; chronic kidney disease; LVEF, left ventricular ejection fraction.
Aneurysm growth and aortic syndromes
During a median imaging follow-up of 2.6 (IQR: 0.5–6.3) years before intervention, 7816 studies with measurements of the SoV and/or tubular ascending aorta were conducted (TTE: 3918, CT: 2678, and MRI: 1220); mean number of measurements per patient was 4.2 (median: 3.0, range: 1.0–31.0). Cumulative imaging follow-up was 6470 patient-years. The imaging modality used (CT, TTE, and MRI) did not explain additional variation (see Supplementary data online, Supplement S7).
Sinus of Valsalva aneurysm growth
Absolute SoV growth was 0.08 (−0.07 to 0.24) mm/year for females and 0.22 (0.17–0.27) mm/year for males. Females exhibited slower SoV growth during the first time period after diagnosis compared with males while correcting for covariates (P = .005) (see Supplementary data online, Supplement S8). After indexing for patient height, SoV growth for females was comparable to males (P = .559). Figure 2 represents the effect plot of SoV growth at ages 50 and 70 years, in females and males.
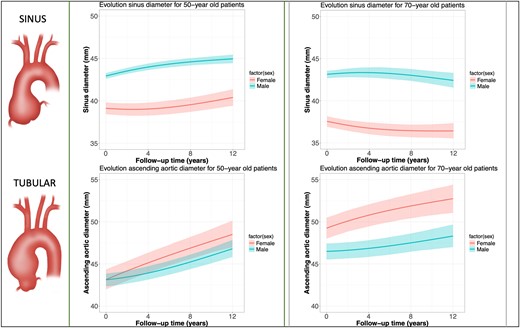
Effect plot from linear mixed-effects model of over 8000 repeated measurements of aortic sinus growth and tubular ascending aneurysm growth for younger (left side, 50 years old) and older patients (right box, 70 years old) with an ascending aortic aneurysm. Explanation: given the inclusion of interaction terms and nonlinear terms in the statistical model, the interpretation of the model coefficients are not straightforward. Effect plots such as this figure can overcome this by depicting the average outcome (here: aortic diameter) along with a 95% confidence interval for specific combinations of predictor levels (here: men vs. women)
Tubular ascending aneurysm growth
Absolute tubular AscAA growth was 0.33 (0.17–0.48) mm/year in females and 0.26 (0.20–0.31) mm/year in males. During the first time period after diagnosis, the tubular ascending aorta grew faster in females compared with males (P < .001), corrected for covariates (see Supplementary data online, Supplement S8). After indexing for patient height, tubular AscAA growth remained faster in females (P = .023). Figure 2 represents the effect plot of tubular AscAA growth at ages 50 and 70 years, for females and males. The evolution of indexed aortic diameters (aortic height index) in females and males over time is provided in Supplementary data online, Supplement S9.
Patients who presented with larger aortic diameters at diagnosis had significantly faster growth at level of the tubular ascending aorta (P < .001), but not at the SoV (P = .547), corrected for age, bicuspid aortic valve (BAV), and sex. After exclusion of patients with a proven or suspected genetic aetiology, male–female differences in aneurysm growth sustained (see Supplementary data online, Supplement S10). Further details regarding mixed-effects models and interaction terms are presented in Supplementary data online, Supplement S8.
Acute aortic events
Ninety-nine AAEs [23 TADs, 67 type B dissection (TBDs), and 9 ruptures] occurred in 90 patients [30 females (5.1% of females), 62 males (4.9% of males)] during a total of 5710 patient-years of follow-up before surgical intervention. The incidence rate for any AAE (including TBD) was 17.3 (95% CI 14.1–21.1) per 1000 patient-years (22.8/1000 patient-years for females, 15.7/1000 patient-years for males). The female-to-male incidence rate ratio of any AAE (including TBD) was 1.5 (95% CI 1.0–2.2) (P = .078).
The TAD incidence rate for all patients was 4.0 (95% CI 2.6–6.0) per 1000 patient-years (2.4/1000 patient-years for males, 8.2/1000 patient-years for females). The female-to-male TAD incidence rate ratio was 3.4 (95% CI 1.5–8.0) (P = .004). The median time between the latest aortic diameter measurement and TAD was 0.4 years (IQR: 0.1–0.9) for females and 1.3 years (IQR: 0.5–4.0) for males (P = .030). Latest maximum aortic diameter before TAD was comparable between females [median: 47.0 mm (IQR: 43.0–51.0)] and males [median: 47.5 mm (IQR: 47.0–50.8, P = .416)].
For the ascending aorta, a larger aortic diameter (in mm) at any given time was associated with a higher composite intervention/TAD hazard [hazard ratio (HR) 1.06 (1.05–1.08) for each 1 mm larger aorta, P < .001]. The isolated growth rate of the ascending aorta (mm/year) was not associated with a higher composite intervention/TAD hazard [HR per mm/year: 0.73 (0.38–3.86), P = .232] (see Supplementary data online, Supplement S8).
Surgical intervention
Surgery on the aortic root and/or ascending aorta was performed in 1110 patients (59.7%) during follow-up. Of these, 2.5% were emergent, all for TAD. Median time from diagnosis to surgery was 3.5 years in females and 4.7 years in males (P = .011) (Figure 3), and the median age at surgery was 65.5 years (IQR: 54.0–72.0) for females and 58.0 years (IQR: 49.0–68.0) for males (P < .001). Figure 4 summarizes the cumulative incidence of intervention for females and males in the presence of death as a competing risk. The multivariable Cox model for time-to-intervention is presented in Table 3; the HR for intervention in females compared with males was 1.16 (95% CI 1.0–1.3; P = .028). All interaction terms between sex and other risk factors were not significant (P > .05) (see Supplementary data online, Supplement S6). Surgical details are listed in Supplementary data online, Supplement S11.
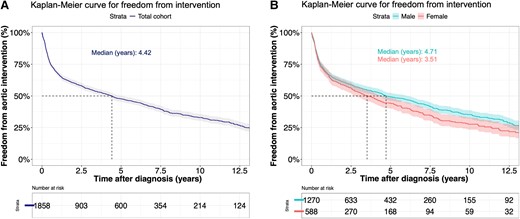
Freedom from elective proximal aortic intervention from diagnosis in all patients with an ascending thoracic aortic aneurysm (A) and males and females with an ascending thoracic aortic aneurysm (B)
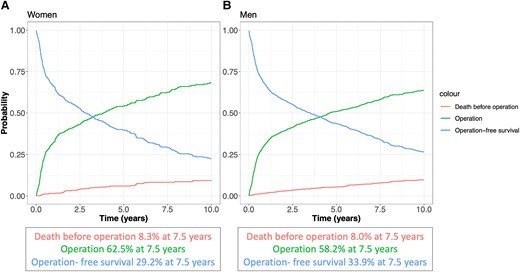
Cumulative incidence of elective surgical intervention on the aortic root or ascending aorta for women (A) and men (B) after diagnosis in the presence of death as a competing risk. Depicted are operation-free survival, cumulative incidence of operation, and death before intervention
Discussion
In this two-centre retrospective cohort study, patients diagnosed with AscAA showed different presentation and age-related growth patterns between males and females at the SoV and tubular ascending aorta, suggesting that females presented at an older age, and their aortic disease may progress faster. Also, females underwent surgery sooner after diagnosis compared with males and were found to have a three-fold higher diagnosed TAD rate at comparable absolute aortic diameters (Structured Graphical Abstract).
Presentation
In the current study, patients presented late in the disease stage, with maximum root/ascending aortic diameters averaging ∼47 mm, in line with previous studies.11 Indeed, women with cardiovascular disease are known to present at a later disease stage compared with men,22,23 but in the setting of SoV and AscAA, it remains unclear whether aneurysm size at the time of diagnosis differs from men. It is known that men have a higher cardiovascular morbidity burden compared with women at younger ages,24 and that women in Dutch primary care diagnostic trajectories undergo less imaging and specialist referral,25 which may both lead to earlier coincidental AscAA detection in men. Comparable absolute diameters but larger ascending indexed aortic diameter in women at presentation were previously reported by Vignac et al.26 The current study confirmed both these findings and additionally found that at the SoV, men exhibited larger diameters at first known presentation compared with women. Moreover, this study found that male–female differences at presentation were more pronounced in older patients (Figure 2). These observations are potentially explained by different aetiologies or disease mechanisms—e.g. related to earlier onset, root phenotype, and lower aortic stiffness in men.27 The protective effect of oestrogen on aortic aneurysm formation before the menopause should be further studied.11
In the interpretation of these findings, one should consider the possibility that women may have entered the analysis at a more advanced age and disease stage relative to body size. This may have influenced the results and the fact that more TADs were observed in women cannot be considered a causal effect.
Aneurysm growth
The observed male–female differences in SoV and tubular ascending aortic growth in patients diagnosed with an aneurysm at the SoV, at the tubular ascending aorta, or both suggest that these differences may be more pronounced in older patients. Previous studies have focused on male–female differences in thoracic aortic disease,10,11,26,28,29 including a recent literature review.30 However, most studies generally lacked an intersectional approach, e.g. also including age-related and location-related data in the equation when assessing male–female differences. This study aimed to overcome this by studying aortic growth at the intersection of age, sex, and aortic segments. Figure 2 examines this complex relationship, suggesting vast differences within these subgroups that add to currently available literature on proximal aortic aneurysms. It should be noted that this study assessed the evolution of the aortic diameter in all patients diagnosed with an aneurysm between the aortic valve and the distal ascending aorta. As such, the conclusions drawn from these analyses apply to the entire population diagnosed with AscAA—i.e. reflective of clinical practice—and not to specific AscAA phenotypes—i.e. a group of patients with isolated SoV or isolated tubular aortic dilatation. For example, this means that SoV growth estimates also include the SoV evolution of patients with an isolated tubular aortic aneurysm, and vice versa. The evolution of aortic diameter for specific AscAA disease phenotypes should be the subject of future studies.
Ascending aortic growth in the general Dutch population occurs, but at low rates: ∼0.072 mm/year in Dutch women and 0.070 mm/year in Dutch men.31 Growth rates of AscAAs in this study varied, and mean rates among subgroups (male/female, root/ascending) ranged from 0.08 to 0.33 mm/year. This is in line with a review focusing on AscAA growth by Oladokun et al.32 and corresponds well to a recent Dutch analysis (0.14–0.20 mm/year).9 Interestingly, although women had less BAV, they exhibited faster tubular AscAA growth compared with men while correcting for covariates. This faster growth in degenerative AscAA has been previously suggested in a smaller Canadian cohort,10,11 and persisting faster AscAA growth in women we found, even after indexing, is supplemented by Cheung et al.11 Elderly generally exhibited slower SoV and tubular AscAA growth in our study. Another recent study focusing on the natural history of thoracic aortic aneurysms33 similarly found slower AscAA growth in older patients, although >80% had a descending aortic aneurysm. Conversely, Wu et al.5 reported faster growth in older AscAA patients. However, these were only unoperated patients.
Men showed larger initial SoV diameters and faster SoV growth compared with women in this cohort, and it has been suggested that a root BAV phenotype occurs more often in men with BAV compared with women,34 which may explain this finding. This corresponds well to the community-based Framingham Heart Study, which reported faster aortic root growth rates in men compared with women at any age in mid-to-late adulthood.35 Present study represents one of the first large natural history studies investigating the SoV and tubular ascending aortic growth separately, at the intersection of patient age and sex. Genetic components may also be at play, especially since the origin of the aortic root lies in the second heart field, whereas the tubular ascending originates from the neural crest.
Aneurysm formation and growth entail a complex interplay of multiple factors, including hypertension, cholesterol, wall tensile strength, aortic stiffness, geometry, genetic mutations, extracellular matrix turnover, and flow patterns.10,11,22,28,36–38 Older women in our cohort showed different growth patterns, with lower SoV diameters and faster AscAA growth (Figure 2), possibly related to more hypertension,39 less vascular wall oestrogen receptors, greater aortic stiffness,40 and greater arterial haemodynamic loads.28 Matrix metalloproteinases (MMPs) degrade the extracellular matrix by proteolysis,41 inhibit Ca2+ entry in smooth muscle cells, and hence may cause aortic dilatation.42 Oestrogen reportedly decreases MMP concentrations in the vascular wall, which may provide clues for faster aneurysm growth in, especially older, women.11 Additionally, higher oestrogen receptor-alpha density in AAA is associated with lower MMP activity and lower aortic growth rates.43 Cheung et al.11 reported that faster aneurysm growth in women is exclusively seen in degenerative and not in heritable AscAAs, which is potentially related to menopause, aortic stiffness, and hypertension, and we found similar results.
Aortic diameter at diagnosis was an independent predictor of faster tubular ascending aortic growth. This observation is in line with a recent analysis by Wu et al.5 and could be explained by Laplace’s law, stating that spherical wall tension increases with increasing pressure and diameter. Whether indexing should be performed regularly, or Laplace’s theory also applies for compliant, non-spherical aortic aneurysms, remains to be elucidated. This study found aortic diameter at any given time point to be a better predictor of the composite endpoint of TAD or elective aortic intervention compared with aneurysm growth (slope), which was very recently suggested by Wu et al.5
Acute aortic events
Acute aortic events occurred in 5.0% of patients with AscAAs, which corresponds well with the 5.7% reported by Wu et al.5 Previous evidence shows that TAD indeed occurs at lower diameters in the current era.44 Importantly, this is because prophylactic surgery is offered to most patients with large sized aneurysms, excluding them from being at risk for TAD. In this study, women yielded higher TAD hazards after diagnosis. Although at the last measurement before TAD (women: 0.4 years before TAD, men: 1.3 years before TAD), maximum absolute diameters were comparable with men. However, a 47 mm aorta in a small woman has been suggested to be more pathological than a same-sized aorta in a tall man.13 Similar to this analysis, a previous study also found a higher TAD hazard in women,2 which should be further investigated to explore whether these observed male–female differences may warrant a different approach to the prevention of TAD in women vs. men.
The finding in the current study that men have more root aneurysms, but less aortic dissections compared with women, contrasts with a previous finding that root aneurysms are more malignant than AscAAs.27 This discrepancy may be explained by a more prevalent involvement at diagnosis of AscAAs (72%) compared with root aneurysms (36%) in the current study.
Surgical intervention
Half of all 1858 patients were operated within 5 years after diagnosis, most of them in an elective setting (>97%), and women underwent AscAA surgery more often and more quickly following their diagnosis. This is in line with the finding of current study that women and men presented with comparable absolute diameters of the tubular ascending aorta, but women exhibited faster growth at that level. It should be noted that surgery is a medical decision and affected by many factors other than merely the diameter, potentially also gender and age. As aneurysm growth in general, especially at the SoV, was low, the relatively fast intervention occurrence suggests that AscAA diagnosis is often made late in the disease stage.
Implications for clinical practice and guidelines
Two studies recently investigated the natural course of untreated thoracic aortic aneurysms.5,33 They report that most aortas, ascending and descending, grow in a slow manner. Additionally, aneurysm size of 50 mm seems a more appropriate intervention criterion than 55 mm, as AAEs and death occur significantly more often >50 mm compared with <50 mm.5 The current study provided detailed insights into the clinical course of SoV and AscAAs separately and adds to the current body of knowledge specific insights into male–female differences at the intersection of age.
Ninety-five per cent of diagnosed TADs in this study occurred below the surgical threshold of 55 mm, and absolute pre-dissection aortic diameters were comparable for men and women at ∼47 mm, but women still exhibited higher TAD hazards. One would still miss nearly half of all TADs should one only lower the diameter-based threshold.45,46 To overcome this, an emerging number of ‘non-size’ criterion have been proposed in recent years47 and novel, promising predictors such as aortic length48 or aortic stiffness index36 for predicting TAD should be evaluated prospectively.49 A left shift in the diameter threshold for prophylactic surgery is ongoing, which is based on multiple arguments.50 It appears crucial to determine the importance of each argument for men and women specifically, so follow-up and treatment strategies might be tailored (M/F).51 As such, a male–female specific approach in future guidelines based on current evidence should at least be discussed, and current data may aid in this discussion. While moving towards personalized aortic care, the added value of indexing of aortic diameters, as well as novel treatment solutions performed earlier in the disease stage, such as personalized external aortic root support,52,53 require further investigation.
Strengths and limitations
To the best of our knowledge, this two-centre analysis represents the largest study to date to evaluate the clinical course of AscAAs with repeated measurement analysis of aortic diameter, using roughly 8000 studies.
A limitation includes that data were collected retrospectively. Potentially, referral centre bias is present, as two academic hospitals participated. Between these centres, there exists practice variation regarding follow-up and imaging protocols. This study was conducted in the Dutch healthcare system, and the results may not be applicable to other healthcare systems. Furthermore, the aorta images obtained for this study were not re-measured following a pre-specified imaging protocol. Not all CT scans were ECG gated. This may have led to measurement errors between sequential measurements of the SoV; however, this constituted a minor proportion of imaging studies. The aortic diameter was also not measured according to pre-specified guidelines specific to this study. Also, cause of death was unknown in 76% because a personal records registration was consulted and causes of death are not provided by this registry. Undoubtedly, incidence rates of all AAEs represent an underestimation of the true incidence rate at a population level, as events were only observed in patients that survived until admission. For multivariable analysis, we assumed missing data to occur at random.
This cohort forms a selected cohort of patients having entered a diagnostic programme for aortic disease rather than a population-based cohort, which should be acknowledged.31 It is also possible that inclusion bias is at play, since radiologists less often report aortic diameter in women compared with men who had aortic imaging.54
Conclusions
This study finds profound male–female differences in SoV and ascending aortic growth, and clinical outcomes, especially among older individuals diagnosed with an aortic root and/or AscAA. Unravelling of these intertwined observations will provide a deeper understanding of AscAA progression and outcome in men and women and can be used as an evidence base for patient-tailored clinical guideline development.
Acknowledgements
We thank Amza Bayat, BSc, for his contributions to the data collection process and Eleni-Rosalina Andrinopoulou, PhD, for her statistical advice regarding the crossed random-effects in our longitudinal models for aneurysm growth. This work was presented at The European Society of Cardiology Annual Meeting (August 2023).
Supplementary data
Supplementary data are available at European Heart Journal online.
Declarations
Disclosure of Interest
All authors declare no disclosure of interest for this contribution.
Data Availability
All data and analyses will be made fully available upon reasonable request.
Funding
This research was funded by ZonMW (project number: 849200014), in light of the national Size Matters Consortium. More details can be found through this digital link: https://www.zonmw.nl/nl/over-zonmw/diversiteit/programmas/project-detail/gender-en-gezondheid/size-matters/.
Ethical Approval
The protocol for this study was reviewed and approved by the local medical ethics committees of the Erasmus University Medical Centre (MEC-2018-1535) and the Radboud University Medical Centre (MEC-2019-5157). The need for informed consent was waived.
Pre-registered Clinical Trial Number
None supplied.
References
Author notes
Maximiliaan L Notenboom and Adine R de Keijzer contributed equally to the study.

